1219
Exploring diffusion derived connectivity patterns between cognitively impaired and nonimpaired active professional fighters1Imaging, Cleveland Clinic Lou Ruvo Center for Brain Health, Las Vegas, NV, United States
Synopsis
In this study, we utilized the diffusion MRI (
Introduction
Studies have shown that both active and retired active professional athletes with repeated head trauma are more likely to suffer from cognitive decline and loss of executive and attention functions when compared to age-matched healthy controls1. Studies with diffusion-weighted magnetic resonance imaging (dMRI) in active fighters have shown increased mean diffusivity (MD) and decreased fractional anisotropy (FA) in the temporal and occipital white matter (WM) tracts and splenium of corpus callosum2–4. However, it is still unclear whether coordinated variations in structural connectivity pattern exists and differs between cognitively impaired and nonimpaired active professional fighters. Hence, in this study, we investigated using graph-theoretical approaches whether there exists a differentiated structural connectivity pattern between cognitively impaired and nonimpaired active professional fighters using dMRI dataset from the Professional Fighters Brain Health Study (PFBHS)5.Methods
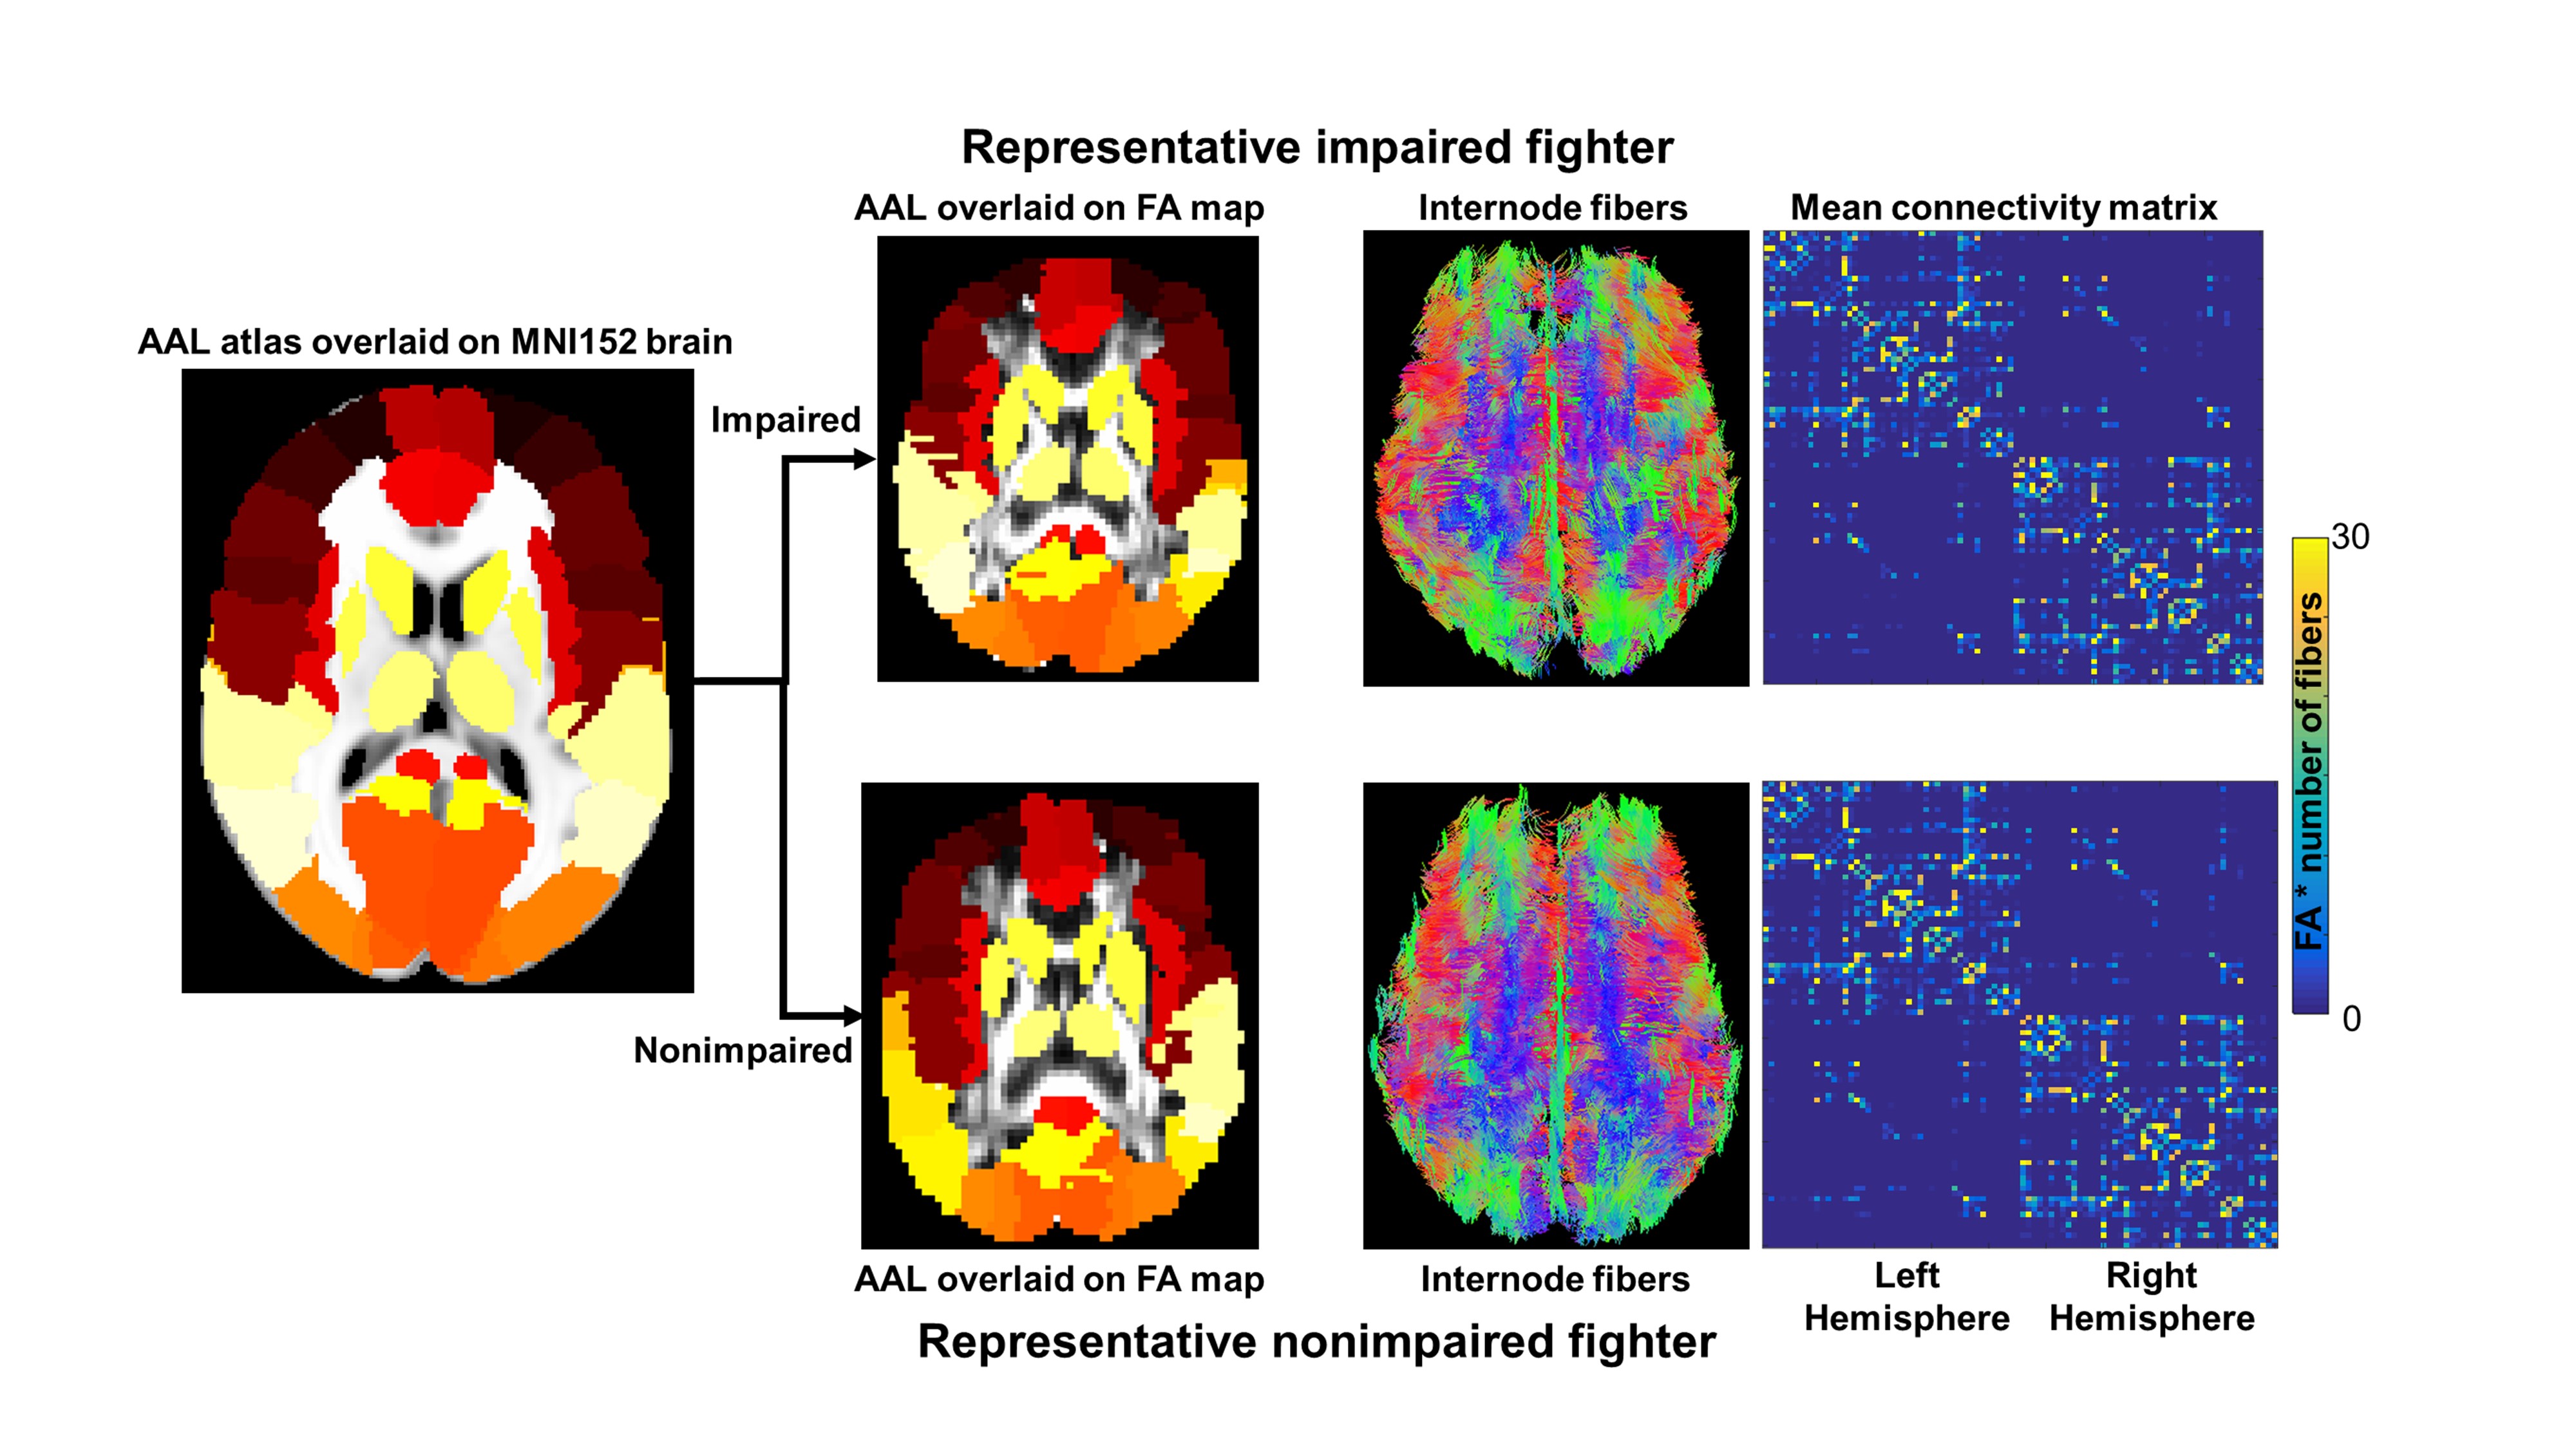
Subjects: A total of 252 active professional fighters (18 females (F)) were recruited at our centre. Each subject went through a battery of neuropsychological assessment tests to measure psychomotor speed (PSY) and processing speed (P). The fighters were classified as cognitively impaired if the standardized PSY and P scores were 1.5 standard deviations below the mean6. The rest were classified as nonimpaired fighters. In addition, the single-shot-EPI sequence was used to acquire dMRIs with 71 diffusion directions and b-value of 1000 s/mm2; TR/TE/Resolution=7000ms/91ms/2.5mm3 on all subjects with a 3T Siemens Verio scanner with a 32 channel head coil. Only 70 impaired fighters (3F, age=29.91±6.29 years, years of education (YOE)=13.21±2.17 years) had acceptable dMRI data. 70 nonimpaired fighters (7F, age=29.2±6.5 years, YOE=13.66±1.68 years) were then selected randomly from the cohort of nonimpaired active fighters but matched for all demographics. Standard processing steps were used to fit diffusion tensors after eddy current distortion correction in FSL. Network construction: AAL (mainly cortical) atlas7 was used to generate 90 AAL nodes of the network. T1-weighted MNI152 brain was normalized to each subject’s native diffusion space and the resultant transformation matrix was applied to the AAL atlas to get the nodes in subject’s native space. Whole brain tractography was performed using diffusion toolkit (http://www.trackvis.org/dtk/)8. The nodes were expanded by four voxels9 and only those fibre-tracts that had their ends in either node were retained. Fibers smaller than 6mm and internode connectivity with less than 10 fibres were filtered from any further analysis. Each internode connection (edge) was weighted by the product of the number of fibres and average FA of the fibres connecting the two nodes. Graph-theoretical measures: Degree and modularity measures were computed using GRETNA10 within each group. Various sparsity thresholds (5-40%, step=1%) were used to identify the minimum sparsity at which the network is fully connected. The module with the highest degree was retained for regression analysis. Statistical analysis: Network-based statistic (NBS)11 was used to statistically quantify differences in the binarized structural connectivity pattern between the groups. A linear regression between nodal degree and neuropsychological scores was performed for the nodes with the highest degree in each module after controlling for age, gender, and years of education.Results
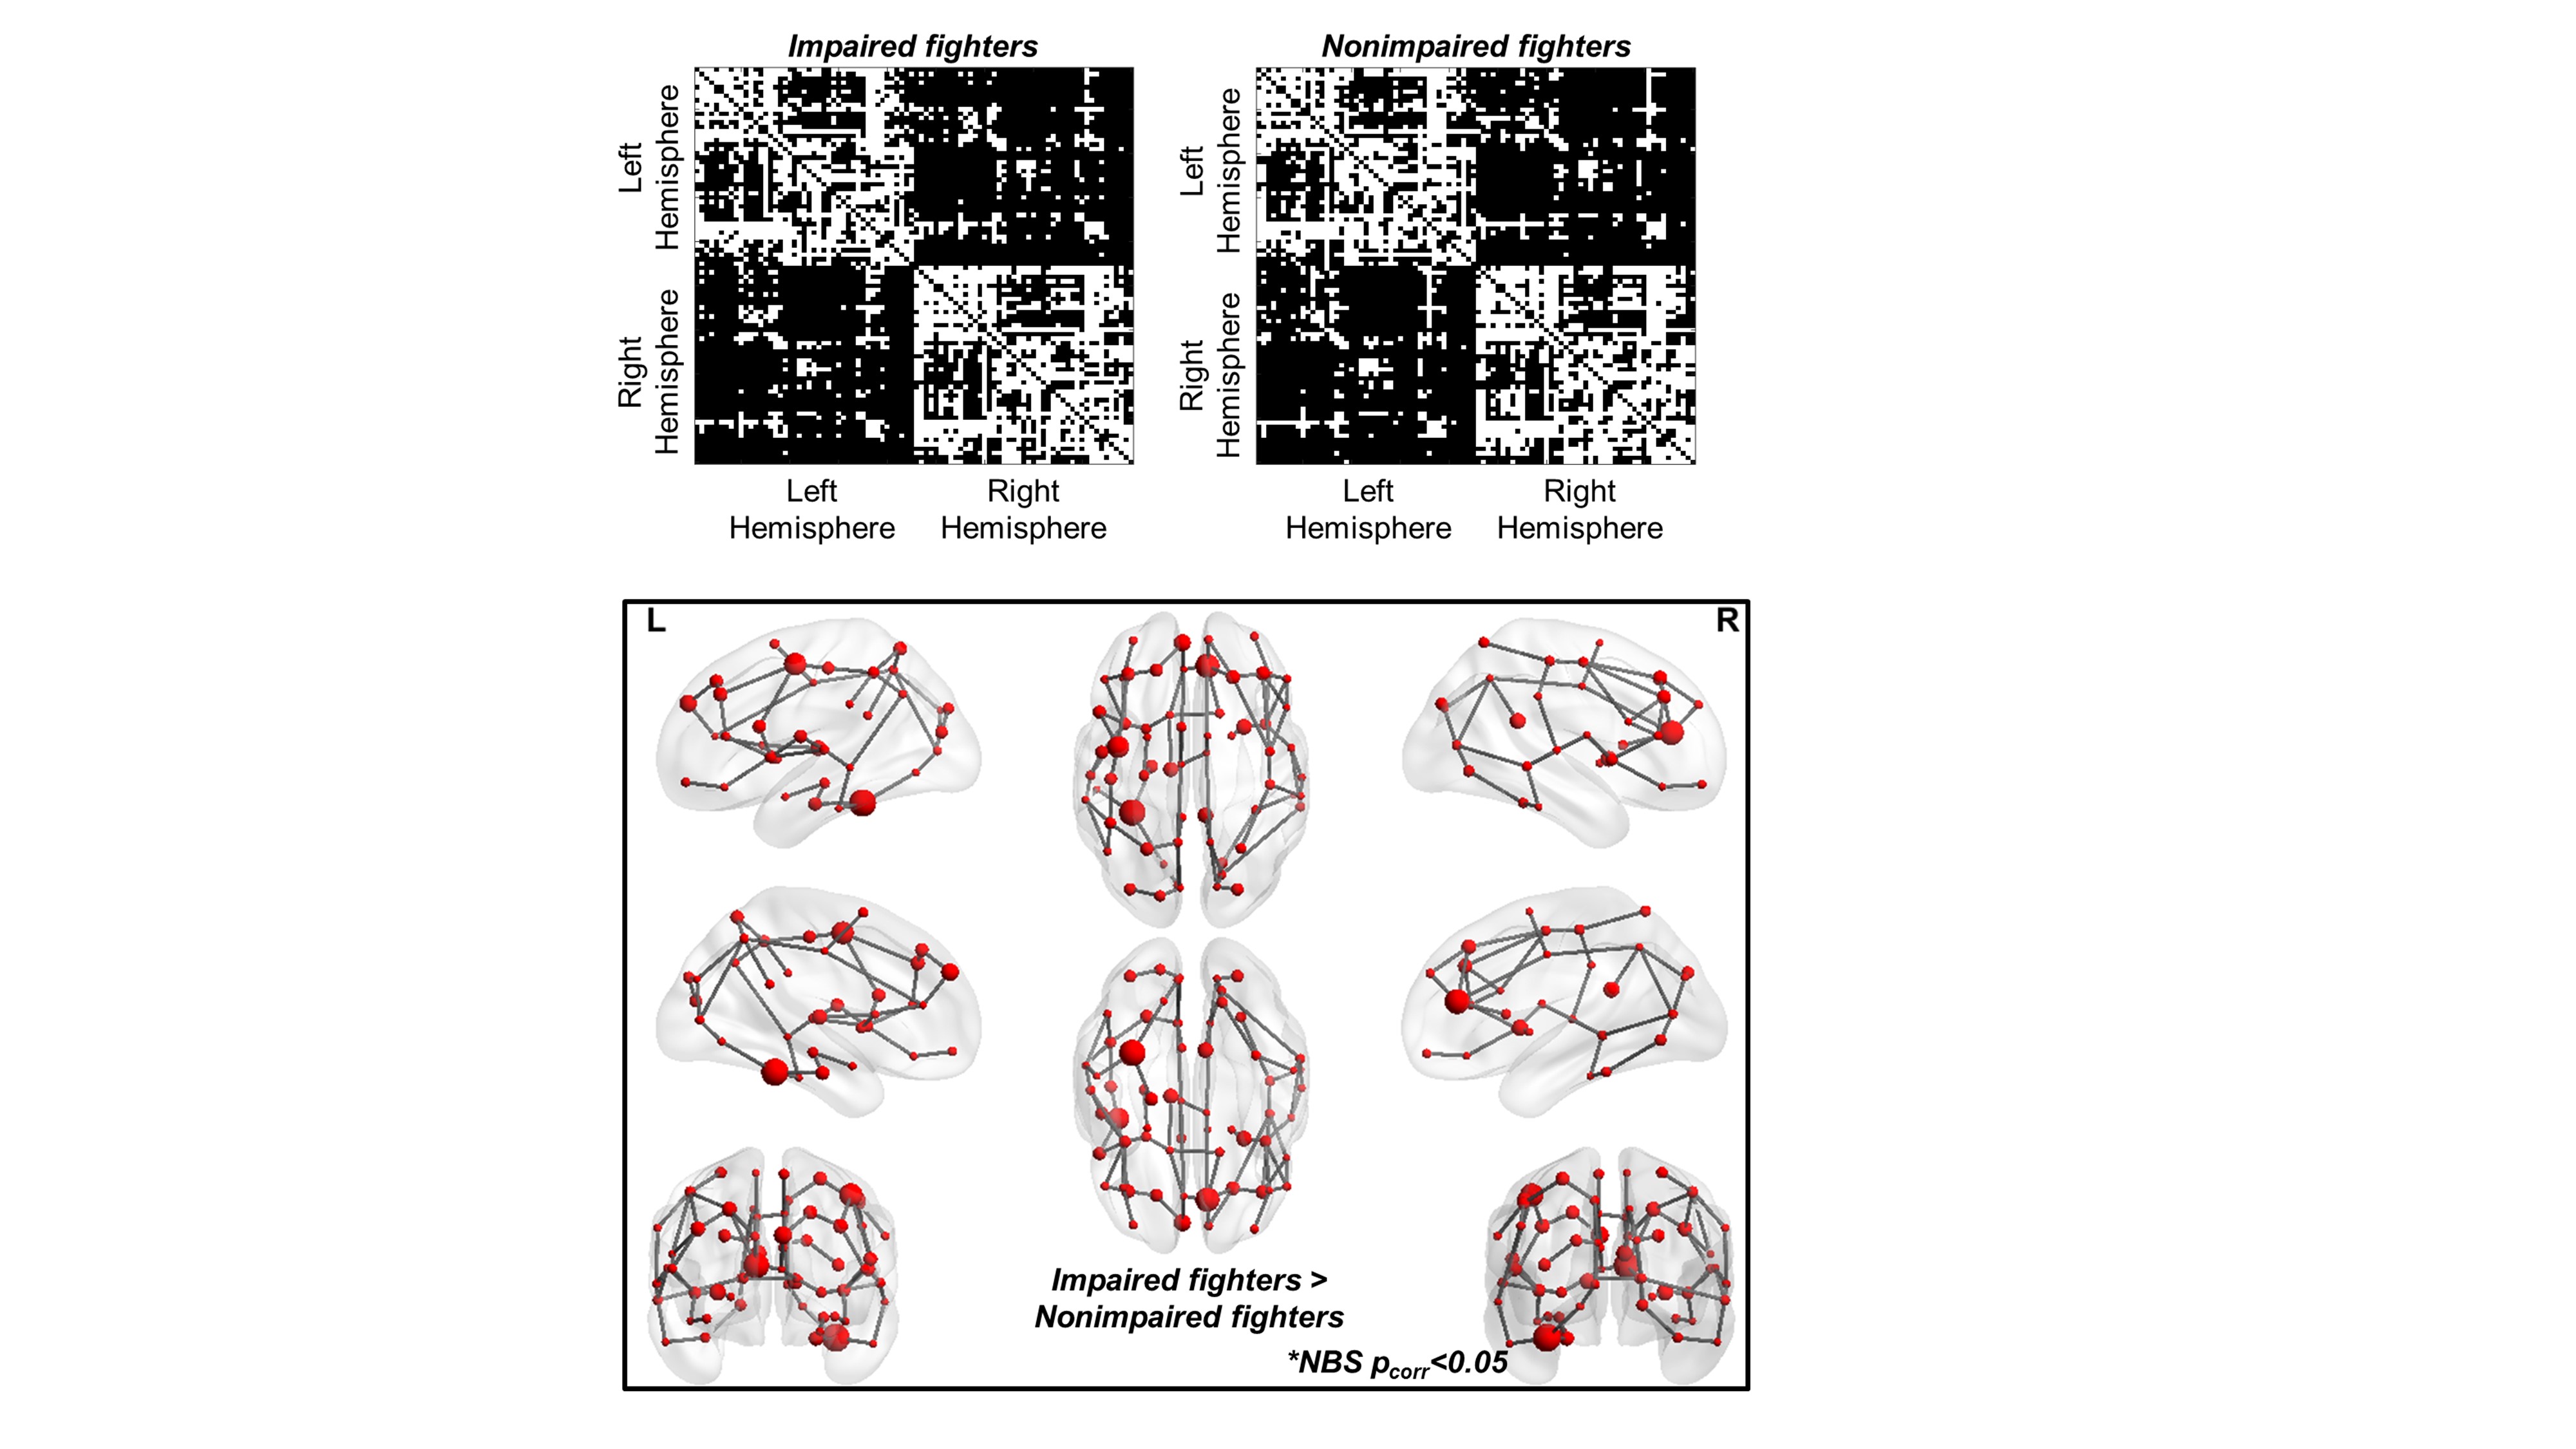
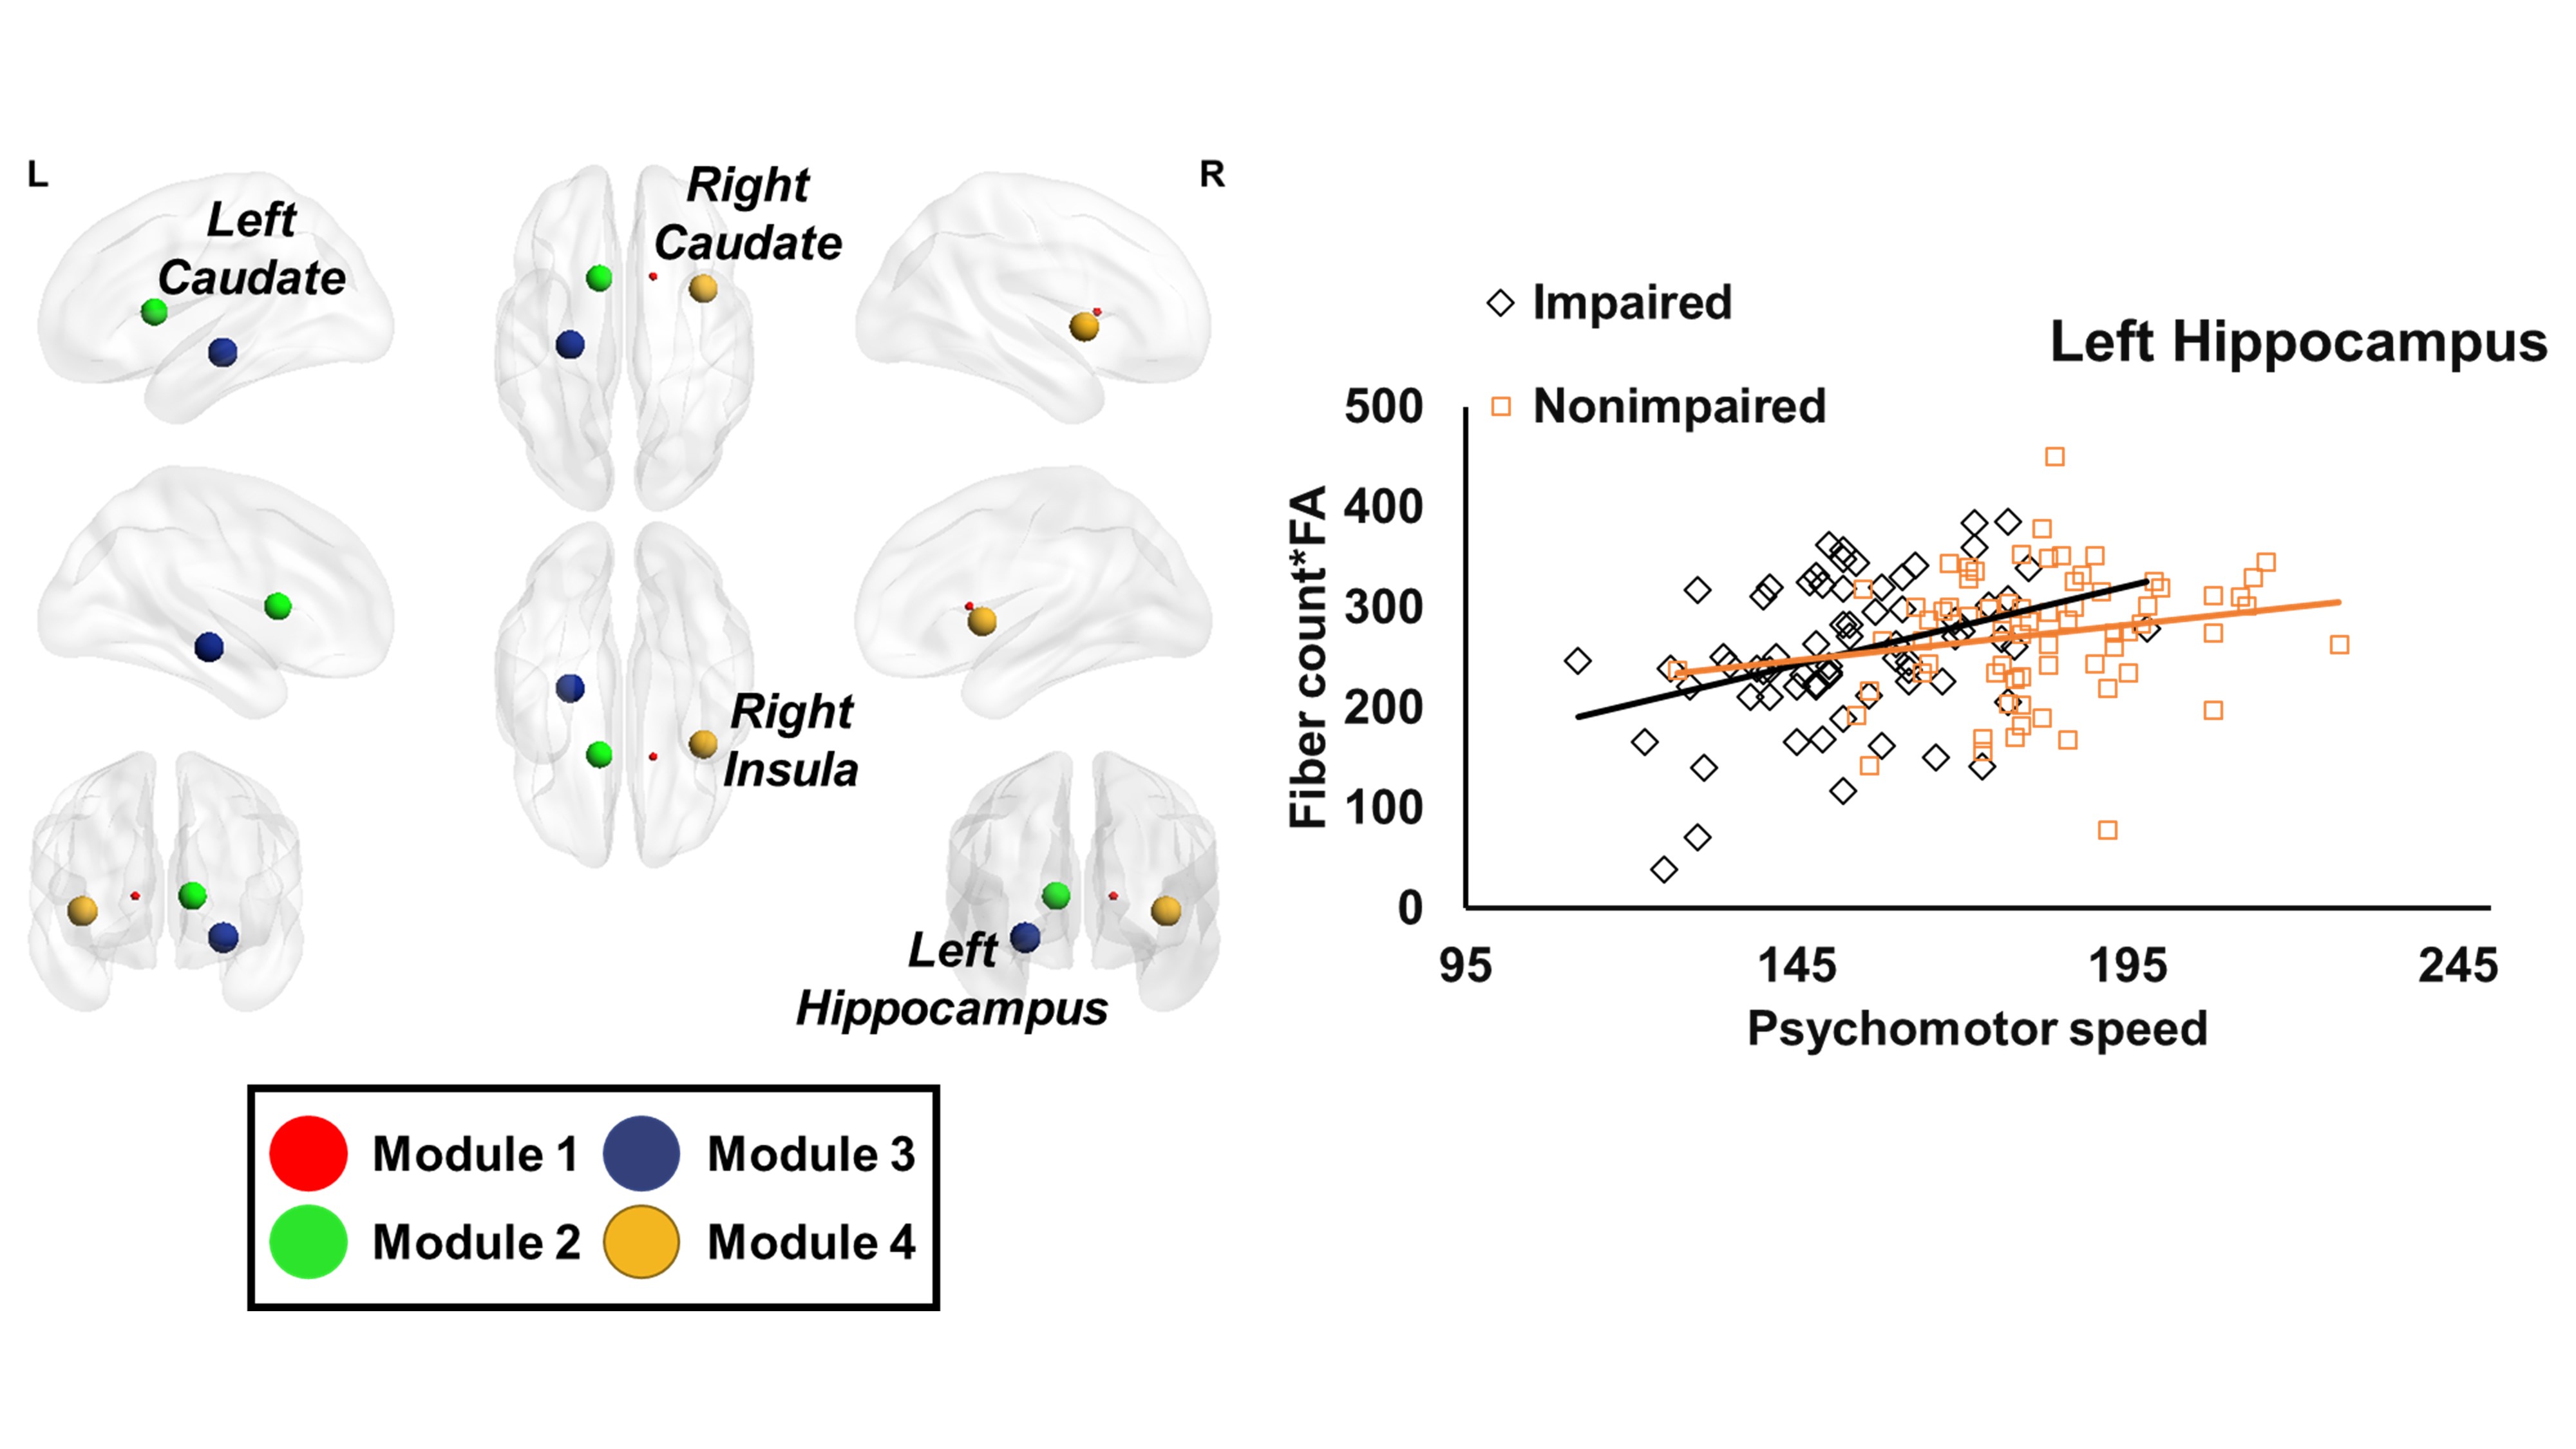
As shown in Fig.1, most of the cortical-subcortical fibres were retained (representative impaired fighter (top-row) and a nonimpaired fighter (bottom-row)) as internode fibres. The mean connectivity matrix does not reveal any qualitative differences between the groups. However, NBS revealed that impaired fighters have disrupted connectivity pattern and most of the short-range fibres have higher connections in impaired fighters (Fig.2). Both degree and modularity were statistically lower in impaired fighters as can be seen in Fig.3. However, both the groups revealed the same nodes namely bilateral caudate, left hippocampus and right insula, with the highest degree in their respective modules. But as can be seen in the left panel of Fig 4, right caudate had a significantly lower degree in impaired fighters. Also, both the groups had a statistically significant positive relationship with PSY speed.Discussion and Conclusion
We showed for the first time in this study, that there is a disrupted structural connectivity pattern between cognitively impaired and nonimpaired fighters. Repeated head trauma induces increased short-range connectivity pattern that may be responsible for cognitive damage in active fighters. Our finding suggests that repeated head trauma induces complex heterogeneous pattern as no association was found in these connectivity patterns with exposure to fighting.Acknowledgements
The study issupported by the National Institutes of Health (grant number 1R01EB014284 and P20GM109025).References
1 McKee AC, Stern RA, Nowinski CJ, et al. The spectrum of disease in chronic traumatic encephalopathy. Brain 2013; 136: 43–64.
2 Montenigro PH, Bernick C, Cantu RC. Clinical features of repetitive traumatic brain injury and chronic traumatic encephalopathy. Brain Pathol 2015; 25: 304–17.
3 Hulkower MB, Poliak DB, Rosenbaum SB, Zimmerman ME, Lipton ML. A decade of DTI in traumatic brain injury: 10 years and 100 articles later. AJNR Am J Neuroradiol 2013; 34: 2064–74.
4 Wintermark M, Sanelli PC, Anzai Y, Tsiouris AJ, Whitlow CT. Imaging evidence and recommendations for traumatic brain injury: advanced neuro- and neurovascular imaging techniques. AJNR Am J Neuroradiol 2015; 36: E1–11.
5 Bernick C, Banks S, Phillips M, et al. Professional fighters brain health study: Rationale and methods. Am J Epidemiol 2013; 178: 280–6.
6 Schinka JA, Loewenstein DA, Raj A, et al. Defining mild cognitive impairment: impact of varying decision criteria on neuropsychological diagnostic frequencies and correlates. Am. J. Geriatr. Psychiatry. 2010; 18: 684–91.
7 Tzourio-Mazoyer N, Landeau B, Papathanassiou D, et al. Automated anatomical labeling of activations in SPM using a macroscopic anatomical parcellation of the MNI MRI single-subject brain. Neuroimage 2002; 15: 273–89.
8 Wang R, Wedeen VJ. TrackVis.org. In: Proc Intl Soc Mag Reson Med. 2007: 3720.
9 Jeon T, Mishra V, Huang H. Effects of cortical regions of interests on tractography and brain connectivity quantification. In: Proc Intl Soc Mag Reson Med. 2016: 2063.
10 Wang J, Wang X, Xia M, Liao X, Evans A, He Y. GRETNA: a graph theoretical network analysis toolbox for imaging connectomics. Front Hum Neurosci 2015; 9: 386.
11 Zalesky A, Fornito A, Bullmore ET. Network-based statistic: identifying differences in brain networks. Neuroimage 2010; 53: 1197–207.
Figures