1218
Are prediabetes and type 2 diabetes associated with white matter connectivity alterations? The Maastricht Study1Radiology and Nuclear Medicine, Maastricht University Medical Center, Maastricht, Netherlands, 2Medicine, Maastricht University Medical Center, Maastricht, Netherlands
Synopsis
Type 2 diabetes (T2DM) is associated with cognitive decline, while prediabetes may already show comparable cognitive decrements. We investigated whether white matter network integrity is associated with prediabetes and/or T2DM in a large population-based cohort study. For calculation of white matter volumes and graph measures, 3T structural and diffusion MRI (dMRI) were performed. Prediabetes had lower clustering coefficient and local efficiency compared to NGM. Communicability was significantly higher in T2DM, but not in prediabetes, which suggests that alternative white matter connections are used to compensate for structural disturbances and white matter decline, which may not be present yet in prediabetes.
Introduction
Type 2 diabetes (T2DM) is associated with cognitive decline, due to simultaneous cerebrovascular and neurodegenerative changes, at a rate that is likely increased relative to normal ageing. Prediabetes may already show comparable cognitive decrements. Previous studies have shown an association of T2DM and prediabetes with white matter atrophy, demonstrating that changes in brain tissue can already be detected in the prediabetes phase. The architecture of white matter tracts is thought to reflect cognitive abilities more closely than volumetric measures, and is therefore proposed as an alternative, and possibly more sensitive, tissue marker of cognitive decline. We investigated whether white matter network integrity is associated with both prediabetes and T2DM in a large population-based cohort study.Methods
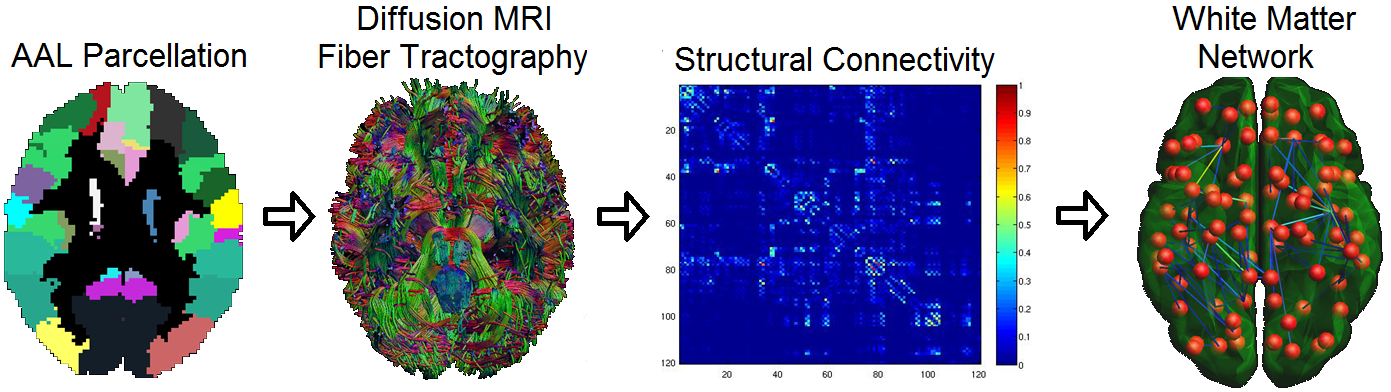
In the Maastricht Study1, a T2DM-enriched population-based cohort study (n=510 T2DM, n=348 prediabetes, n=1361 normal glucose metabolism (NGM), 52% men, aged 59±8 years) underwent 3T MRI (MAGNETOM Prisma fit, Siemens Healthcare, Erlangen, Germany) by use of a 64-element head/neck coil. A 3D T1-weighted magnetization prepared rapid acquisition gradient echo (MPRAGE) sequence (TR/TE/TI 2300/2.98/900 ms, 1.00 mm isotropic voxel, 176 continuous slices, matrix size of 256x240 and field-of-view of 256 mm) was acquired for anatomic reference. DTI data were acquired using an echo-planar imaging (EPI) sequence (TR/TE 6100/57 ms, 2.0 mm cubic voxel size, 64 diffusion sensitizing gradient directions, with a b-value of 1200 s/mm2 and three scans with b=0). For analysis the automatic anatomical labeling (AAL) atlas was used with N=120 regions. The AAL-based volumes of interest were transformed to DWI space for each individual subject. The main preprocessing steps were corrections for eddy current induced geometric distortions and head motion, and estimation of the diffusion tensor. After preprocessing, fiber orientation distributions (FOD) were estimated using constrained spherical deconvolution (CSD), which allows fiber tracking through regions with crossing fibers using and whole brain probabilistic tractography. Structural scans were automatically segmented (with visual inspection) into different tissue types (e.g., white matter) and graph theoretical network analysis was performed on dMRI-derived fibers to investigate alterations in structural white matter networks. Processing steps are summarized in Figure 1. Individual structural networks, based on tract volumes, were masked by a group averaged network and thresholded for a range of sparsity values (0.5-0.9). Multivariable linear regression analysis was used to investigate the association of glucose metabolism status with graph measures. Associations were adjusted for age, sex, and sparsity value of the network.Results
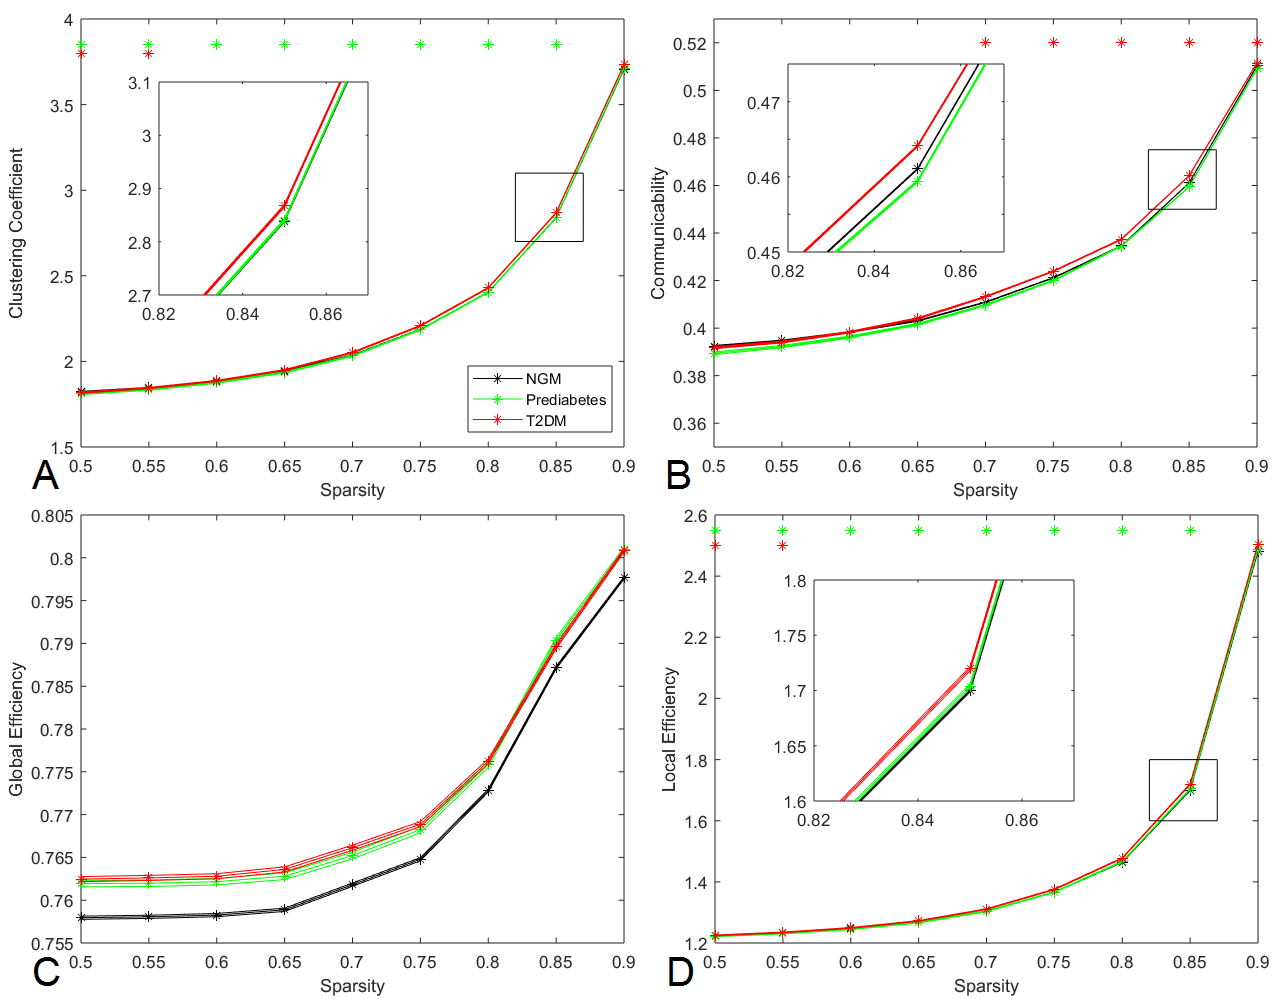
Participants with T2DM (β = -0.006, 95% CI -0.008; -0.004, p-value < 0.001) and with prediabetes (β = -0.003, 95% CI -0.005; -0.001, p-value = 0.014) had smaller white matter volumes compared to participants with NGM. In Figure 2 the graph measures over a range of sparsity values are shown. Clustering coefficient and local efficiency were significantly lower in participants with prediabetes as compared to NGM (statistics for sparsity 0.85 are shown in Table 1). Communicability was significantly higher in participants with T2DM as compared to NGM. No significant alterations in global efficiency in participants with T2DM and prediabetes as compared to NGM were found.
Conclusion
These findings indicate that in participants with prediabetes the measures of segregation, clustering coefficient and local efficiency, were lower compared to participants with NGM after correction for age, sex, and sparsity value. The abnormal communicability suggests that participants with T2DM use alternative white matter connections to compensate for structural disturbances and white matter decline, but this compensatory mechanism may not be present yet in prediabetes. In the future, associations with other clinical characteristics will be evaluated.Acknowledgements
No acknowledgement found.References
Schram MT, Sep SJ, van der Kallen CJ, Dagnelie PC, Koster A, Schaper N, et al. The Maastricht Study: an extensive phenotyping study on determinants of type 2 diabetes, its complications and its comorbidities. European journal of epidemiology. 2014; 29(6):439-51.Figures