1215
Brain perfusion patterns and their relationships with fMRI resting state networks and arterial vascular territories1Fondazione Don Carlo Gnocchi ONLUS, Milan, Italy, 2Department of Electronics, Information and Bioengineering, Politecnico di Milano, Milan, Italy, 3Buffalo Neuroimaging Analysis Center, Department of Neurology, School of Medicine and Biomedical Sciences, University at Buffalo, State University of New York, Buffalo, NY, United States, 4Università degli Studi di Milano, Milan, Italy, 5Radiology, Fondazione Don Carlo Gnocchi ONLUS, Milan, Italy
Synopsis
In this study, we aimed to assess the consistency of the perfusion patterns that can be extracted using independent component analysis (ICA) on cerebral blood flow (CBF) maps derived from arterial spin labeling (ASL) data. Furthermore, we aimed to evaluate the similarity between the CBF-derived components and the well-known spatial patterns of functional MRI resting state networks (RSN) and cerebral vascular territories (VT). Our results showed that good spatial constancy of perfusion patterns can be extracted from CBF maps. Almost all the derived components overlapped with RSN or specific VT.
INTRODUCTION
Arterial spin labeling (ASL) provides the opportunity to detect resting state functional networks (RSN), which are commonly extracted from blood oxygenated-dependent (BOLD) data1. Furthermore, previous studies showed that cerebral vascular territories (VT) could be mapped by specifically tagging major arteries supplying the brain2. In this study, we aimed to assess the consistency of the perfusion patterns that can be extracted using independent component analysis (ICA) on cerebral blood flow (CBF) maps of healthy controls (HC), and to evaluate the similarity between the CBF-derived components and the well-known spatial patterns of RSN and VT.METHODS
Sixty-five HC (mean age= 42.5±18.4, 30 females) (whole group - G) were imaged on a 1.5 Siemens scanner. The acquisition protocol included a high resolution T1-weighted image(TR=1900 ms, TE=3.37 ms, resolution=1×1×1 mm3, 176 axial slices) and a multi-delay pseudo-continuous ASLwith background suppressed GRASE sequence (TR/TE=3500/22.58 ms, labeling duration=1500 ms, 5 post-labelling delays=[700, 1200, 1700, 2200, 2700] ms, 12 pairs of tag/control images for each delay, resolution=3.5x3.5x5 mm3, 32 slices). ASL data were preprocessed (i.e. re-alignment, motion correction and partial volume correction), and gray matter CBF maps were computed3. Then, CBF maps were aligned to the corresponding T1-weighted images and registered to MNI standard space4. In order to test perfusion pattern consistency, the 65 HC were randomly split in two age and sex-matched groups (G1 and G2, consisting of 33 and 32 HC respectively). ICA (dimensionality=10) was performed5 on G1 and G2 data separately. Reliability of obtained ICs was assessed with Icasso6 (stability index ≥ 0.8). The reliable components (ICs) were visually compared between G1 and G2, in order to verify if corresponding CBF pattern could be identified in both the groups independently. Furthermore, Dice Similarity index (DSI) was computed between ICsG1 and ICsG2 to quantify the overlap between matching ICs7,8. Once assessed the consistency of the CBF patterns, ICA (dimensionality=15) was run on the whole G-dataset. ICA with higher dimensionality with respect to G1/G2 analysis was allowed by the bigger sample size. The obtained reliable ICs were visually and quantitatively (i.e. with DSI) compared to Smith’s RSN template9 and to a VT atlas. The used VT atlas identified areas supplied by left and right anterior, middle and posterior cerebral arteries (ACA, MCA and PCA respectively).10RESULTS
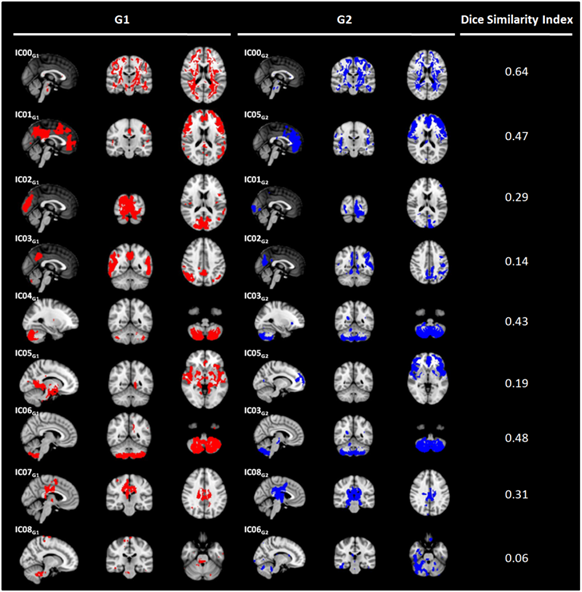
Nine out of ten ICsG1 and ICsG2 were classified as stable. For all reliable components, ICG1-ICG2 pairs showing similar perfusion patterns were visually recognized (Figure 1). According to DSI, the matching was classified as fair/moderate8 for five out of nine ICs (IC00G1-IC00G2, DSI=0.64; IC01G1-IC05G2, DSI=0.45; IC04G1-IC03G2, DSI=0.43; IC06G1- IC03G2, DSI=0.48; IC07G1-IC08G2, DSI=0.31). ICA performed on G-dataset resulted in eleven out of fifteen reliable ICs (Figure 2). At the visual inspection, IC00G was not classified neither as a VT nor as a RSN. IC01G was classified as visual RSN (DSI=0.43) and right PCA VT (DSI=0.34) (Figure 3). IC02G partially overlapped with executive RSN (DSI<0.30), with the frontal portion of the two fronto-parietal RSNs (DSI<0.30), and with right MCA VT (DSI=0.34). IC03G was classified as right fronto-parietal RSN (DSI=0.42) and right MCA VT (DSI=0.93). IC04G overlapped with default mode network (DSI=0.31) and left MCA VT (DSI=0.56). IC05G was identified as sensory-motor RSN (DSI<0.3), while IC06G and IC07G overlapped to visual RSN (DSI<0.30 and DSI=0.41 respectively). IC09G overlapped to auditory RSN (DSI=0.42), and left and right MCA VT (DSI=0.32 and 0.58 respectively). IC08G and IC10G were identified as cerebellum ICs but did not overlap with any of Smith’s RSN or VT.DISCUSSION
ICsG1 vs ICsG2 comparison showed good consistency of the perfusion patterns that can be identified by performing ICA on HC CBF maps. The majority of ICsG could be visually matched with either a RSN or a VT, and showed fair/moderate overlap with them8. Although presenting DSI<0.30 with any RSN/VT, IC05G could be identified as sensory motor RSN pattern at the visual inspection. IC00G clearly represented the white matter still included in the used gray matter mask, thus it could be considered as a component of no interest. Finally, IC08G and IC10G represented perfusion pattern of the cerebellum that is known to be supplied by vertebral arteries11, but which is not included in the used VT atlas.CONCLUSIONS
ICA performed on ASL data allows to consistently identify robust common perfusion patterns, similar to either RSN or specific VT. Therefore, this approach could be used to investigate the coupling strength between perfusion, function and the inflow from major cerebral arteries.Acknowledgements
This study was in part funded by a grant awarded by the Annette Funicello Research Fund for Neurological Diseases.
Prof. Danny JJ Wang (UCLA, CA, USA) provided us with the pCASL sequence.
References
1. Dai W, Varma G, Scheidegger R, Alsop DC. Quantifying fluctuations of resting state networks using arterial spin labeling perfusion MRI. Journal of Cerebral Blood Flow & Metabolism 2016. 36(3):463-73.
2. Paiva FF, Tannús A, Talagala SL, Silva AC. Arterial spin labeling of cerebral perfusion territories using a separate labeling coil. Journal of Magnetic Resonance Imaging 2008. 1;27(5):970-7.
3. Chappell MA, Groves AR, Whitcher B, Woolrich MW. Variational Bayesian inference for a nonlinear forward model. IEEE Transactions on Signal Processing. 2009;57(1):223-36.
4. Avants BB, Tustison N, Song G. Advanced normalization tools (ANTS). Insight j. 2009;2:1-35.
5. Beckmann, C.F. and S.M. Smith, Probabilistic independent component analysis for functional magnetic resonance imaging. IEEE Trans Med Imaging. 2004. 23(2): p. 137-52.
6. Himberg J, Hyvarinen A. Icasso: software for investigating the reliability of ICA estimates by clustering and visualization. InNeural Networks for Signal Processing, 2003. NNSP'03. 2003 IEEE 13th Workshop on 2003 Sep 17 (pp. 259-268). IEEE.
7. Zhu S, Fang Z, Hu S, Wang Z, Rao H. Resting state brain function analysis using concurrent BOLD in ASL perfusion fMRI. PloS one 2013. 4;8(6):e65884.
8. Zijdenbos AP, Dawant BM, Margolin RA, Palmer AC. Morphometric analysis of white matter lesions in MR images: method and validation. IEEE transactions on medical imaging 1994.13(4):716-24.
9. Smith SM, Fox PT, Miller KL, Glahn DC, Fox PM, Mackay CE, Filippini N, Watkins KE, Toro R, Laird AR, Beckmann CF. Correspondence of the brain's functional architecture during activation and rest. Proceedings of the National Academy of Sciences 2009. Aug 4;106(31):13040-5.
10. Tatu L, Moulin T, Bogousslavsky J, Duvernoy H. Arterial territories of the human brain cerebral hemispheres. Neurology 1998. 1;50(6):1699-708.
11. Kansagra AP, Wong EC. Mapping of vertebral artery perfusion territories using arterial spin labeling MRI. Journal of Magnetic Resonance Imaging 2008.1;28(3):762-6.
Figures


Stable ICsG (in red) that showed DSI>0.30 for the overlap with a RSN from Smith’s template (in yellow, left column) or with a Vascular Territory (VT - in green, right column). Each ICG and Smith's template ICs where thresholded with z=3.
Legend: Aud-auditory network; DMN-default mode network; Exe-executive; lACA-left anterior cerebral artery; lFPN-left fronto-parietal network; lMCA-left middle cerebral artery; lPCA-left posterior cerebral artery; rFPN-right fronto-parietal network; rMCA-right middle cerebral artery; rPCA-right posterior cerebral artery; VM-Visual medial network.