1212
A novel approach for fMRI of rodents actively performing optogenetic self-stimulation1Neuroimaging Research Branch, National Institute on Drug Abuse, NIH, Baltimore, MD, United States, 2Behavioral Neuroscience Research Branch, National Institute on Drug Abuse, NIH, Baltimore, MD, United States
Synopsis
Linking the dynamics of neural circuits to behavior is arguably a central theme in neuroscience. fMRI in rodent animals offers the opportunity to combine systems-level brain readout with modern in-vivo cell biology tools, such as DREADDS and optogenetics, to dissect circuit dynamics. Despite efforts to image awake rodents to avoid confounds from anesthesia, there has been no report on fMRI of rodent animals being actively engaged in a goal-directed behavior. We report a method that permits fMRI of brain dynamics while a mouse is actively self-administering optogenetic stimulation, opening the door to real-time imaging of animal behavior using MRI.
Introduction
Linking the dynamics of neural circuits to behavior is arguably a central theme in neuroscience 1. Functional MRI in rodents offers the opportunity to combine systems-level brain readout with modern in-vivo cell biology tools, such as DREADDS 2 and optogenetics 3, to dissect circuit dynamics. Despite efforts to image awake rodents to avoid confounds from anesthesia 4-7, to the best of our knowledge, there has been no report on fMRI of rodent animals being actively engaged in a goal-directed behavior -- all tasks were administered by the experimenter. We now report a method that permits dynamic fMRI of brain dynamics while a mouse actively self-administers optogenetic stimulation to the medial prefrontal cortex, opening the door to real-time whole brain imaging of animal behavior using MRI.Methods
Under isoflurane
anesthesia, 14 C57BL/6J mice weighing 25-35g received microinjection of
pAAV1-hSyn-hChR2(H143R)-EYFP viral construct into the infralimbic cortex.
Another group of mice (n=7) received microinjection of viral construct
pAAV-hSyn-EYFP to serve as control. An optic fiber (200 µm core ID) was
chronically implanted. A head fixing post (4.5mm in diameter and 20mm in
length) was implanted on mouse skull. After 1 week of surgical recovery,
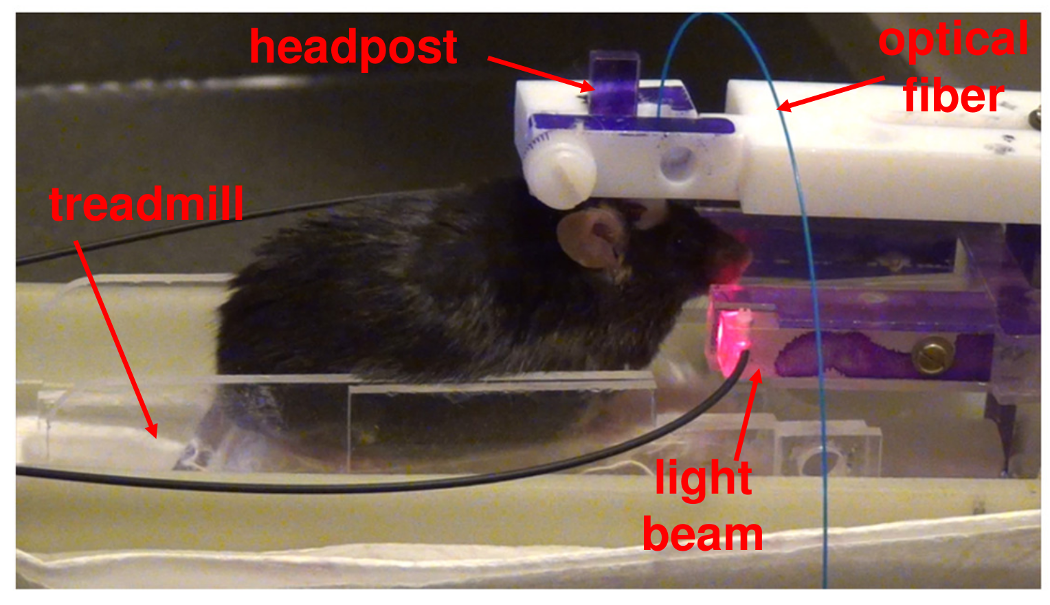
each mouse received a set of 3-phase trainings: Phase I: mice were trained to
walk/rest on a custom-made, MRI-compatible treadmill using a restricted water
access schedule. The treadmill had no external motor, and was directly moved by
the animal. Animals learned to lick for sucrose spout while remaining head-fixed,
which broke a customized red-light beam, triggering the reward (10% sucrose)
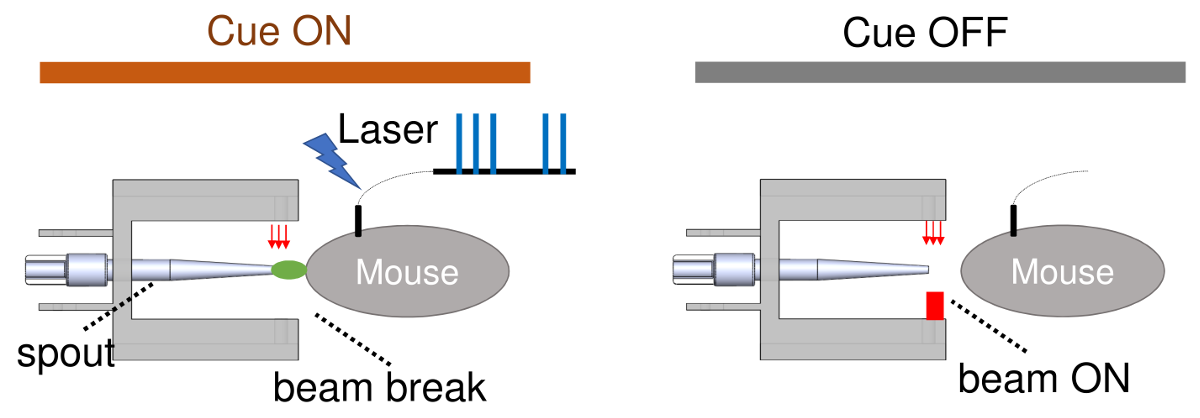
delivery. Phase II: mice were trained to learn the association between a light
cue and the availability of the reward, and to lick a spout for optogenetic
stimulation during Cue ON, but not Cue OFF. Phase III, animals were trained to
accommodate to the MRI noise inside a customized mock scanner. The entire
training took 3-4 weeks. The MRI-compatible treadmill, Cue control, reward
delivery, animal behavior (self-stimulation) monitoring, MR coil holder, mock
scanner etc were all developed in the lab.
MRI scans were performed
on a Bruker 9.4T scanner using a volume coil (86mm ID) for RF transmit and a
2cm surface coil for MR signal reception. fMRI data were acquired using a
single-shot gradient-recalled EPI sequence (FOV = 25x15 mm, matrix size =
96x58, TR = 1 s, TE = 15 ms, 15 slices with a slice thickness of 0.6 mm, number
of repetitions = 640). Reverse k-space trajectory was implemented on the
scanner to correct for geometric distortion in EPI images. Each scan session
last for no more than 45 min. Images from individual animals were co-registered
into a common space. fMRI data were analyzed using an event-related design in
AFNI. Excessive motion artifacts were removed with 3dDespike. Deconvolution was
applied with the dynamic reward-seeking data (lick-induced light beam-break) as
the input function, and the 6 rigid-body motion parameters from 3dvolreg as the
nuisance signal. BOLD response across animals were subject to t-test against 0
to derive the group activation maps.
Results
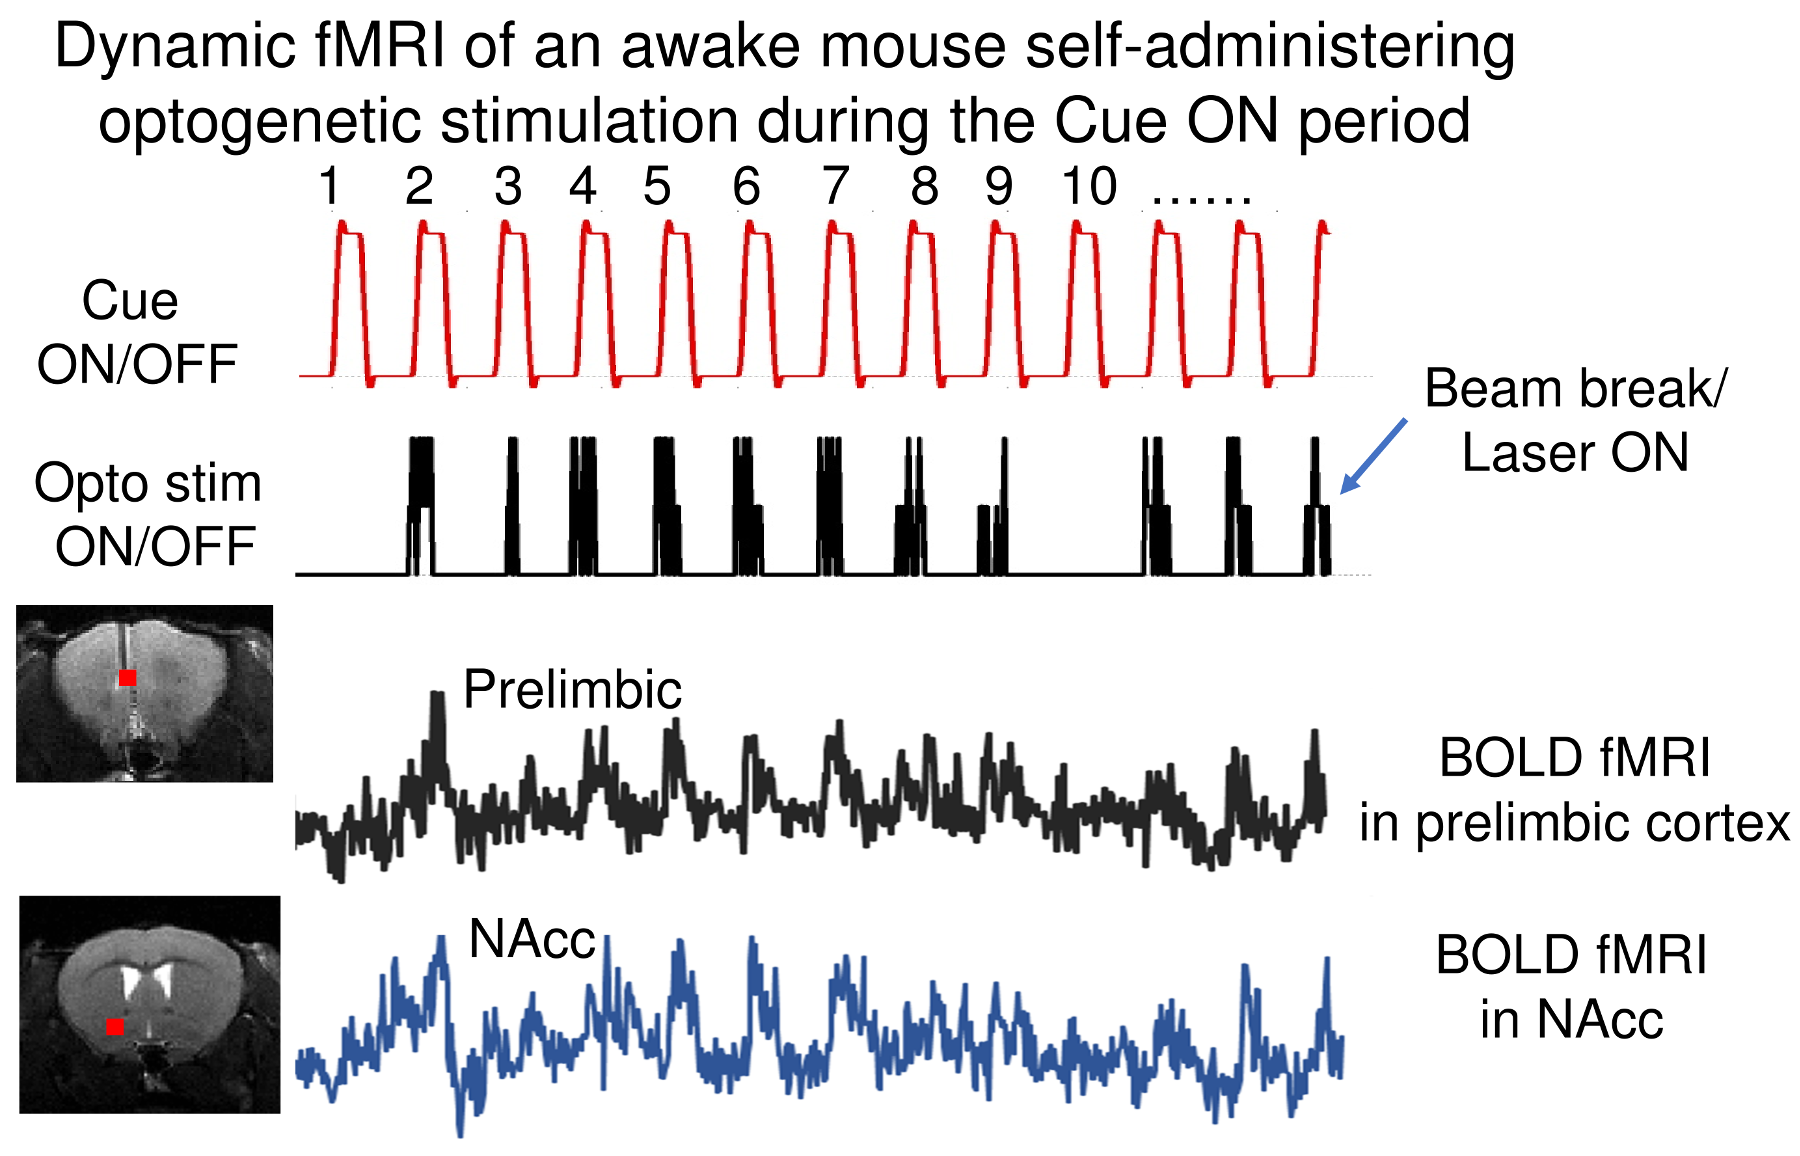
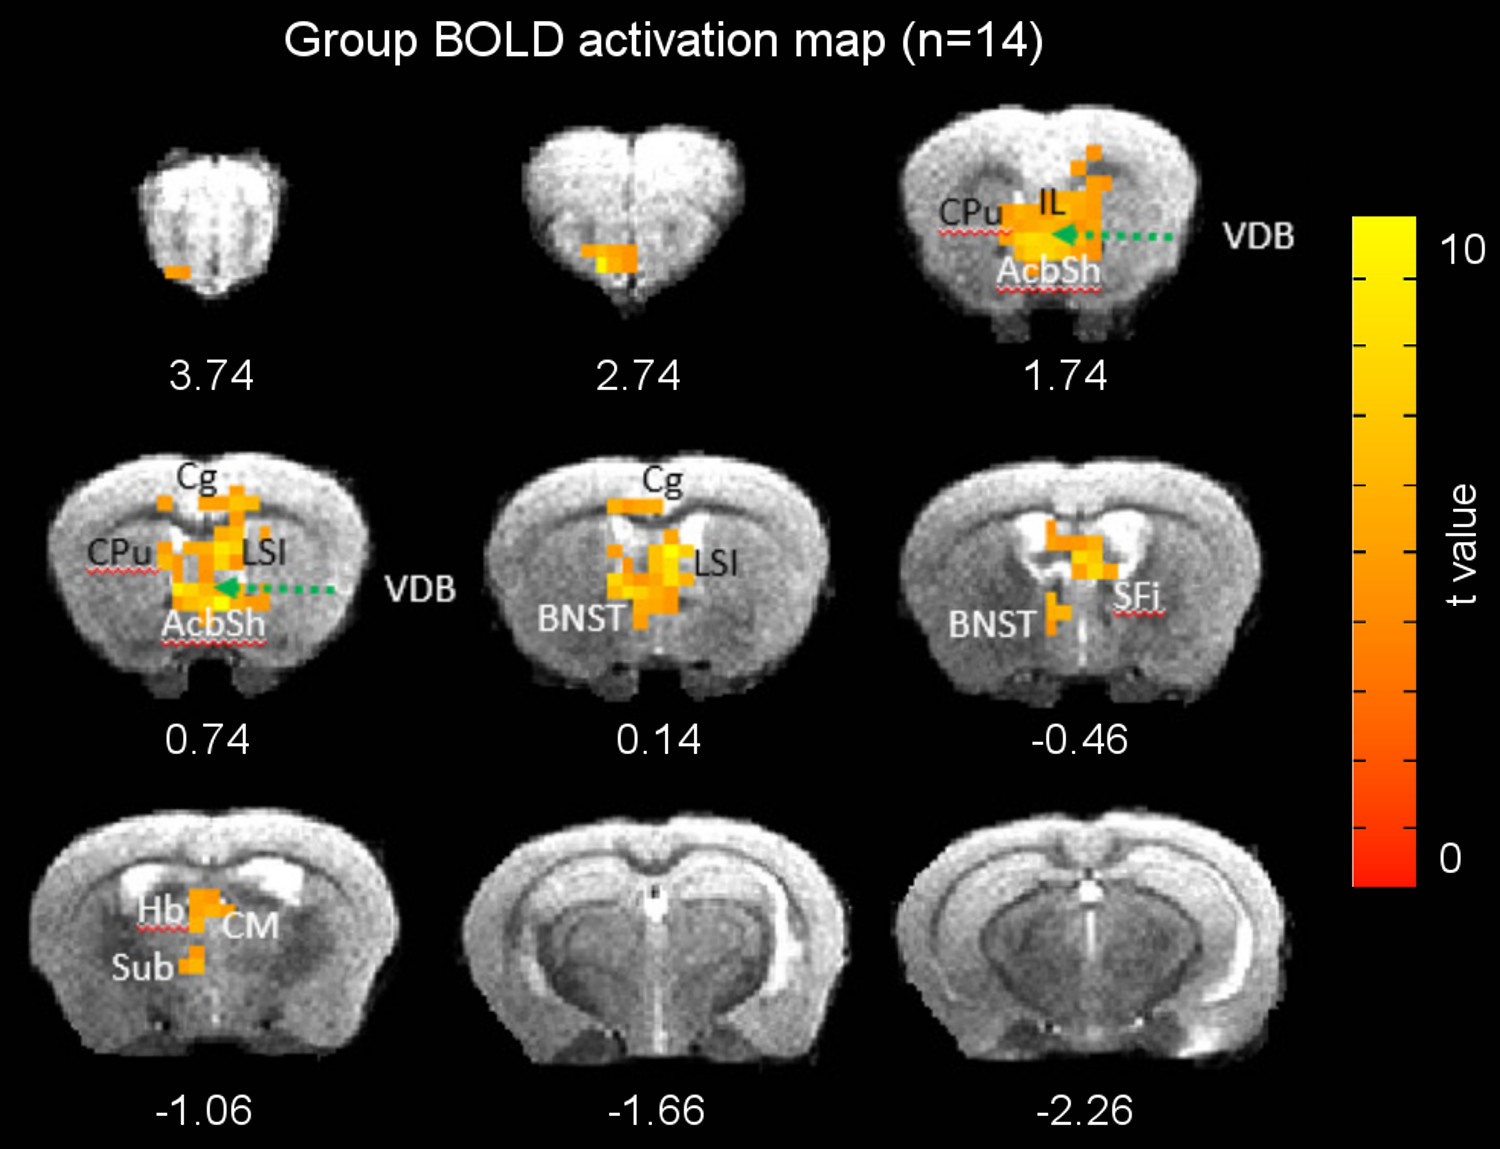
Figures 1 and 2 illustrate experimental setup and training paradigm. Figure 3 shows raw BOLD responses in the infralimbic cortex and the nucleus accumbens from one scan session. Unlike in conventional fMRI the number of stimulus was pre-determined by the experimenter, the number of self-stimulations across individual Cue ON period was uneven. For example, during the 1st and the 10th Cue ON period, the mouse chose not to self-stimulate. No significantly activated voxels in control mice. Figure 4 shows group activation map corrected for multiple comparison. Activated areas are consistent with known reward pathways 8.Conclusion/discussion
We demonstrate the feasibility of fMRI of brain dynamics while a mouse actively self-administered optogenetic stimulation. Conceptually our method has its root in positive reinforcement training, associative learning and decision making in the field of optical imaging and electrophysiology 9, 10. Problems unique to fMRI include limited bore clearance, noisy imaging environment, motion artifacts, and susceptibility induced image distortion and signal loss from implants. The thrust of this work lies in 1) a new awake MRI method; 2) more importantly a shift in imaging paradigm: animals were actively performing the task, instead of passively receiving a task, allowing for causative imaging of brain –behavior mechanisms in real time, rather than post training correlation of previous training/interventions. Our method can be readily applied to brain imaging (including PET) of many rodent disease models; it can also be applied to multimodal neurovascular coupling investigation (e.g. fMRI, optical imaging, electrophysiology etc).
Acknowledgements
This research was supported by the Intramural Research Program of the NIH, NIDA.References
1. O'Connor, D.H., Huber, D. & Svoboda, K. Reverse engineering the mouse brain. Nature 461, 923-929 (2009).
2. Armbruster, B., Li, X., Pausch, M., Herlitze, S. & Roth, B. Evolving the lock to fit the key to create a family of G protein-coupled receptors potently activated by an inert ligand. Proceedings of the National Academy of Sciences of the United States of America 104, 5163-5168 (2007).
3. Lee, J., et al. Global and local fMRI signals driven by neurons defined optogenetically by type and wiring. Nature 465, 788-792 (2010).
4. King, J.A., et al. Procedure for minimizing stress for fMRI studies in conscious rats. J Neurosci Methods 148, 154-160 (2005).
5. Chang, P.C., et al. Novel method for functional brain imaging in awake minimally restrained rats. J Neurophysiol 116, 61-80 (2016).
6. Ferenczi, E.A., et al. Prefrontal cortical regulation of brainwide circuit dynamics and reward-related behavior. Science 351, aac9698 (2016).
7. Desai, M., et al. Mapping brain networks in awake mice using combined optical neural control and fMRI. J Neurophysiol 105, 1393-1405 (2011).
8. Ikemoto, S. Brain reward circuitry beyond the mesolimbic dopamine system: a neurobiological theory. Neurosci Biobehav Rev 35, 129-150 (2010).
9. Dombeck, D.A., Khabbaz, A.N., Collman, F., Adelman, T.L. & Tank, D.W. Imaging large-scale neural activity with cellular resolution in awake, mobile mice. Neuron 56, 43-57 (2007).
10. Guo, Z.V., et al. Procedures for behavioral experiments in head-fixed mice. PLoS One 9, e88678 (2014).
Figures