1199
A multi-center study on fast full-brain quantitative multi-parameter mapping of R1, MT, and R2*: scan-rescan repeatability and inter-site reproducibility1Spinal Cord Injury Center Balgrist, University of Zurich, Zurich, Switzerland, 2Max Planck Institute for Human Cognitive and Brain Science, Leipzig, Germany, 3Queen Square MS Centre, UCL Institute of Neurology, Faculty of Brain Sciences, University College London, London, United Kingdom, 4Department of Brain and Behavioural Sciences, University of Pavia, Pavia, Italy, 5Brain MRI 3T Centre, C. Mondino National Neurological Institute, Pavia, Italy, 6Department of Brain Repair and Rehabilitation, UCL Institute of Neurology, London, United Kingdom
Synopsis
We present a multi-center, multi-vendor study evaluating repeatability and reproducibility of quantitative MRI data acquired using high resolution (1 mm³) multi-parameter mapping which provides quantitative R1, MT and R2* maps of the whole brain within less than 18 min. The protocol was implemented at four clinical sites with different Siemens and Philips 3T MRI scanners. Scan-rescan measurements of the same five healthy volunteers at all sites showed good intra-site reproducibility in all parameter maps. However, the inter-site comparisons showed higher reproducibility within a single vendor than across vendors.
Background
Quantitative MRI (qMRI) aims to provide imaging biomarkers that are insensitive to differences in MR soft- and hardware1. Now studies are increasingly conducted at multiple sites to raise the number and diversity of the participants and investigate rare diseases using MRI technology2. However, standardized MRI methods that produce stable results across different scanners in longitudinal studies are still needed3. The multi-parameter mapping (MPM) approach4,5 provides high resolution maps sensitive to myelination (MT and R1) and iron content (R2*) in the brain and has been already applied in a wide range of studies to investigate microstructural tissue properties in WM and GM and its potential for providing biomarkers 2,6,7. Our previous multi-center study with the MPM approach, using the same MRI scanner (Siemens Trio-VB17), showed reproducibility of the quantitative maps for multi-center imaging studies2. Therefore, MPM will be applied in an European multi-center clinical trial (NISCI) on investigating a drug effect based on the Anti Nogo-A antibody8 (the treatment facilitates neuro-generation at the anatomical level in spinal cord injury) and implemented with the vendor’s product MRI sequences. For a validation at each site involved in the NISCI trial, we aimed to investigate scan-rescan repeatability and inter-site reproducibility of the MPM with changing scanner conditions (different vendors) and repositioning subjects for scan-rescan repeatability.Materials and Methods
The same 5 healthy controls (2 females, age=32.4±6.0 years) were scanned twice (scan-rescan) with about 1 hour break in between on four different scanners at four centers in Switzerland, Germany, Italy, and Spain (Table 1a). The study received ethics approval at each center. The MPM comprised three multi-echo 3D FLASH scans designed to provide MR parameter measures of longitudinal relaxation rate (R1=1/T1), magnetization transfer saturation (MT), and effective transverse relaxation rate (R2*=1/T2*)4,5 with the parameters listed in Table 1b. The post-processing was done by using the hMRI toolbox (www.hmri.info), implementing voxel-based quantification (VBQ)9 to create maps of MT, R1 (using UNICORT5) and R2* (using ESTATICS10). Mean MT, R1 and R2* within WM and GM were derived from the corresponding maps. Scan-rescan repeatability was assessed by determining the absolute value of the difference between scan and rescan values per subject, divided by the mean of both measurements. Coefficient of variance (CoV) within and between sites was calculated to determine intra- and inter-site reproducibility2 for each parameter.Results
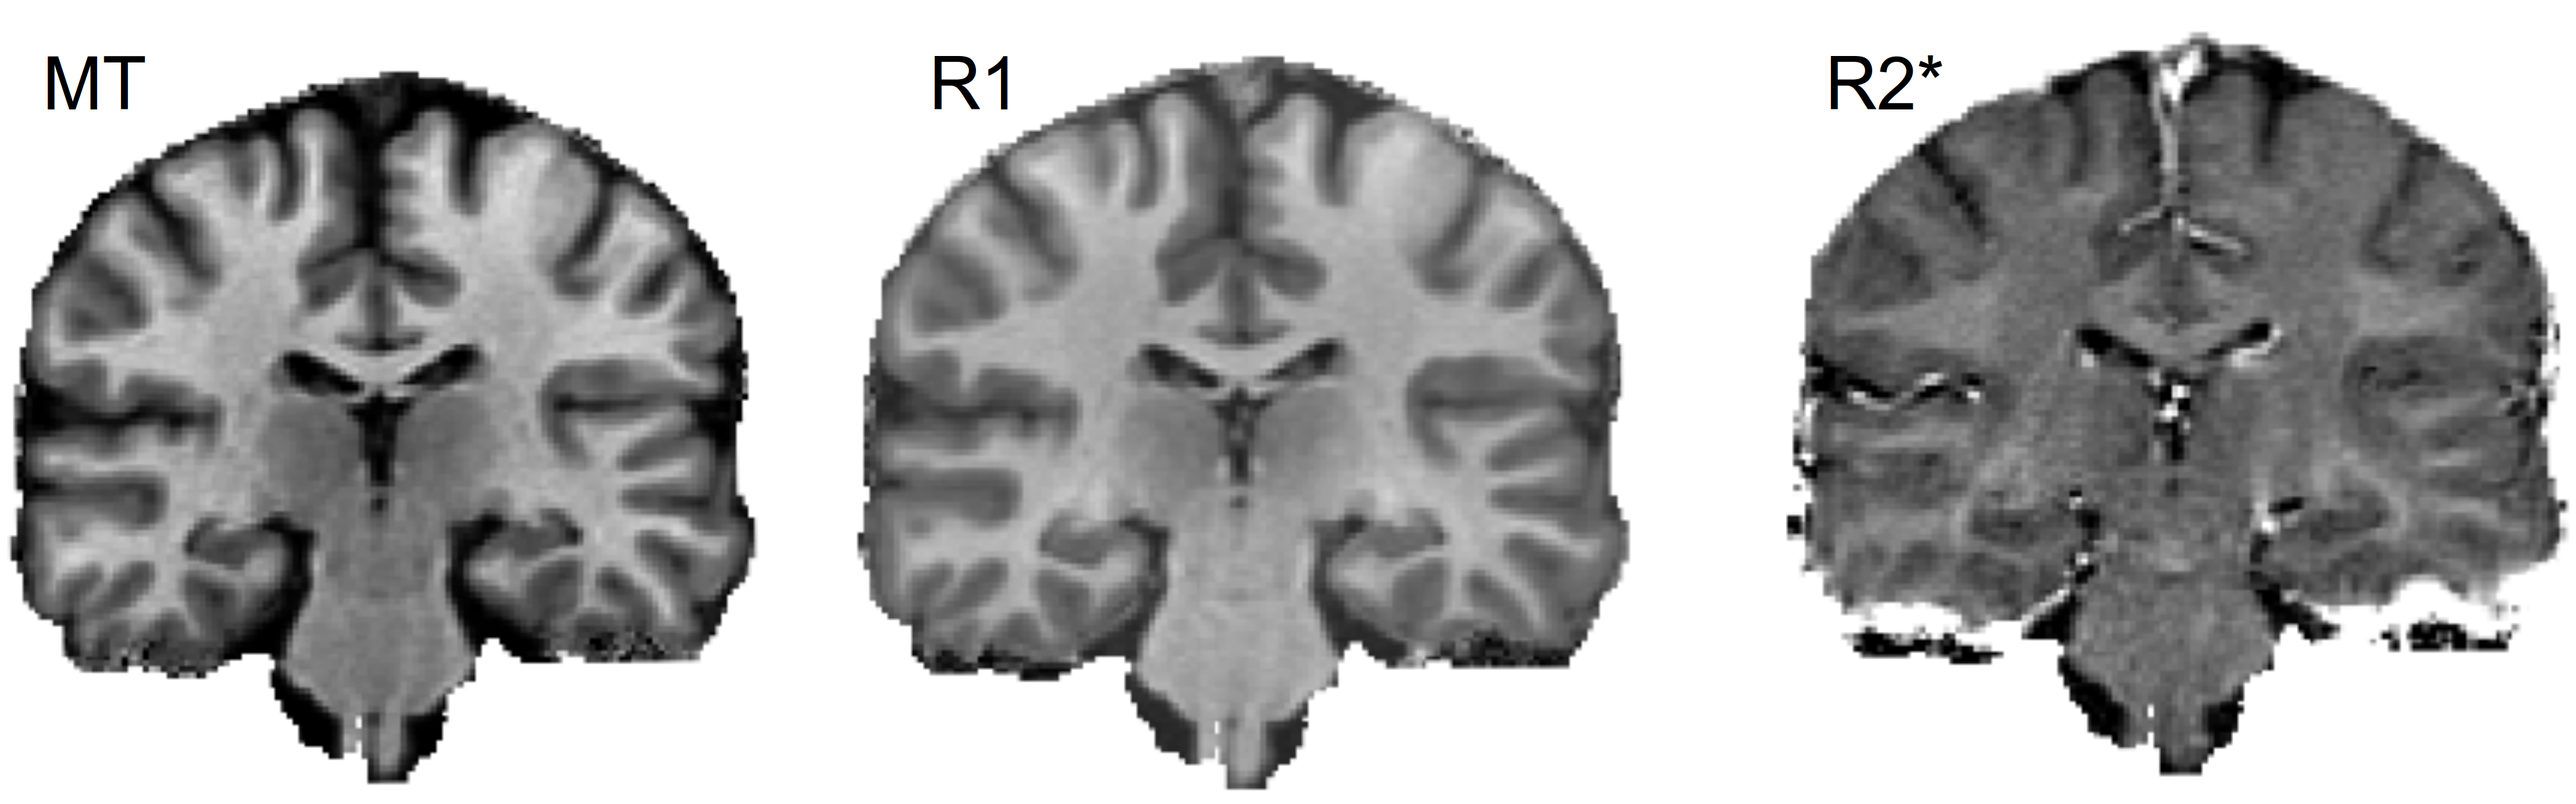
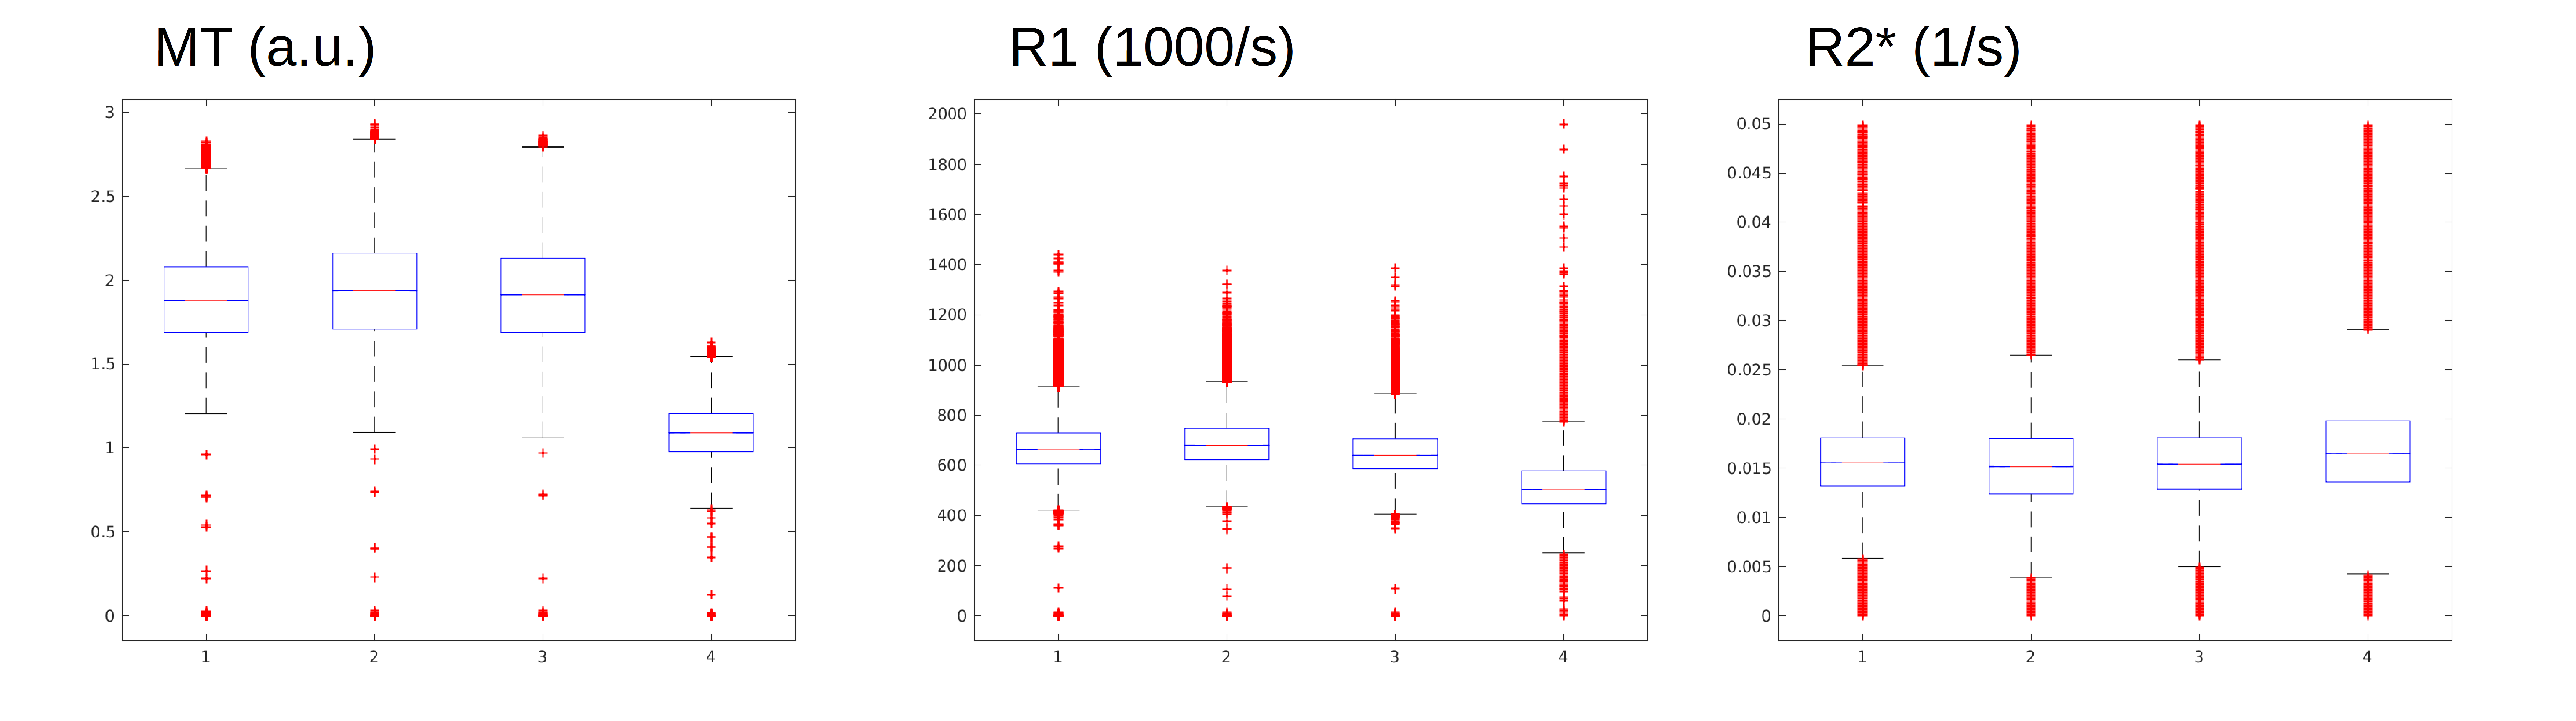
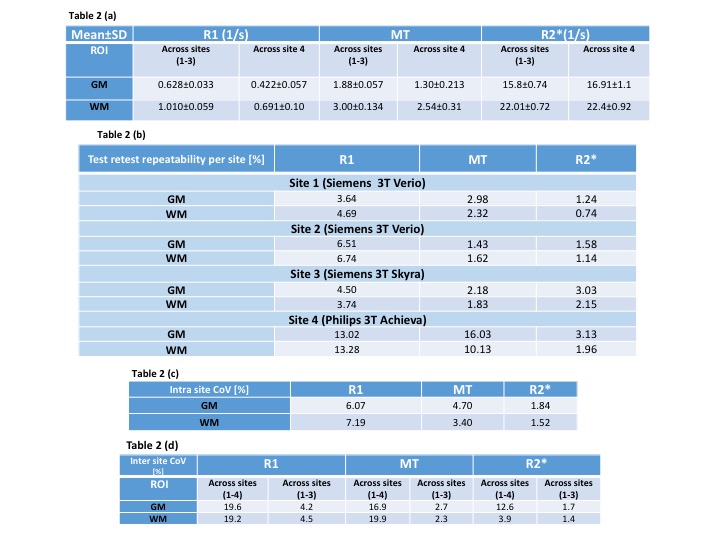
The MPM protocol provided high quality parameter maps (Fig. 1). The mean R1, R2* and MT in GM and WM across sites and subjects are presented in Table 2a. The results of scan-rescan repeatability per site, inter- and intra-site CoV for MT, R1 & R2* are shown in Tables 2b,c,d. The scan-rescan repeatability was higher on Siemens scanners than those calculated on the Philips scanner – especially for MT and R1 maps (Fig. 2). The intra-site CoVs were less than 2% for R2* and less than 5% for MT. However, the intra-site comparison showed a higher variation (<8%) for R1 in both GM and WM. The inter-site CoVs were less than 5% for all parameters across sites with Siemens scanners. However, inter-site CoVs of parameters determined across all sites including Philips scanner showed higher CoVs (<20%).Discussion and Conclusion
This multi-center multi-vendor validation showed a high scan-rescan repeatability and intra-site reproducibility of the MPM approach based on product sequences compared to conventional T1w method2. The high scan-rescan repeatability promises high sensitivity in longitudinal studies. While the mean R1 and R2* values were in agreement with previous reports2, the mean MT was slightly higher, which is in line with applying more highly powered MT saturation pulses than in the previous report2. Moreover, the Philips scanner has different MT saturation pulse settings compared to Siemens, leading to systematic differences in MT values between the vendors. The observed higher CoVs within subjects for R1 in both WM and GM may be due to higher sensitivity of R1 to the transmit radio-frequency (RF) amplitude. Despite using different Siemens scanners with different software versions as well as different RF coils across sites, we obtained high scan-rescan repeatability and intra-site reproducibility of MPM parameters. However, we observed deviations from the Philips scanner results that need to be taken into account when pooling data across sites. In conclusion, our results show that MPM provides high resolution maps in a short acquisition time, promising MR biomarkers with high reproducibility and sensitivity to tissue microstructure needed for multi-center trials.Acknowledgements
We thank all collaborators at the clinical sites, for their help and contribution to perform the current study. This project has received funding from the European Union's Horizon 2020 research and innovation program under the grant agreement No 681094, and is supported by the Swiss State Secretariat for Education, Research and Innovation (SERI) under contract number 15.0137. Moreover, authors receive funds from International Spinal Research Trust, Wings for Life and Craig H. Neilsen Foundation (INSPIRED), UK MS Society (Award ref 77), NIHR Biomedical Research Centres (BRC R&D03/10/RAG0449), European Research Council (ERC grant agreement n° 616905), BMBF (01EW1711A & B) in the framework of ERA-NET NEURON, BRAINTRAIN funded by the European Commission (Grant agreement n° 602186).References
1. Duval, T., Smith, V., Stikov, N., Klawiter, E. C. & Cohen-Adad, J. Scan-rescan of axcaliber, macromolecular tissue volume, and g-ratio in the spinal cord. Magnetic Resonance in Medicine (2017). doi:10.1002/mrm.26945
2. Weiskopf, N. et al. Quantitative multi-parameter mapping of R1, PD(*), MT, and R2(*) at 3T: a multi-center validation. Front. Neurosci. 7, 95 (2013).
3. Jack, C. R. et al. The Alzheimer’s Disease Neuroimaging Initiative (ADNI): MRI methods. Journal of Magnetic Resonance Imaging 27, 685–691 (2008).
4. Helms, G., Dathe, H. & Dechent, P. Quantitative FLASH MRI at 3T using a rational approximation of the Ernst equation. Magn. Reson. Med. 59, 667–672 (2008).
5. Weiskopf, N. et al. Unified segmentation based correction of R1 brain maps for RF transmit field inhomogeneities (UNICORT). Neuroimage 54, 2116–2124 (2011).
6. Callaghan, M. F. et al. Widespread age-related differences in the human brain microstructure revealed by quantitative magnetic resonance imaging. Neurobiol. Aging 35, 1862–72 (2014).
7. Freund, P. et al. MRI investigation of the sensorimotor cortex and the corticospinal tract after acute spinal cord injury: a prospective longitudinal study. Lancet Neurol. 12, 873–881 (2013).
8. Schwab, M. E. & Strittmatter, S. M. Nogo limits neural plasticity and recovery from injury. Curr. Opin. Neurobiol. 27, 53–60 (2014).
9. Draganski, B. et al. Regional specificity of MRI contrast parameter changes in normal ageing revealed by voxel-based quantification (VBQ). Neuroimage 55, 1423–34 (2011).
10. Weiskopf, N., Callaghan, M. F., Josephs, O., Lutti, A. & Mohammadi, S. Estimating the apparent transverse relaxation time (R2*) from images with different contrasts (ESTATICS) reduces motion artifacts. Front. Neurosci. 8, 1–10 (2014).
Figures