1190
Focus Correction in MR Thermometry for Precise Targeting in Focused Ultrasound Thalamotomy for Essential Tremor: Statistical Study from 121 Sonications in 7 Patients1Physics, Soochow University, Taipei, Taiwan, 2Biomedical Engineering, Shanghai Jiao Tong University, Shanghai, China, 3Radiology, Brigham and Women's Hospital, Harvard Medical School, Boston, MA, United States
Synopsis
Focused ultrasound thalamotomy was approved by FDA for the treatment of essential tremor under MRI guidance. However, spatial errors in the location of focal spots are often observed and could jeopardize the patient safety if not taken into account. We previously explained the causes of this error and proposed a correction method. Using the method, data associated with 121 sonications from 7 patients were statistically analyzed in the present study. Results show the focus was shifted by 0.05 mm/°C. The size of shift for treating sonication agrees with the value reported in literature.
Introduction:
Focused ultrasound (FUS) thalamotomy is an effective alternative to surgical resection for essential tremor (ET)1. Performed under MRI guidance, at 3T, it received FDA approval in July 2016. However, spatial discrepancy in the frequency encoding direction between the target coordinate and the hotspot as seen in MR thermography often occurs2, a potential source of safety concerns. In prior work3, a k-space signal model has been proposed to account for the heating-induced phase shift. Alternately, a different method4 used a TE-error map along with chemical-shift correction to restore the focus location. Both methods found spatial offsets of about 1mm, in agreement with actual offsets as observed in clinical treatments2. The present work tested the latter method in a cohort of 7 patients associated with a total of 121 separate sonications.Theory:
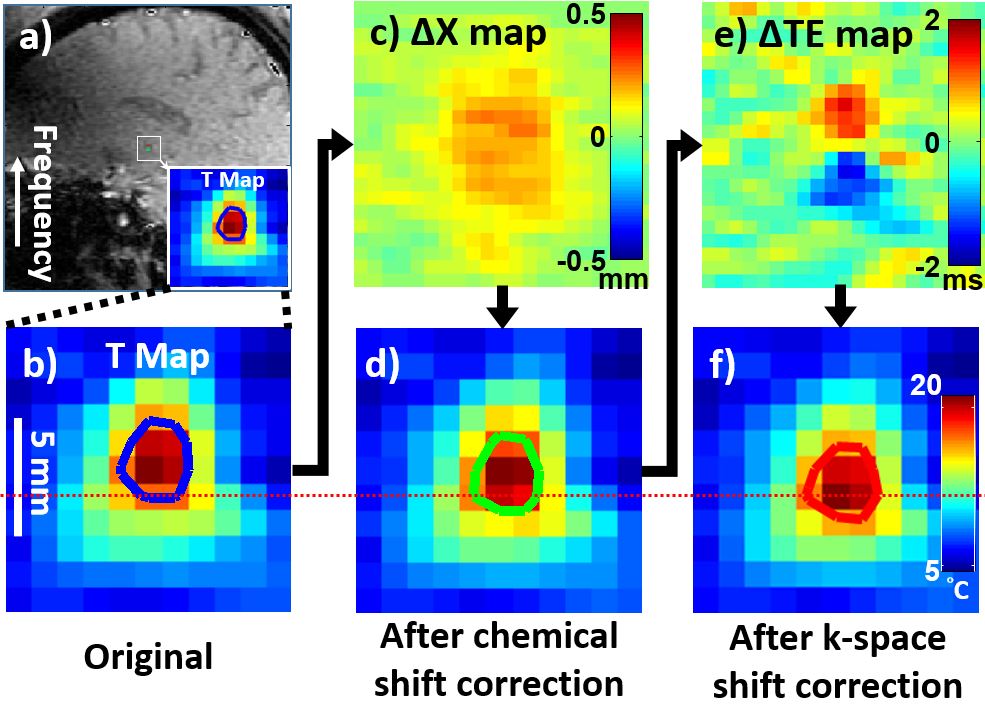
There are two main causes leading to focus offsets as detected here. One of them, chemical shifts, is well known and recognized. The other is less recognized, and is referred to here as k-space shift artifacts. These are caused by magnetic field gradients and resulting k-space shifts, causing temperature-measurement errors5. The diagram in Fig. 1 illustrates the steps involved in correcting these problems. The temperature map around the focus (Fig. 1a,b) is first corrected pixel-to-pixel using a spatial-shift map (Fig. 1c), based on the heating-induced chemical shift. The resulting map (Fig. 1d) is then corrected using a TE-error map (Fig. 1e), based on the pixel-by-pixel shifts in k-space. Because the TE error on either side of the focus has opposite polarity (shown as red and blue in Fig. 1e), the temperature on one side of the focus is elevated while temperature on the other side is suppressed, effectively shifting the apparent location of the focus (Fig. 1f). The resulting ~1mm shift can be visualized comparing Fig. 1b and 1f (see red dotted line).Methods:
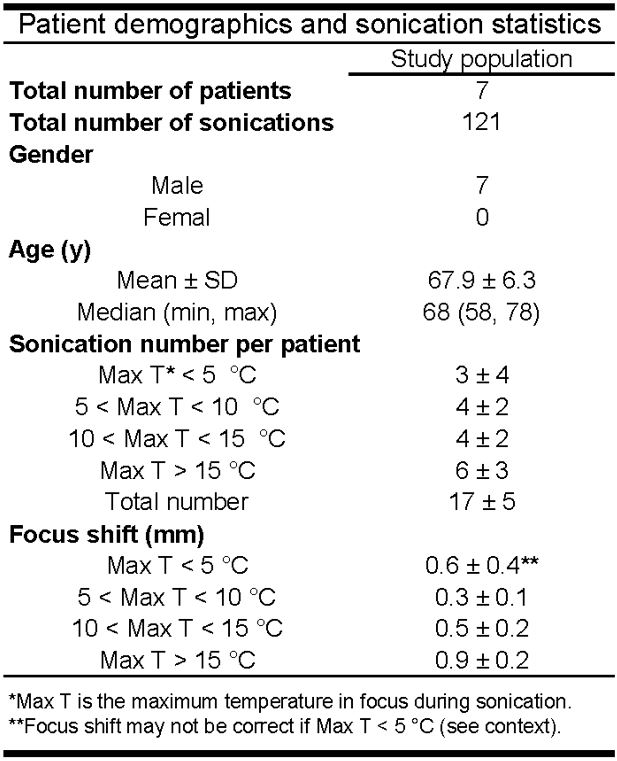
7 ET patients were treated following informed consent, using a hemispheric, 650-kHz, 1024-element, phased-array transducer (ExAblate Neuro 4000, InSightec, Israel) under guidance of a 3T MRI system (GE, Milwaukee, WI). The SPGR sequence was used for temperature monitoring (FOV = 28×28cm2, TE/TR = 12.9/27.8ms, matrix size = 128×256 zero-filled to 256×256, BW = ±5.68kHz). A total of 121 sonications were delivered, over all 7 patients. The patient demographics and sonication statistics are listed in Table 1. Some sonications were excluded because: only minimum heat was produced (<5°C), or cavitation was detected, or the surgeon stopped the sonication out of safety concerns, or the patient himself did so. 22 sonications in total were excluded here, leaving 99 sonications in the present study for further analysis. The size of the focus shift was calculated for all 99 sonications, analyzed statistically, and 2D focus profiles before and after correction were compared using Bland-Altman plots.Results:
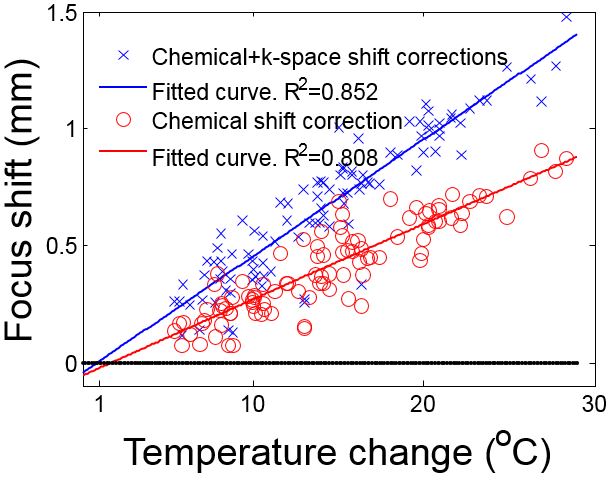
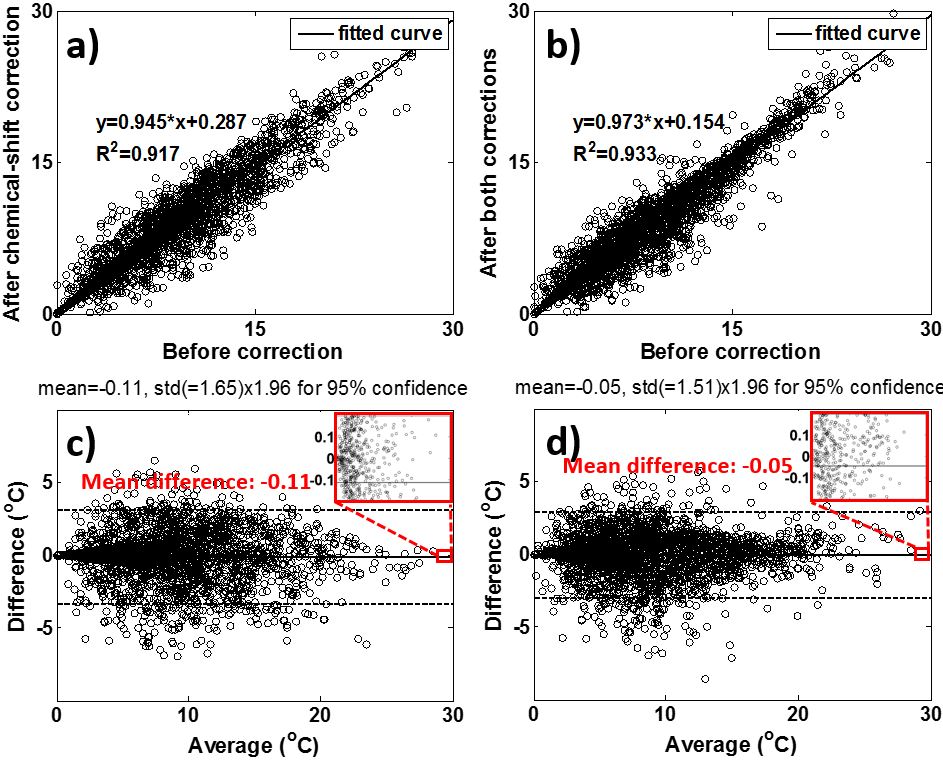
A close linear correlation (R2=0.852) was found between temperature elevation and focus shift (blue line in Fig. 2). The maximum spatial error was 1.5mm and occurred at 28.4°C. From the fitted slope, an error of about 0.5mm in focus location is expected for every 10°C of temperature elevation. As shown with red circles and line in Fig. 2, the chemical shift artifact could account for only about half of the observed shift, and effects from less-recognized k-space shifts must be included to account for the full observed error in focus location. A 5×5 ROI surrounding the focus, before and after the correction, was compared with scatterplots (Fig. 3a,b) and Bland-Altman plots (Fig. 3c,d). Looking at the Bland-Altman plots in Fig. 3c and 3d, including the k-space shift correction, as opposed to using only a chemical-shift correction, helped reduce the mean error from -0.11°C down to -0.05°C over the ROIs.Discussion and Conclusion:
99 sonications in FUS thalamotomy from 7 ET patients were corrected for spatial errors in the location of the hotspots as visualized with MRI. Temperature elevations correlated well with focus shifts; more specifically, a 0.5mm shift was observed for about every 10°C elevation. Effects associated with k-space shifts accounted for about half of the error in focus location, the other half being caused by better-recognized chemical shift effects. As such, effects from magnetic field gradients and associated k-space shifts should be taken into account when correcting for focus location, to ensure that temperature hotspots as visualized with MRI match as closely as possible in location with lesions in the thalamus.Acknowledgements
Funding sources from NIH P01CA174645 and MOST 106-2221-E-031-003.
References
1. Elias WJ, et al., A randomized trial of focused ultrasound thalamotomy for essential tremor. NEJM 2016;375(8):730-9.
2. Lipman N, et al., MR-guided focused ultrasound thalamotomy for essential tremor: a proof-of-concept study. Lancet Neurol. 2013;12(5):462-8.
3. Gaur P, et al., Correcting heat-induced chemical shift distortions in proton resonance frequency-shift thermometry. MRM 2016;76:172-82.
4. Mei CS, et al., Focus correction in MR thermography for precise targeting in focused ultrasound thalamotomy for essential tremor. ISMRM 2017, 3216, Honolulu, HI.
5. Mei CS, et al., Accurate field mapping in the presence of B0 inhomogeneities, applied to MR thermometry. MRM 2015;73(6):2142-51.
Figures