1188
Noninvasive neuromodulation induced by focused ultrasound combined with fMRI in the non-human primate brainTingting He#1, Chih-Hung Tsai#2, Ssu-Ju Li3, Xianfeng Feng1, Kaiyue Wang1, Chao-Ting Wang1,2, Xiao Yu1, Wei Xiong1, You-Yin Chen3, Hao-Li Liu*1,2, and Hsin-Yi Lai*1
1Interdisciplinary Institute of Neuroscience and Technology, Qiushi Academy for Advanced Studies, Zhejiang University, Hangzhou City, China, 2School of Medicine, Department of Electrical Engineering, Chang Gung University, Taoyuan County, Taiwan, 3Department of Biomedical Engineering, National Yang-Ming University, Taipei City, Taiwan
Synopsis
Currently, the field of neuromodulation using focused ultrasound is growing due to its potential clinical applications. Using the lab-designed MRI-compatible FUS transducer and 7T research MRI system with the customer-made transmit/receive surface coil, the current study demonstrated that focused ultrasound (FUS) can induce BOLD responses in visual cortex in non-human primate. The effect of FUS could sostenuto influence the neuron activity in the visual cortex to enhance BOLD responses evoked by visual stimulus. FUS combined with fMRI has potential to explore the mechanism of neuromodulation in NHP induced by focused ultrasound.
Introduction
A non-invasive and imaging-targeted method for the controlled modulation of region-specific brain activity would provide a new opportunity in creating a wide range of applications in investigating brain functional mapping. Two non-invasive approaches, transcranial magnetic stimulation (TMS) 1 and transcranial direct current stimulation (tDCS) 2 have been widely used in modulating the brain modulation. However, DBS is an invasive technique, both tDCS and TMS have the lack of high spatial acuity, and TMS is inability to deliver to deep brain. With its superior spatial selectivity and its feasibility, transcranial FUS is gaining momentum as a new mode of non-invasive brain stimulation. Evidence from animal studies showed that focused ultrasound (FUS) can elicit electrophysiological responses by stimulating the specific brain regions3-6 and can functionally modulate the behavioral responses (e.g., saccadic movement) by stimulating the frontal eye field in non-human primates.7 More recently, elicitation of tactile sensations and associated evoked EEG potentials was observed during the FUS stimulation of the SI.8 Ultra-high field functional Magnetic Resonance Imaging (fMRI) provides a powerful tool for the exploration of neural circuitry on a whole brain scale, in vivo, including the vision modulatory effects of FUS.9 The combination of fMRI with FUS stimulation allows for relatively unbiased mapping of large-scale responses to FUS. In the present study, we used a lab-designed MRI-compatible FUS transducer to produce the neuromodulation in non-human primate (NHP) and online guided simultaneously by the ultra-high field MRI with the customer-made transmit/receive surface coil.Methods
Each macaque (n=3) was placed in a MR-compatible stereotaxic instrument under anesthesia with 0.1 mg/kg*h ketamine intravenously and 0.3–0.7% isoflurane. The lab-designed MRI-compatible FUS transducer (Fig.1(A)) was mounted on the macaques head, and the customer-made transmit/receive surface coil was placed cover the target where the FUS exposure, as shown in Fig. 1(B). Anatomical T2-weighted images were acquire by a turbo spin echo (TSE) sequence (TR=10340 ms, TE=67 ms, BW=100 Hz, Voxel size: 0.5×0.5×2.0 mm3) and BOLD fMRI were acquire by a prototype multiband EPI sequence (TR=2000 ms, TE=24.2 ms, BW=1710 Hz, F Voxel size: 1.5×1.5×1.5 mm3) using 7T research system (Siemens Erlangen, Germany). The visual binocularly block stimulus were performed before and after FUS by a Visual Stimulation System (SINORAD, China). The visual stimulus paradigm was 18 s initial rest and six block-design with ON–OFF, where ON=18 s and OFF=18 s. Three repeated trials were performed to improve measurement accuracy and optimize SNR. The mechanical index (MI) of 0.55 FUS was transmitted to macaque’s visual cortex (AP:-15 mm; ML:-15 mm, shown in Fig. 1(B)) by the lab-designed MRI-compatible FUS transducer at the fundamental frequency of 298 kHz with 1-ms duration for 20-s total time. BOLD signals were analyzed by the seed-based correlation analysis with a 2x2 pixel region of interest (ROI) in the visual cortex using AFNI.Results and Discussion
Fig. 2 (A) showed that the right visual cortex was activated by FUS stimulation. BOLD responses evoked by FUS stimulation were produced up to 4% signal change, as shown in Fig. 2 (B). As Compared with pre-FUS, correlation maps evoked by the block-designed visual stimulus were significantly stronger in bilateral visual cortex after FUS (Fig. 3A). Fig. 3(B) showed the BOLD responses evoked by the visual stimulus were significantly higher in both left and right visual cortex at post-FUS than those at pre-FUS. These results indicated that the FUS can activate the neuron in one site visual cortex but induce increase responses in the bilateral visual cortex. Based on the cross dominance of visual cortex to vision 10, FUS stimulation given to right visual cortex induced the neuron activities in right area, which was similar to other’s research 9, and then the right visual cortex excited the bilateral visual behavior lead to neuron activities in both left and right visual cortex evoked by visual stimulation. As a new temporarily and non-invasively modulatory technology, FUS has been used extensively 8, 11, however, there's no unifying theory for the mechanisms of FUS-induced neuromodulation.Conclusion
The current study demonstrated that significant changes of BOLD signals induced by FUS in the non-human primate visual cortex. In addition, the BOLD responses in the visual cortex can be enhanced after FUS stimulation. Ultra-high field MRI can achieve real time online guiding and monitoring the FUS neuromodulation. The further investigation of this study will help us to understand the mechanism of FUS neuromodulation and expose the thalamocortical functional connectivity.Acknowledgements
This work was supported by grants from the Fundamental Research Funds for the Central Universities (2016QN81017) and the National Natural Science Foundation of China (81527901, 61673346, 81527901)References
1. Korchounov, Alexei, and Ulf Ziemann. Neuromodulatory neurotransmitters influence LTP-like plasticity in human cortex: a pharmaco-TMS study. Neuropsychopharmacology 2011; 36(9): 1894-1902. 2. Fregni, Felipe, and Alvaro Pascual-Leone. Technology insight: noninvasive brain stimulation in neurology—perspectives on the therapeutic potential of rTMS and tDCS. Nature clinical practice Neurology 2007; 3(7): 383-393. 3. Yoo, S.-S. et al. Focused ultrasound modulates region-specific brain activity. Neuroimage 2011; 56(3): 1267–1275. 4. Kim, H., Lee, S. D., Chiu, A., Yoo, S.-S. & Park, S. Estimation of the spatial profile of neuromodulation and the temporal latency in motor responses induced by focused ultrasound brain stimulation. Neuroreport 2014; 25(7): 475–479. 5. Kim, H. et al. PET/CT imaging evidence of FUS-mediated (18) F-FDG uptake changes in rat brain. Med Phys 2013; 40(3): 033501. 6. Lee, W. et al. Image-guided focused ultrasound-mediated regional brain stimulation in sheep. Ultrasound Med Biol 2016; 42(2): 459–470. 7. Deffieux, T. et al. Low-intensity focused ultrasound modulates monkey visuomotor behavior". Curr Biol 2013; 23(23): 2430–2433. 8. Lee, W. et al. Image-guided transcranial focused ultrasound stimulates human primary somatosensory cortex. Scientific Reports 2015; 5: 8743. 9. Lee, Wonhye, et al. Transcranial focused ultrasound stimulation of human primary visual cortex. Scientific reports 2016; 6: 34026. 10. Hubel, David H., and Torsten N. Wiesel. Ferrier lecture: Functional architecture of macaque monkey visual cortex. Proceedings of the Royal Society of London B: Biological Sciences 1977; 198(1130): 1-59. 11. Gavrilov, L. R., E. M. Tsirulnikov, and I. ab I. Davies. Application of focused ultrasound for the stimulation of neural structures. Ultrasound in medicine & biology 1996; 22(2): 179-192.Figures
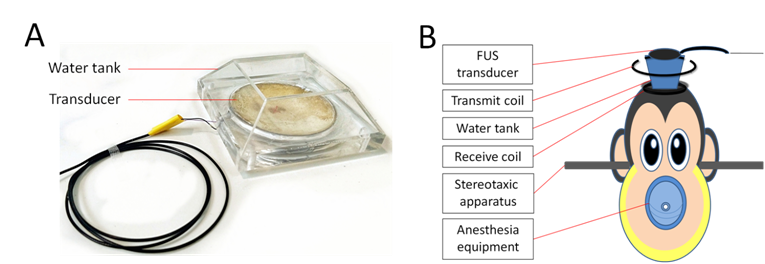
Fig. 1 (A) Lab-designed MRI-compatible transducer. Fig.1
(B) The experimental setup of FUS.
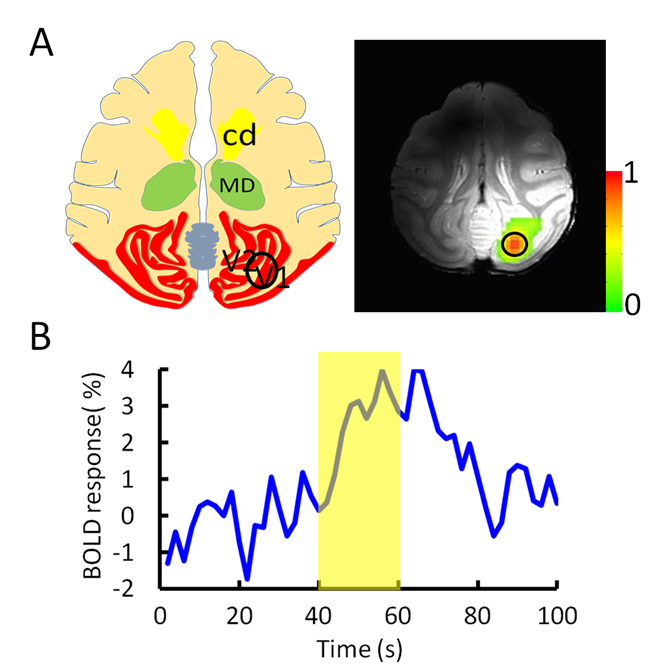
Fig. 2 (A) Visual cortex in macaque brain atlas and BOLD
activation maps of FUS
stimulation. Black circle indicates approximate
ROIs (7 voxels). (B) BOLD time courses to FUS stimulation. Yellow-shaded area indicates stimulus epoch.
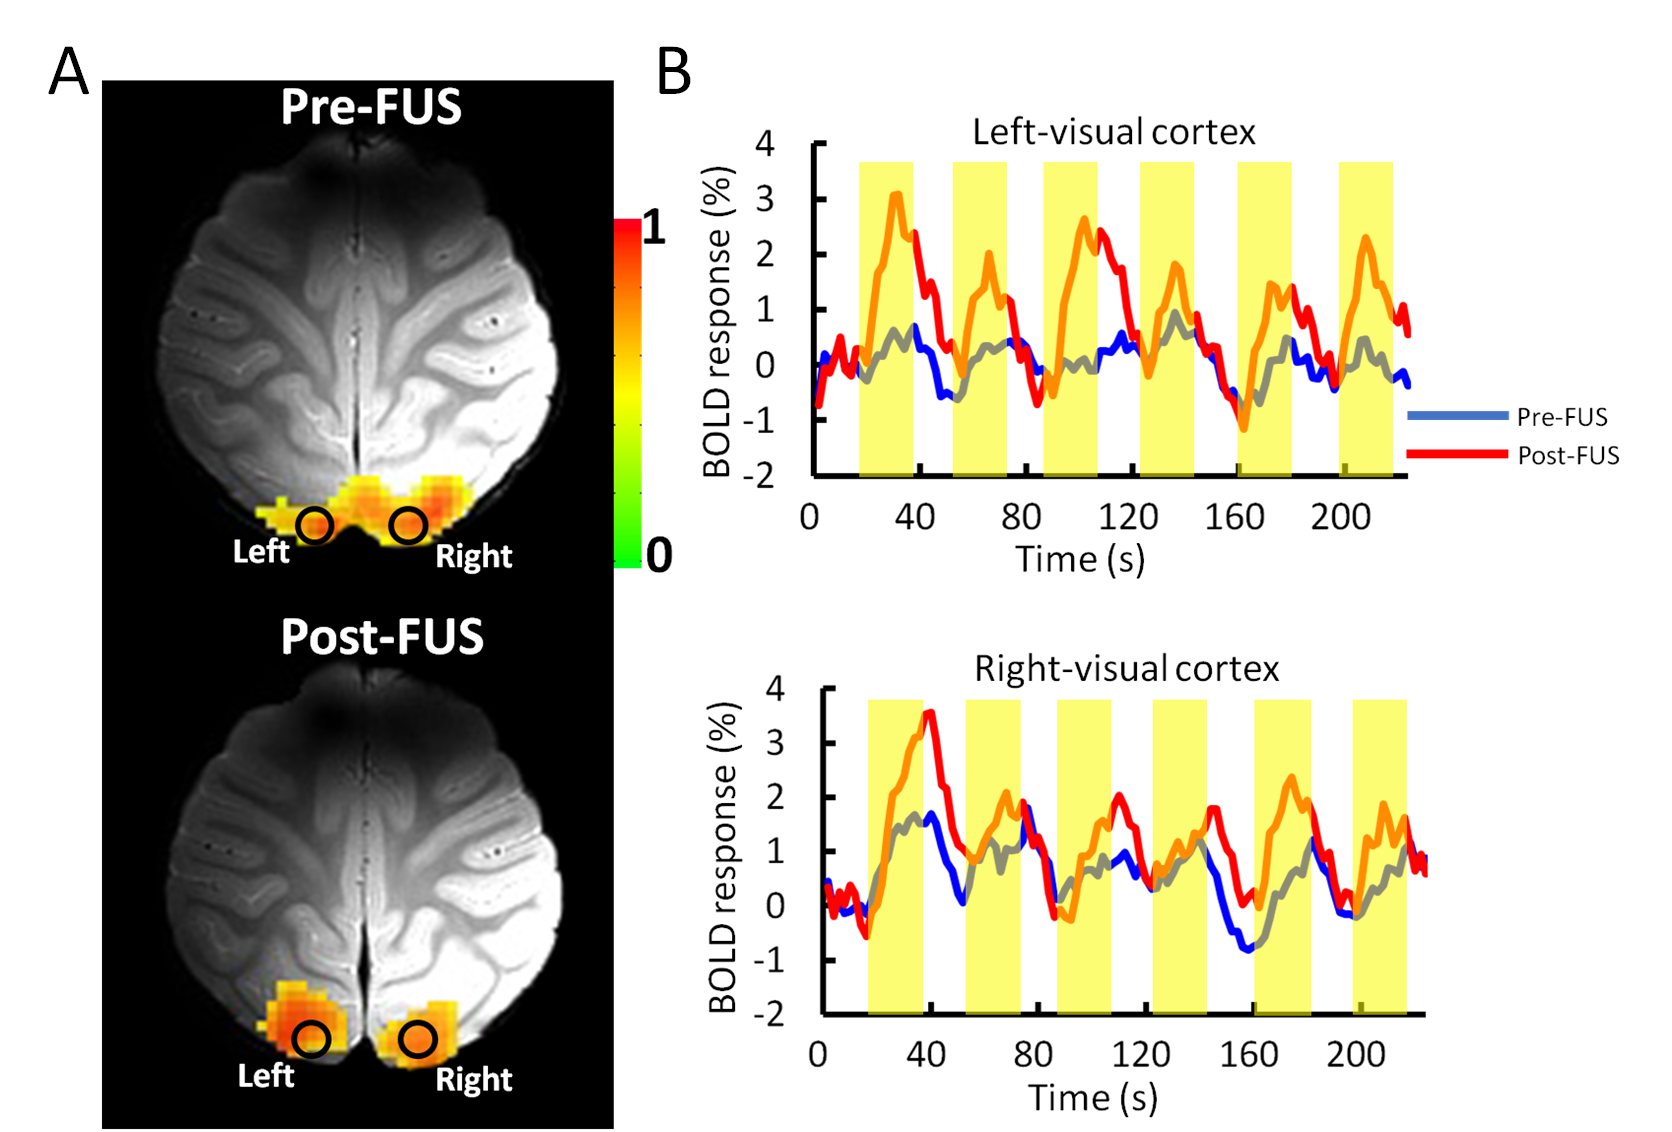
Fig.
3 (A) BOLD activation maps indueced by visual stimulus pre- and post- FUS
stimulation BOLD signals of bilateral visual cortex with visual stimulation
brfore and after FUS. (B) BOLD
time courses to six ON-OFF blocks of visual stimulus in left- and right-visual
cortex. Blue and red lines indicate the pre-FUS and post-FUS, respectively.
Yellow-shaded area indicates stimulus epoch.