1186
Placental Metabolic Rate of Oxygen1Department of Radiology, University of Pennsylvania, Philadelphia, PA, United States, 2Department of Bioengineering, University of Pennsylvania, Philadelphia, PA, United States, 3Department of Obstetrics and Gynecology, Division of Maternal-Fetal Medicine, University of Pennsylvania, Philadelphia, PA, United States
Synopsis
Placental dysfunction is widely accepted as a major cause of common adverse pregnancy outcomes. However, current clinically available tools are limited in their ability to assess placental function. Here, we have incorporated quantitative MRI methods to estimate placental metabolic rate of O2 (PMRO2), which may contribute to the understanding of placental dysfunction. Presented results demonstrate the feasibility of estimating PMRO2 in vivo. Further, these data suggest, in a limited number of participants, that PRMO2 may in fact contribute to the understanding of pregnancy complications.
INTRODUCTION
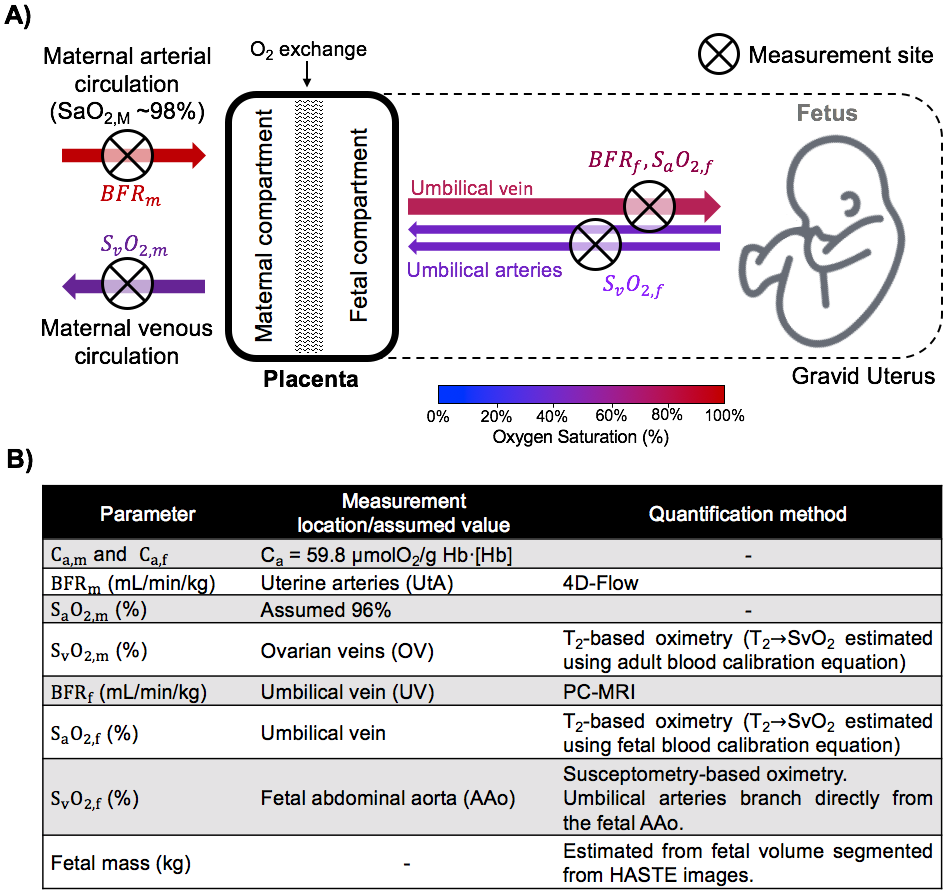
Placental dysfunction is widely accepted as a major cause of common adverse pregnancy outcomes. The development of non-invasive methods for the evaluation of placental oxygen metabolism would provide new insights into the etiology of placental dysfunction and possibly allow intervention at an early stage of gestation. Here, we incorporated quantitative MRI methods including the non-invasive measurement of oxygen saturation and circulation flow rate (BFR) to test the feasibility of estimating placental metabolic rate of oxygen (PMRO2) in vivo. The overall idea is to quantify the MRO2 of the gravid uterus and fetus (uMRO2 and fMRO2, resp.) obtained from the circulation BFR and arteriovenous difference in O2 saturation, and subsequently isolate PMRO2 by subtracting the contribution of fMRO2 to uMRO2 (Figure 1A).METHODS
Five pregnant women (gestational age, GA=33±4wks) were scanned in a 1.5T (Siemens Avanto, Erlangen, Germany) scanner with two flexible body coils. MRO2 can be estimated from Fick’s principle:
MRO2=Ca·BFR·(SaO2-SvO2) $$$\space\space\space\space\space\space\space\space\space\space$$$ [1]
Here, Ca is the blood O2 carrying capacity in units of µmol O2/dL blood (Ca = 59.8 µmol O2/g Hb·[Hb], where [Hb] is the blood hemoglobin concentration in g/dL blood), BFR in mL min-1/kg of fetal mass (massf) and SaO2-SvO2 is the arterio-venous difference in oxygen saturation. PMRO2 can then be calculated by subtracting the contribution of fMRO2 to uMRO2:
PMRO2=uMRO2 - fMRO2
$$$\space\space\space\space\space\space\space\space\space\space\space$$$ =[Ca,m·BFRm·(SaO2,m-SvO2,m)]-[Ca,f·BFRf·(SaO2,m-SvO2,m)] $$$\space\space\space\space\space\space\space\space\space\space$$$ [2]
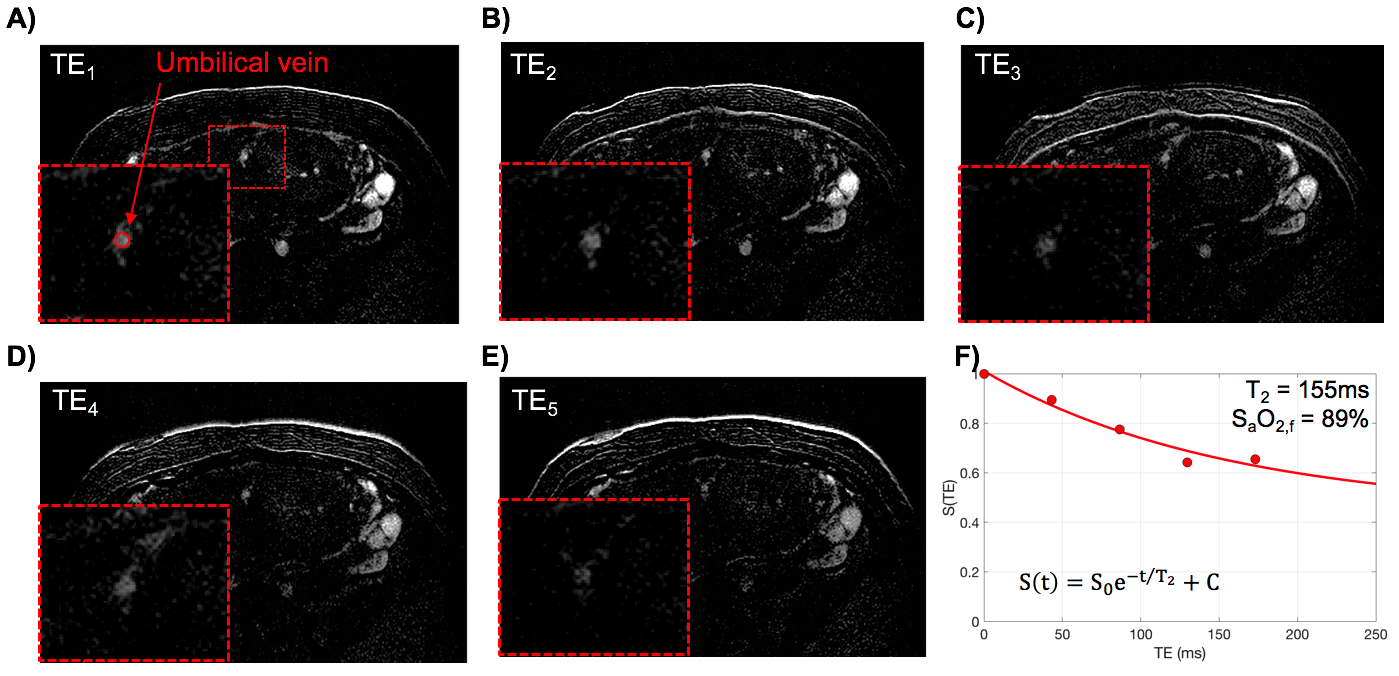
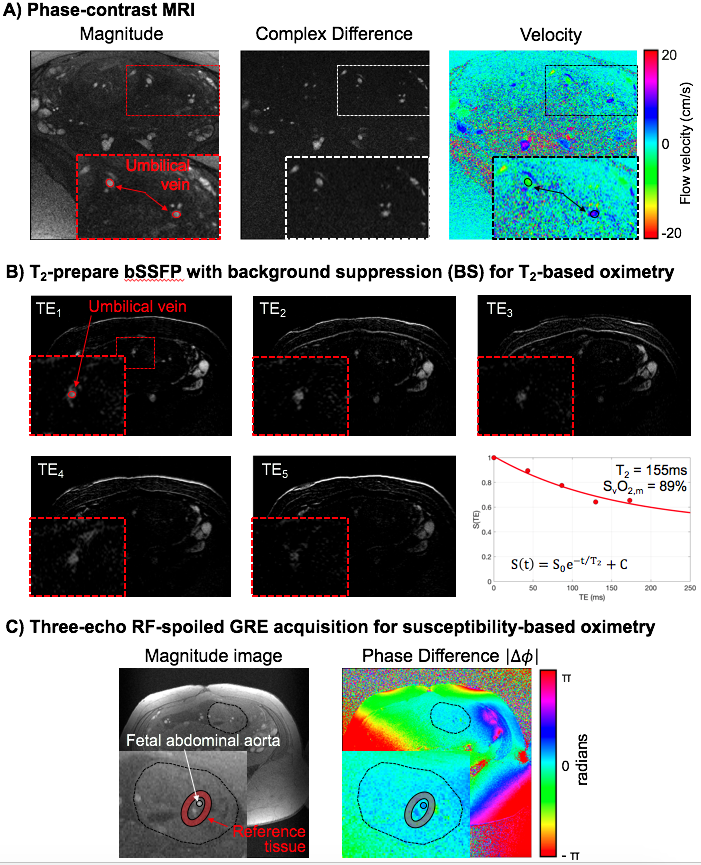
where the subscripts m and f indicate parameters measured in the maternal and fetal circulations, respectively. Location of measurements and techniques used are summarized in Figure 1B. Maternal hemoglobin (Hb) and hematocrit (Hct) values were obtained from the medical records closest to the MRI scan date. Fetal Hb values used were population averages.1 Flow rate of the uterine arteries was estimated with 4D-flow MRI. Imaging parameters: TR/TE=5.5/2.9ms, FA=8°, FOV=320×320×30mm3, voxel size=1.25×1.25×1.25mm3, segments=2, temporal resolution=44ms, acceleration factor=4.7, VENC=120cm/s. Blood flow velocity at the umbilical vein (UV) was measured using phase-contrast (PC) MRI during maternal breath-hold. Imaging parameters: velocity encoding (VENC)=20cm/s, TR/TE=10.6/6.5ms, FOV=200×200mm2, voxel size=0.625×0.625×5mm3, FA=20°, and scan duration of 10s. Oxygen saturation values at the ovarian vein (SvO2,m) and the umbilical vein (SaO2,f) were extracted using a background-suppressed (BS) T2-prepared balanced steady-state free precession (T2-bSSFP).2,3 Blood T2 values were converted to oxygen saturation using previously established calibration curves for adult and fetal blood, respectively.3,4 Fetal venous oxygen saturation, SvO2,f, was measured using susceptometry-based oximetry (SBO) in the fetal abdominal aorta (AAo) as it feeds the umbilical arteries carrying deoxygenated blood to the placenta after fetal oxygen extraction. SBO was measured with an axial single-slice three-echo RF-spoiled GRE acquisition used to estimate the difference of inter-echo phase accrual between blood in the abdominal aorta and surrounding tissue, Δφ. This sequence was interleaved with a dual-slice acquisition using simultaneous echo refocusing (SER), 10mm superiorly and inferiorly to the SBO imaging slice to estimate θ, the vessel tilt with respect to B0. Imaging parameters: TR=45ms, TEGRE=10ms, TESER,1=8.8ms, TESER,2=3.5ms, FOV=307×307mm2, voxel size=1×1×5mm3, FA=15°, and scan duration of 20sec. All regions of interest (ROIs) were manually traced on the magnitude image using ImageJ and applied to a bias field corrected phase map.5 Fetal mass was calculated from fetal volume.6
RESULTS
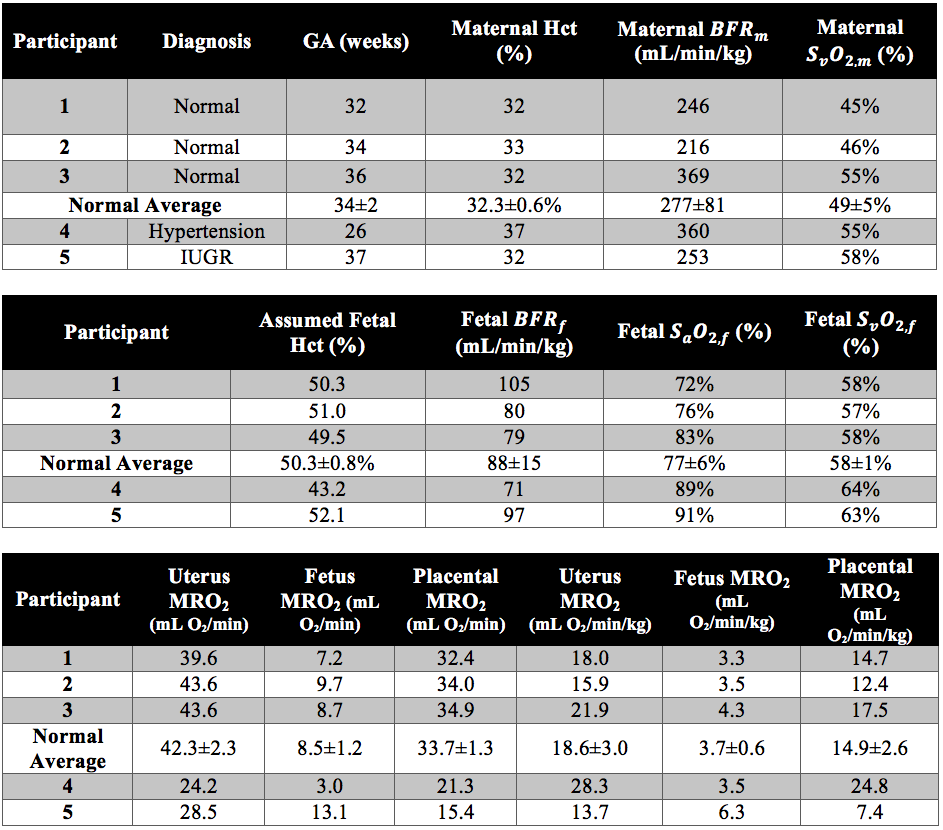
Example datasets are shown in Figures 2 and 3. In this group of five pregnant women, three were normal pregnancies (#1-3, GA=34±2wks, massf=2.3±0.4kg). Average BFRm and BFRf in this group were 277+81 and 88±15 mL/min/kg, respectively. The average arteriovenous differences of the gravid uterus and the fetus were 47±5% and 19±5%. These values were then used to estimate uMRO2 (18.6±3.0mL O2/min/kg), fMRO2 (3.7±0.6 mL O2/min/kg) and PMRO2 (14.9±2.6 mL O2/min/kg). Subject #4 (GA=26wks, massf=0.9kg) was diagnosed with chronic hypertension and subject #5 was diagnosed with intra-uterine growth restriction (IUGR, GA=37wks, massf=2.1kg). Subject #4 had high uMRO2 (28.1 vs 14.9±2.6mL O2/min/kg in normal pregnancies) and PMRO2 (24.8 vs 14.9±2.6mL O2/min/kg), while fMRO2 was similar to that of normal pregnancies (3.5 vs 3.7±0.6mL O2/min/kg). In contrast, subject #5 was found to have slightly reduced uMRO2 and PMRO2 when compared to normal pregnancies (13.7 vs 18.6±3.0 mL O2/min/kg and 7.4 vs 14.9±2.6mL/min/kg), while the opposite was found in fMRO2 (6.3 vs 3.7±0.6 mL O2/min/kg), Table 1.DISCUSSION AND CONCLUSIONS
The results presented here suggest the feasibility of estimating PMRO2 in vivo with the quantitative MRI techniques described above. Overall, our results are in agreement with those previously reported for normal pregnancies, despite differences in methods.7,8 Further, the data suggest that PRMO2 may contribute to the understanding of pregnancy complications. The current sample size is clearly too small to allow definitive conclusions to be drawn from these preliminary results. Nevertheless, the data suggest the potential utility of the proposed approach to evaluate complicated pregnancies, which will have to be addressed in future work.Acknowledgements
Human Placental Project U01 HD087180. NIH UL1TR001878.References
1. Jopling J, Henry E, Wiedmeier SE, Christensen RD. Reference ranges for hematocrit and blood hemoglobin concentration during the neonatal period: data from a multihospital health care system. Pediatrics 2009;123(2):e333-7.
2. Maleki N, Dai W, Alsop DC. Optimization of background suppression for arterial spin labeling perfusion imaging. MAGMA 2012;25(2):127-33.
3. Rodríguez-Soto AE, Abdulmalik O, Langham MC, Schwartz N, Lee H, Wehrli FW. T2 -prepared balanced steady-state free precession (bSSFP) for quantifying whole-blood oxygen saturation at 1.5T. Magn Reson Med 2017.
4. Rodríguez-Soto AE, Langham MC, Abdulmalik O, Englund E, Schwartz N, Wehrli FW. MRI Quantification of Human Fetal O2 Delivery Rate in the Second and Third Trimesters of Pregnancy. Magn Reson Med 2017. In Press.
5. Langham MC, Magland JF, Floyd TF, Wehrli FW. Retrospective correction for induced magnetic field inhomogeneity in measurements of large-vessel hemoglobin oxygen saturation by MR susceptometry. Magn Reson Med 2009;61(3):626-33.
6. Baker PN, Johnson IR, Gowland PA, et al. Fetal weight estimation by echo-planar magnetic resonance imaging. Lancet. 1994;343(8898):644-645.
7. Saini BS, Zhu M, Portnoy S, Porayette P, Lim J, Duan A, Sled JG, Wald R, Windrim R, Macgowan C, Kingdom JC, See M. OP29.07: Non-invasive in utero measurements of placental oxygen transport using MRI. Ultrasound Obstet Gynecol. 2016;48(S1):148.
8. Richardson B, Nodwell A, Webster K, Alshimmiri M, Gagnon R, Natale R. Fetal oxygen saturation and fractional extraction at birth and the relationship to measures of acidosis. Am J Obstet Gynecol 1998;178(3):572-9.
Figures