1181
Multivariate Analysis including Biological Biomarkers, Diffusion-Weighted Imaging, T1 and T2 Mapping for Renal Fibrosis Prediction1Radiology, University of Geneva, Geneva, Switzerland, 2University Hospital of Geneva, Geneva, Switzerland, 3University of Geneva, Geneva, Switzerland
Synopsis
Recently, the cortico-medullary difference in Apparent Diffusion Coefficient (ΔADC) from (RESOLVE) diffusion-weighted imaging (DWI with readout segmentation of long variable echo train) allowed the classification of kidney allograft patients according to whether they had more or less than 40% interstitial fibrosis. In this study, ΔADC was externally validated, with a very good AUC, as an index to identify patients with more than 40% fibrosis in a larger and mixed population of 130 patients. In addition, a mixed scoring including the combination of routinely obtained serologic markers including eGFR, and MRI-derived (ΔADC and ΔT1) was proposed to improve renal fibrosis prediction.
Introduction
Diffusion-weighted imaging (DWI) and T1 Mapping are two promising methods for non-invasive renal fibrosis assessment, which is currently evaluated by renal biopsy. Recently, the use of the cortico-medullary Apparent Diffusion Coefficient difference (ΔADC) from of a readout segmentation of long variable echo train (RESOLVE) DWI showed a stronger correlation (r=0.81, p<0.05) with interstitial fibrosis than cortical or medullary ADC alone, in a small cohort of 33 homogenous kidney allograft patients1. In this cohort, all patients with more than 40% of interstitial fibrosis had a negative ΔADC, whereas all patients with less than 40% had a positive ΔADC, resulting in an Area Under Curve (AUC) derived from Receiver Operating Characteristic (ROC) curve equal to 1. The following multiparametric study has two purposes. Firstly, an external validation of the 40% fibrosis threshold detectable by the ΔADC index was performed in a larger and mixed population of 130 patients. Secondly, a mixed scoring including the combination of various laboratory measurements and MRI biomarkers (ΔADC [10-6mm2/s], ΔT1 [ms], ΔT2 [ms] from DWI, T1 and T2 Mapping) was proposed to improve renal fibrosis detection.Methods
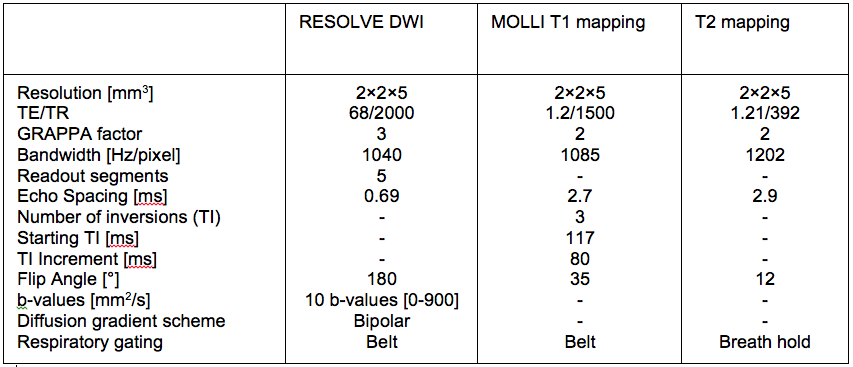
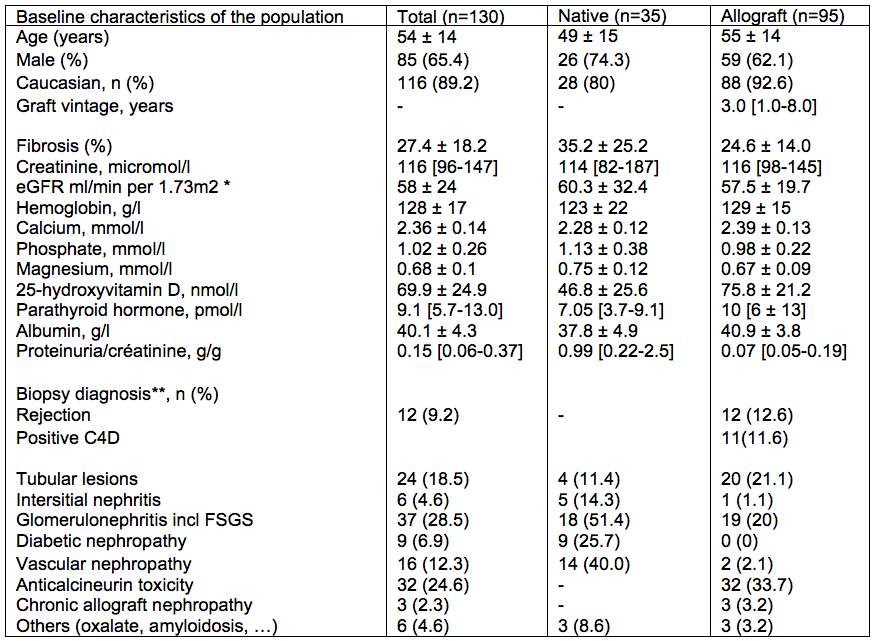
130 chronic kidney diseases patients were scanned on a PRISMA 3T MR system (Siemens) with protocol parameters as summarized in Table 1. Baseline characteristic and laboratory measurements of patients are presented in Table 2. Univariate and multivariate linear regressions were conducted between MRI biomarkers and laboratory measurements. Univariate analysis was done with the Pearson’s correlation coefficient between ∆ADC and pathological evaluation of Masson Trichrome staining. To optimize the non-invasive evaluation of fibrosis, MRI markers were combined with or without selected routinely obtained biological values, in multivariate analyses. Up to 8 biomarker values were included in the multivariate model and the values that were not independently associated to fibrosis were eliminated. The remaining model included eGFR, phosphate and proteinuria together with ∆ADC and ∆T1 (model 1). A second model excluding eGFR was assessed to provide a score that does not need eGFR assessment (model 2). Finally, MRI biomarkers without serum parameters were combined in a third multivariate model. Two-sided values of p<0.05 were considered statistically significant. External validation of the ∆ADC index, as well as performance of each multivariate model, in predicting extensive (≥40%) fibrosis were evaluated with Area Under Curve (AUC) derived from Receiver Operating Characteristic (ROC) curves.Results
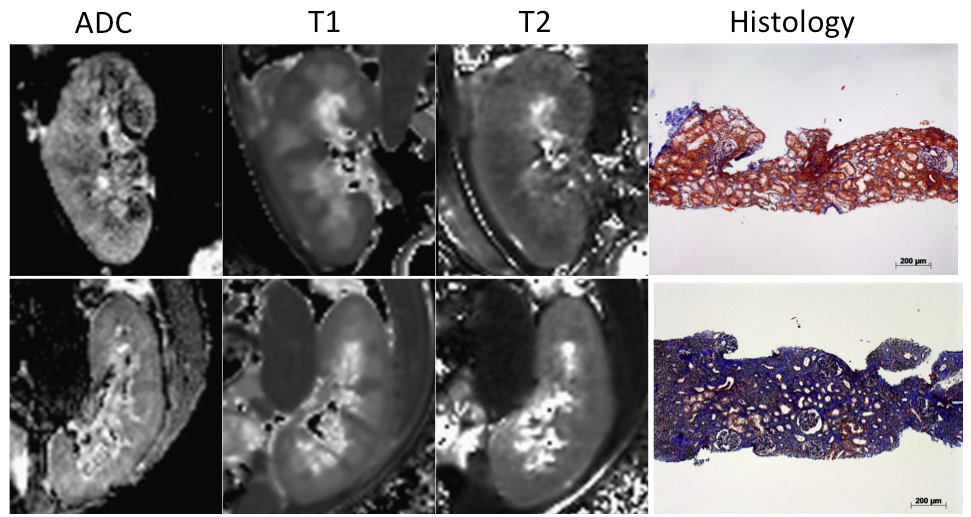
Univariate analysis of ∆ADC, ∆T1, ∆T2 for fibrosis evaluation: 97% patients had DW images of sufficient quality for analysis (Figure 1). The previously found correlation between ΔADC and fibrosis, as well as between ΔT1 and fibrosis were confirmed in the mixed population with respectively (r= -0.57, r = 0.48 p<0.001). In our population, neither T2 nor ΔT2 correlated with renal function or with fibrosis.
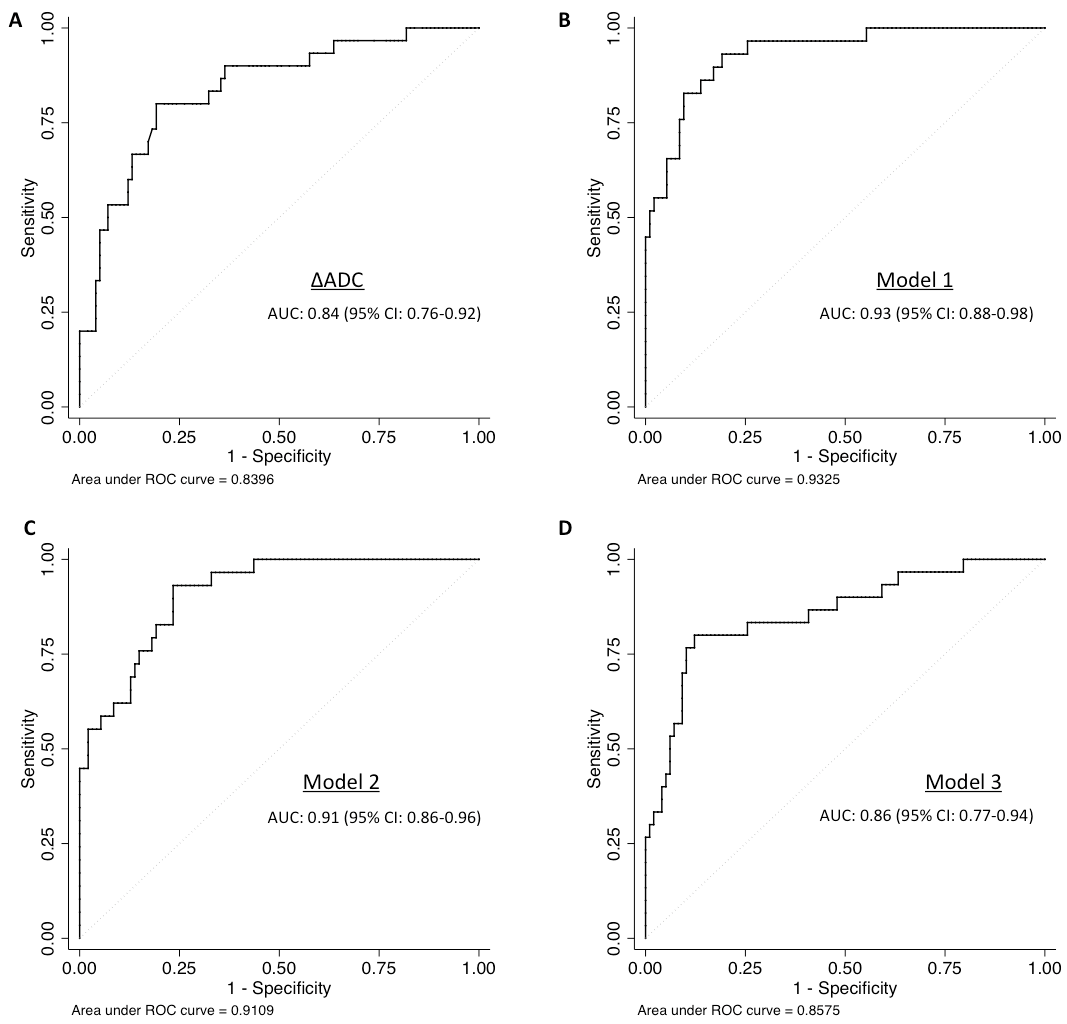
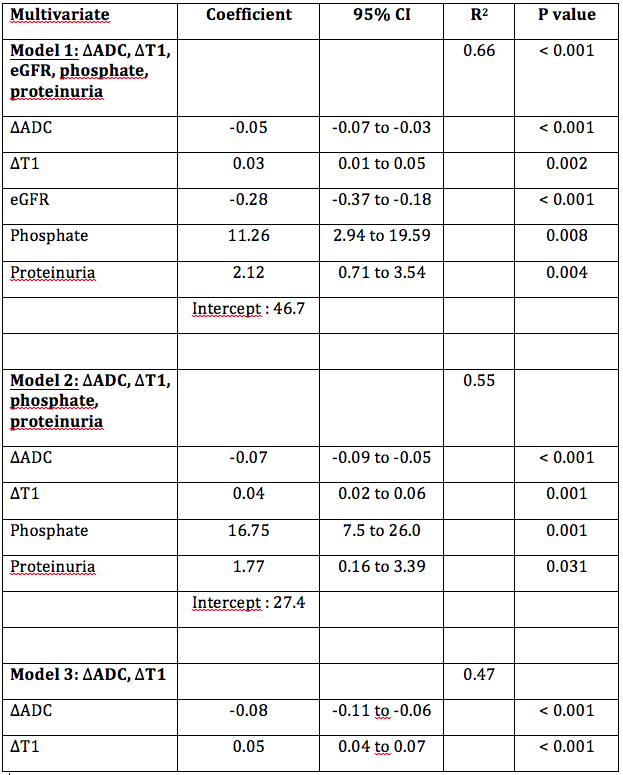
Multivariate analysis by including serum markers: Multivariate analysis, including ∆ADC, allows the identification of patients with extensive fibrosis (≥40%). Table 3 shows the coefficient, R2 and p-values for each model of the multivariate analysis. The higher R2 for this multivariate analysis was for the model 1 (∆ADC, ∆T1, together with eGFR, phosphate and proteinuria) with R2 = 0.66 and an estimated optimism of 0.065, leaving a minimum value of 0.6. Predictive error was within 20% for this model (95% CI). The ROC curve – derived AUC values are shown in Figure 2. The evaluation of the limit at 40% fibrosis detectable using the ΔADC index was validated in the new cohort with an AUC of 0.84 (95%CI: 0.76 - 0.92) (Figure 2A). Combining MRI parameters (ΔADC and ΔT1) and laboratory values (eGFR, phosphate and proteinuria) (model 1) allowed better discrimination of patients with extensive fibrosis (≥40%) with an AUC of 0.93 (Figure 2B).
Discussion
The ΔADC index from RESOLVE was still strongly correlated with cortical fibrosis in the mixed population. ΔADC was validated, with a very good AUC, as an index to identify patients with more than 40% fibrosis. This multiparametric study represents, to our knowledge, the largest study to date validating ΔADC from RESOLVE to predict fibrosis in patients undergoing biopsies. In addition, the combination of routinely obtained serologic markers and MR parameters improved renal fibrosis assessment. We found that MRI-derived ΔADC and ΔT1 were additive to laboratory measurement, including eGFR to predict fibrosis.Acknowledgements
This work was supported by the Clinical Research Center of the Medicine Faculty of Geneva University and Geneva University hospital, the Leenards and Louis-Jeantet foundations, the Centre for Biomedical Imaging (CIBM) and the Swiss National Foundation.References
1Friedli I et al. Scientific Reports 2017Figures