1172
Data-Driven Correction of B0-off-resonance fluctuations in gradient-echo MRI1Philips Research Europe, Hamburg, Germany
Synopsis
B0-off-resonance fluctuations can lead to artifacts in gradient-echo MRI with long echo-times. This work presents a purely data-driven method to estimate and correct for any B0-off-resonance fluctuation occurring during scanning, without additional data acquisition, navigator or image-processing. The estimated B0-off-resonance fluctuations are shown to be highly correlated with the signal from a respiratory bellows, the spatial variation of the fluctuations can be determined by exploiting the spatially varying coil sensitivities and histograms of R2* measurements show reduced variance.
Purpose
Breathing motion causes variations of the B0-off-resonance field, which are noticeable even far from the lungs1. These field fluctuations cause subtle artifacts on gradient echo scans, in particular for scans with long echo-time, which reduces the quality of T2*-maps, quantitative susceptibility maps and susceptibility weighted images. Field-fluctuations can be monitored during scanning using by external sensors2, using navigator-echoes3, or complicated retrospective corrections4. In this study we present a data-driven method to estimate the field-fluctuations from the raw data of the scan and correct the associated artifacts.Methods
We used a Cartesian, 3D, multi-echo, RF-spoiled gradient echo sequence (flip angle 14°, TR = 30.5 ms, TE=3.6, 11.4, 19.0, 26.6 ms) to image the brain of several volunteers with a spatial resolution of 1×1×2 mm3. Breathing was monitored with a standard respiratory bellows placed on the abdomen. The respiration induced B0-off-resonance was estimated from the raw data of the last echo by an iterative process which improves the self-consistency of the data set, comprising these steps:
- For each coil element (indexed by c), images are reconstructed using the Fourier transform: $$$I_c (r)=F(ρ_c (k))$$$.
- Subsequently, the single-channel images
are combined using coil-sensitivities sc: $$$ I=\frac{∑_c s_c^* I_c}{∑_c s_c^* s_c}$$$.
- The combined image I is transformed back to the raw data space
yielding $$$ρ_c^{'} (k)=F^{-1} (s_c I)$$$.
- The phase correction is computed from the complex ratio of $$$ρ_c^{'}$$$ and $$$ρ_c$$$: $$$Δf_c=\angle(ρ_c/ρ_c^{'})/(2\pi T_E)$$$.
The data are sorted according to the time in which k-space was traversed and low pass filtered to improve SNR before computing the angle. The phase correction is then applied to the raw data and the next iteration is started. After a total of 5 iterations the process converges. 5. Information about the spatial variation of the B0-off-resonance field fluctuations can be obtained by combining the phase-correction of the individual coil elements using the measured coil-sensitivities: $$$Δf_{dyn}=\frac{∑_c Δf_c s_c^* s_c}{∑_c s_c^* s_c}$$$. Corrected images for all echoes are obtained by applying the appropriately scaled phase correction also to the raw data of the other echoes.
Results
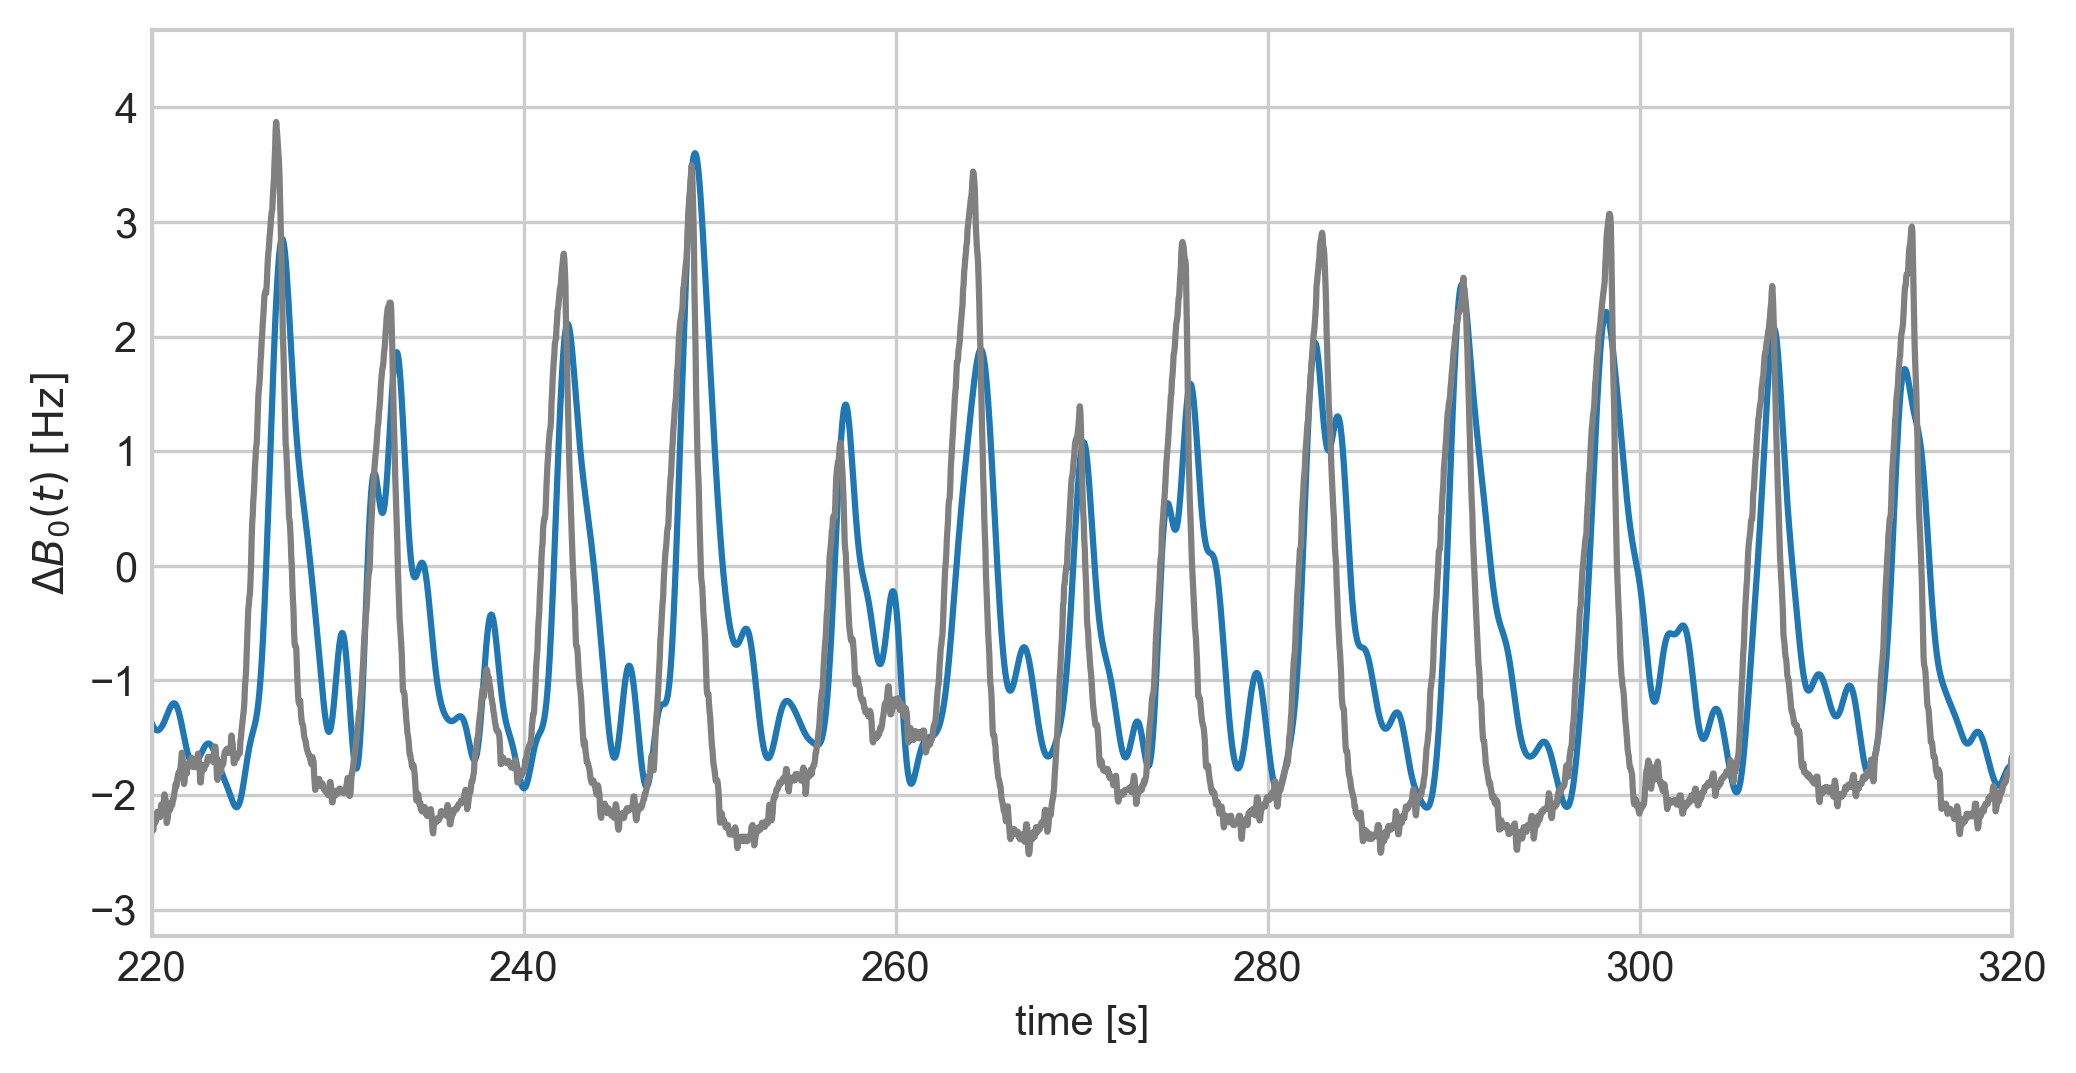
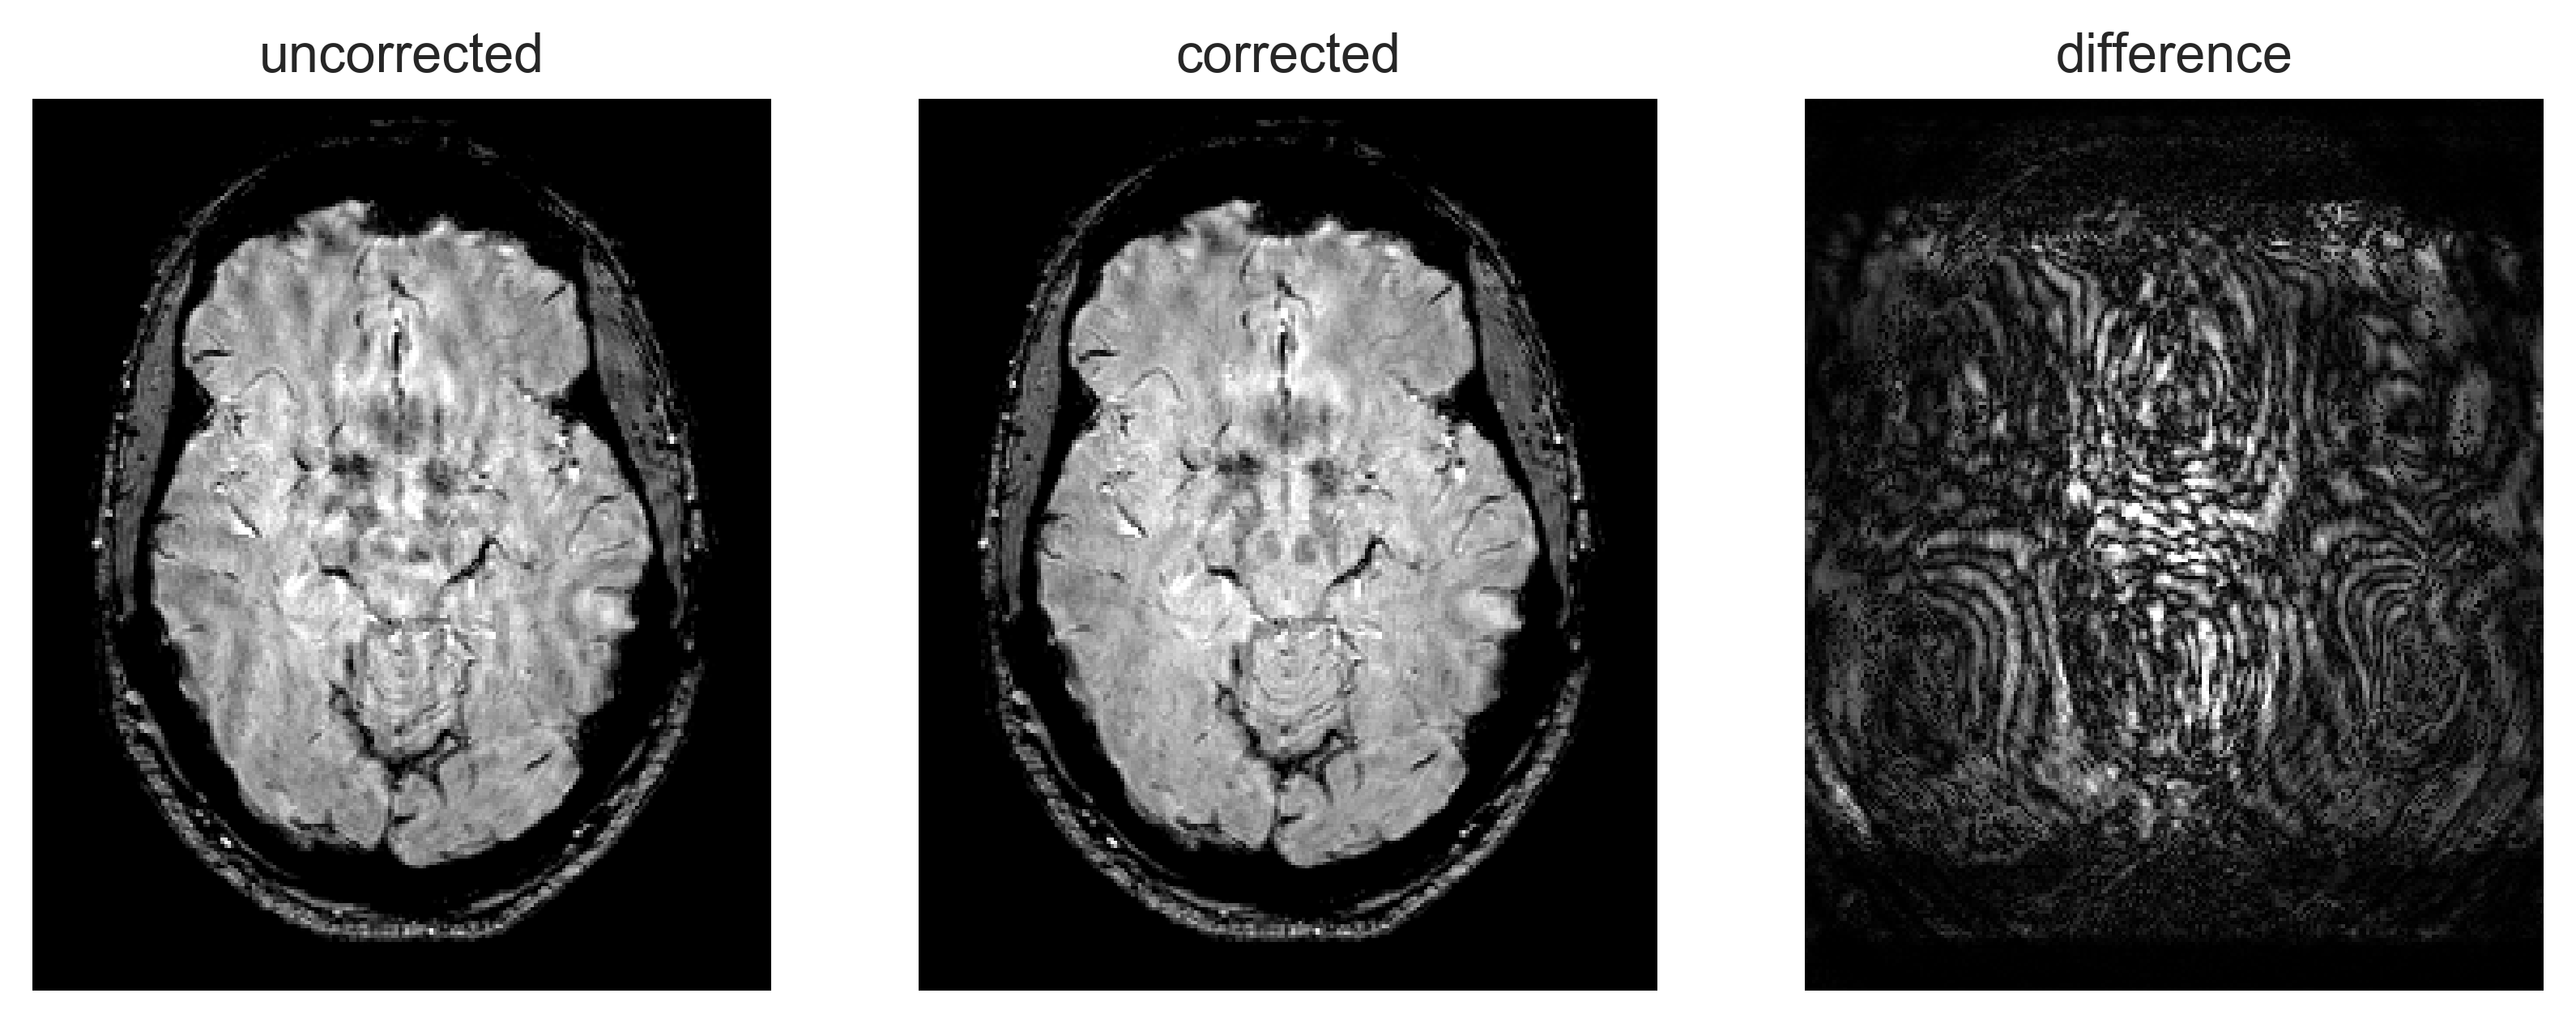
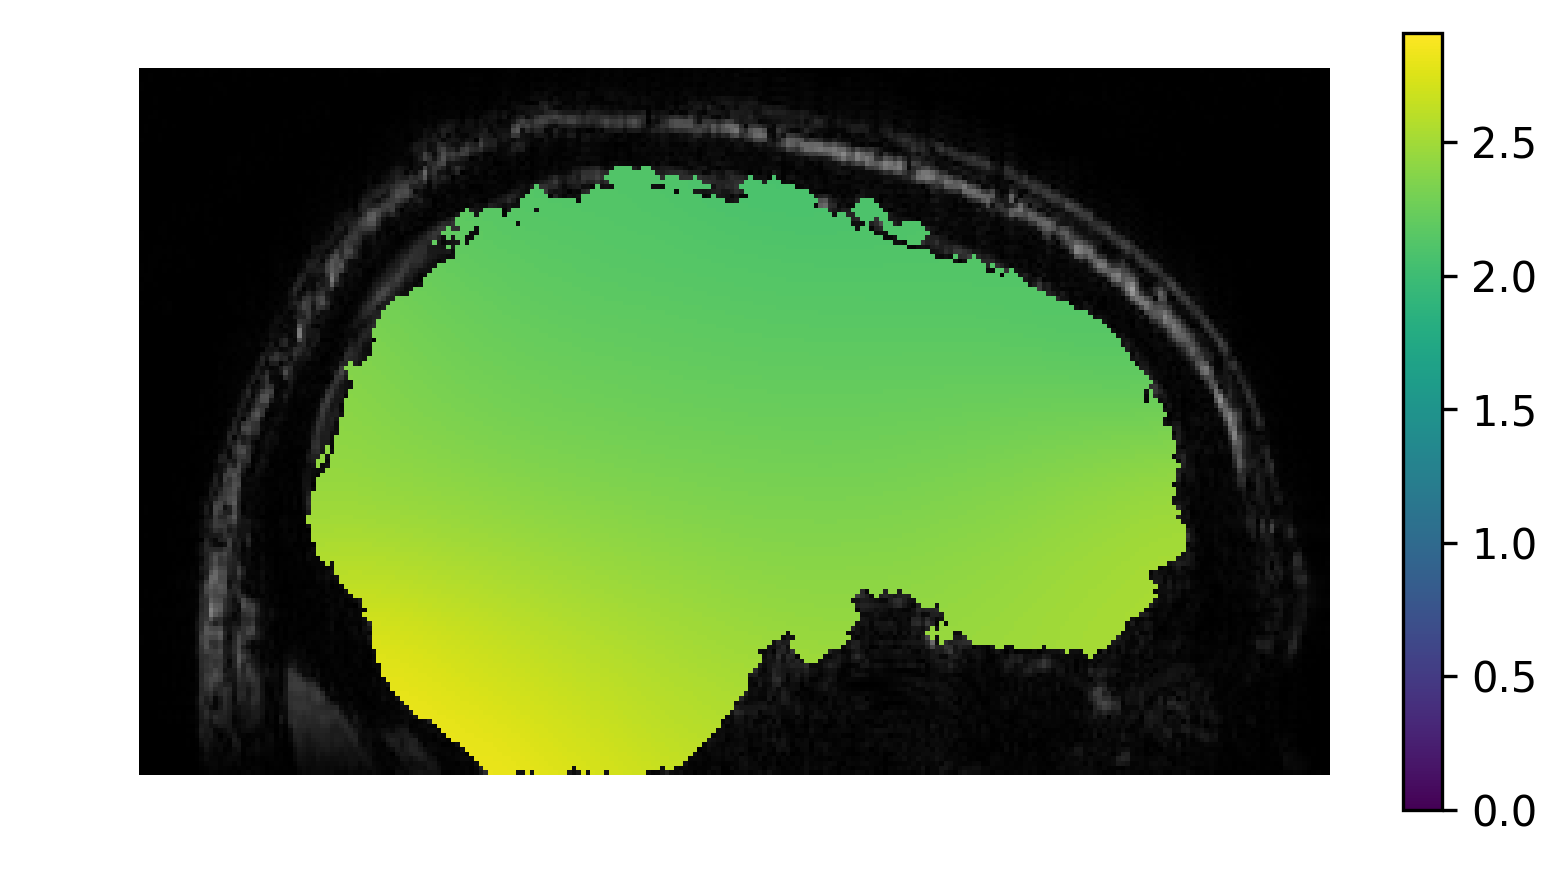
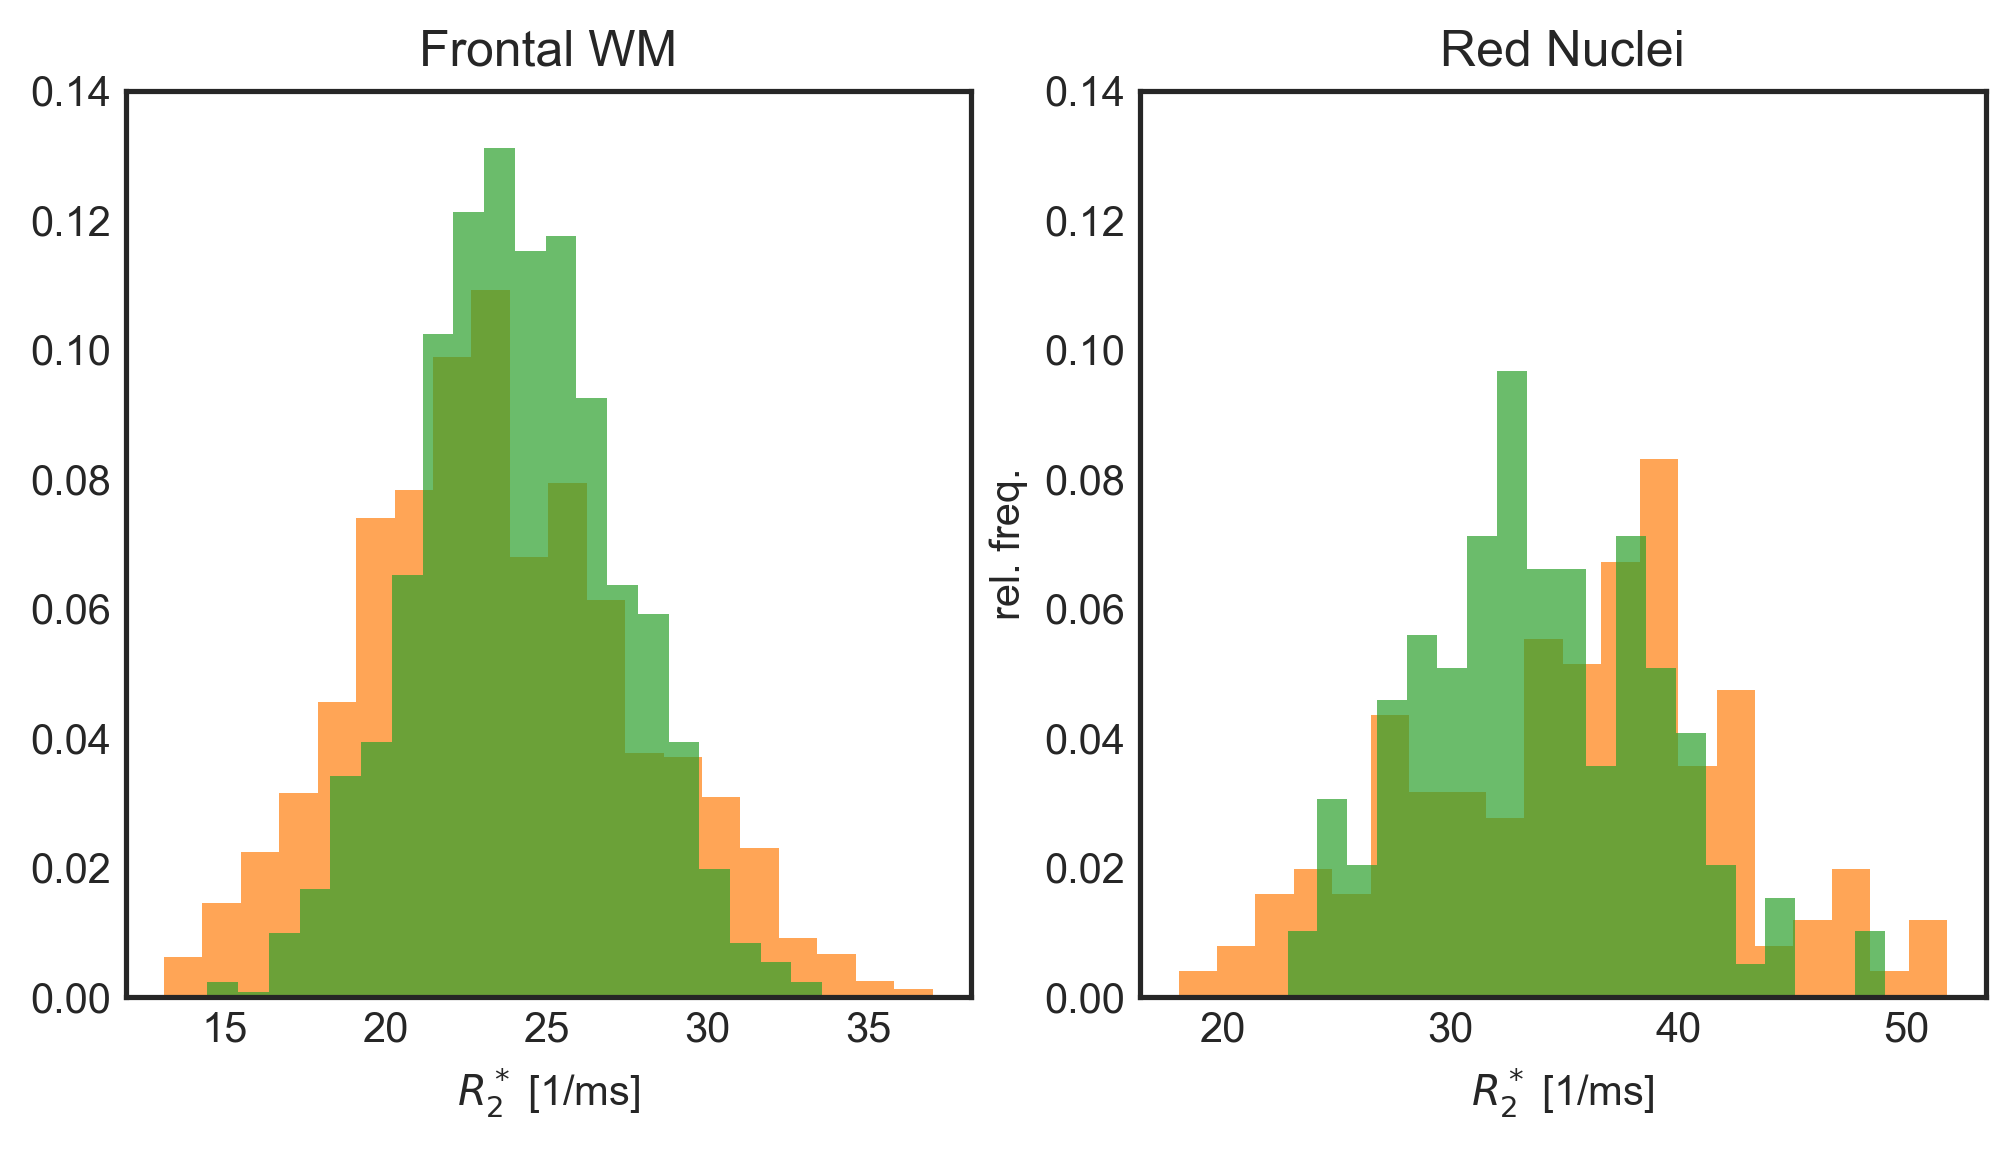
Figure 1 shows the final estimated phase fluctuation in black together with the signal from the respiration monitor (only first 2 mins of scan time shown). Figure 2a shows an uncorrected image of the last echo. Respiration-induced B0 fluctuations cause medium range ripples. Figure 2b shows the same slice as Fig. 2a after applying the phase correction in k-space. Figure 2c shows the difference of magnitude between corrected and uncorrected images. Fig. 3 shows the spatial variation of the off-resonance fluctuations. Fig. 4 demonstrates the reduction of the variance of R2* values measured in ROIs in the frontal lobe and the red nuclei.Discussion
The estimated field fluctuation correlates very well with the signal from the respiration monitor. The amplitude of the phase correction is according to expectations. Comparing the images shown in Figure 2, a clear reduction in breathing induced artifacts by the data-derived phase correction is seen. Figure 3 clearly demonstrates the ability to resolve the reduction of B0-fluctuation amplitude for locations further away from the chest.Conclusion
The presented data-driven correction method can estimate breathing-motion and effectively reduce artifacts, eliminating the need for additional sensors to monitor respiration induced field fluctuations and without changes to the original data-acquisitionAcknowledgements
No acknowledgement found.References
- Moortele et al., MRM 47:888 – 895 (2002)
- Andersen et al., MRM 75: 2020-2030 (2016)
- Versluis et al., NeuroImage 51: 1082-1088 (2010)
- Loktyushin et al., Proc. 24th ISMRM: 1848 (2016)
Figures