1165
Proton MRS-Detected Creatine Metabolic Profiles in Human Breast Cancer Cells Correlate with the Prognostic Indicator Ubiquitous Mitochondrial Creatine Kinase (CKMT1)1Radiology, The Johns Hopkins University School of Medicine, Baltimore, MD, United States, 2F.M. Kirby Research Center for Functional Brain Imaging, Kennedy Krieger Institute, Baltimore, MD, United States
Synopsis
Ubiquitous mitochondrial creatine kinase (CKMT1) is an important mitochondrial membrane component responsible for the reversible conversion of creatine (Cr) to phosphocreatine (PCr). This study shows that in five breast cell lines of varying aggressiveness, 1H MRS-detected PCr levels correlated with CKMT1 mRNA expression. CKMT1 expression was significantly downregulated in triple-negative breast cancer cells compared to estrogen receptor (ER)/ progesterone receptor (PR)-positive cells, and nonmalignant cells. CKMT1 is a prognostic indicator in several cancers; thus, PCr holds promise as potential marker for improved cancer diagnosis, patient stratification, and theranostic treatment monitoring.
Introduction
Aberrant creatine metabolism is a metabolic feature of human breast cancer4, manifesting in metabolite profiles bearing low creatine (Cr) and phosphocreatine (PCr) levels1, 2. Previous studies have identified decreases in creatine (Cr) and phosphocreatine (PCr) signals (at ~3.04 ppm, using 1H MRS) with respect to breast cancer progression1, 2, 6. While these metabolic changes have recently been established, they are not well understood. In these experiments, we sought to elucidate the molecular basis for these trends. We first performed an analysis of creatine-related enzymes from publicly available microarray data. High-resolution (HR) 1H MRS was used to quantify creatine metabolite concentrations in cell extracts. Quantitative RT-PCR was used to assess expression levels of enzymes involved in creatine metabolism.Methods
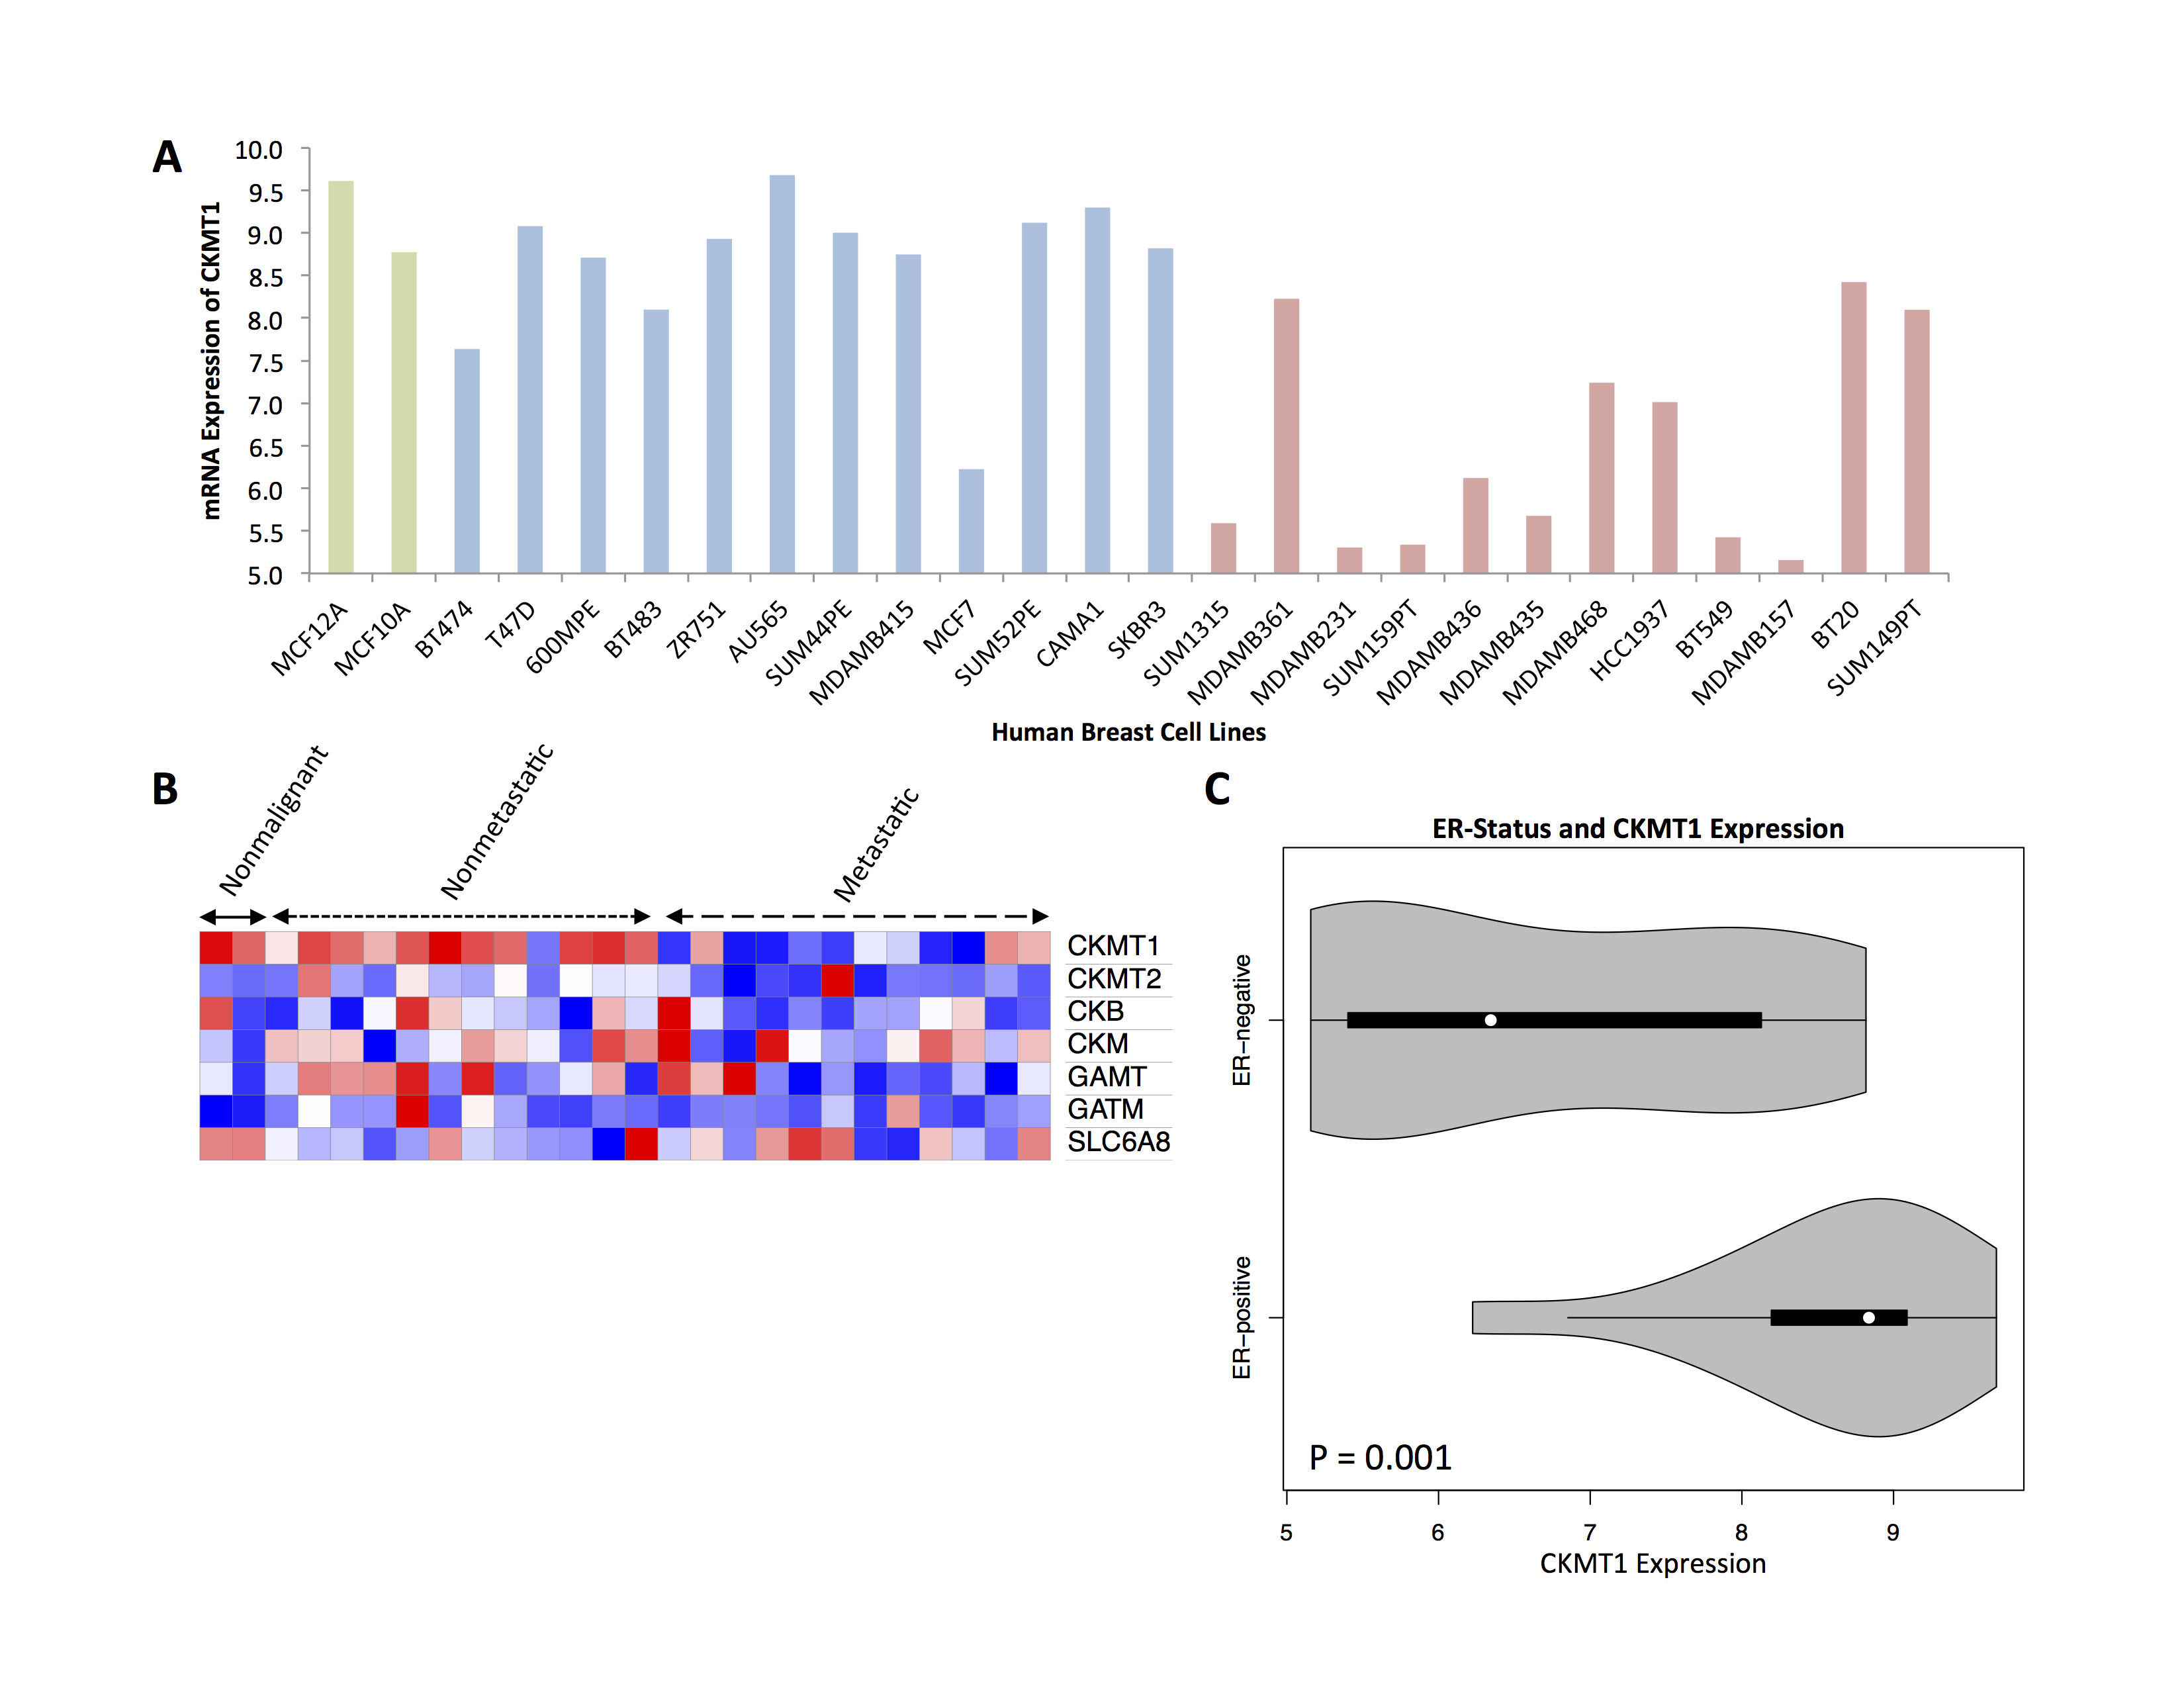
Two nonmalignant (MCF-10A, MCF-12A), twelve nonmetastatic (BT-474, T-47D, 600-MPE, BT-483, ZR-75-1, AU-565, SUM44PE, MDA-MB-415, MCF-7, SUM52PE, CAMA-1, SK-BR-3) and twelve metastatic cell lines (SUM1315, MDA-MB-361, MDA-MB-231, SUM159PT, MDA-MB-436, MDA-MB-435, MDA-MB-468, HCC-1937, BT-549, MDA-MB-157, BT-20, SUM149PT) were analyzed among a microarray dataset (GSE-69017) wherein RNA extraction and hybridization on Affymetrix microarrays were performed on breast cell lines5. Relative expression of CKMT1, CKMT2, CKB, CKM, GAMT, GATM, and SLC6A8 were analyzed. A heat map was generated using the Morpheus platform (https://software.broadinstitute.org/morpheus/index.html).
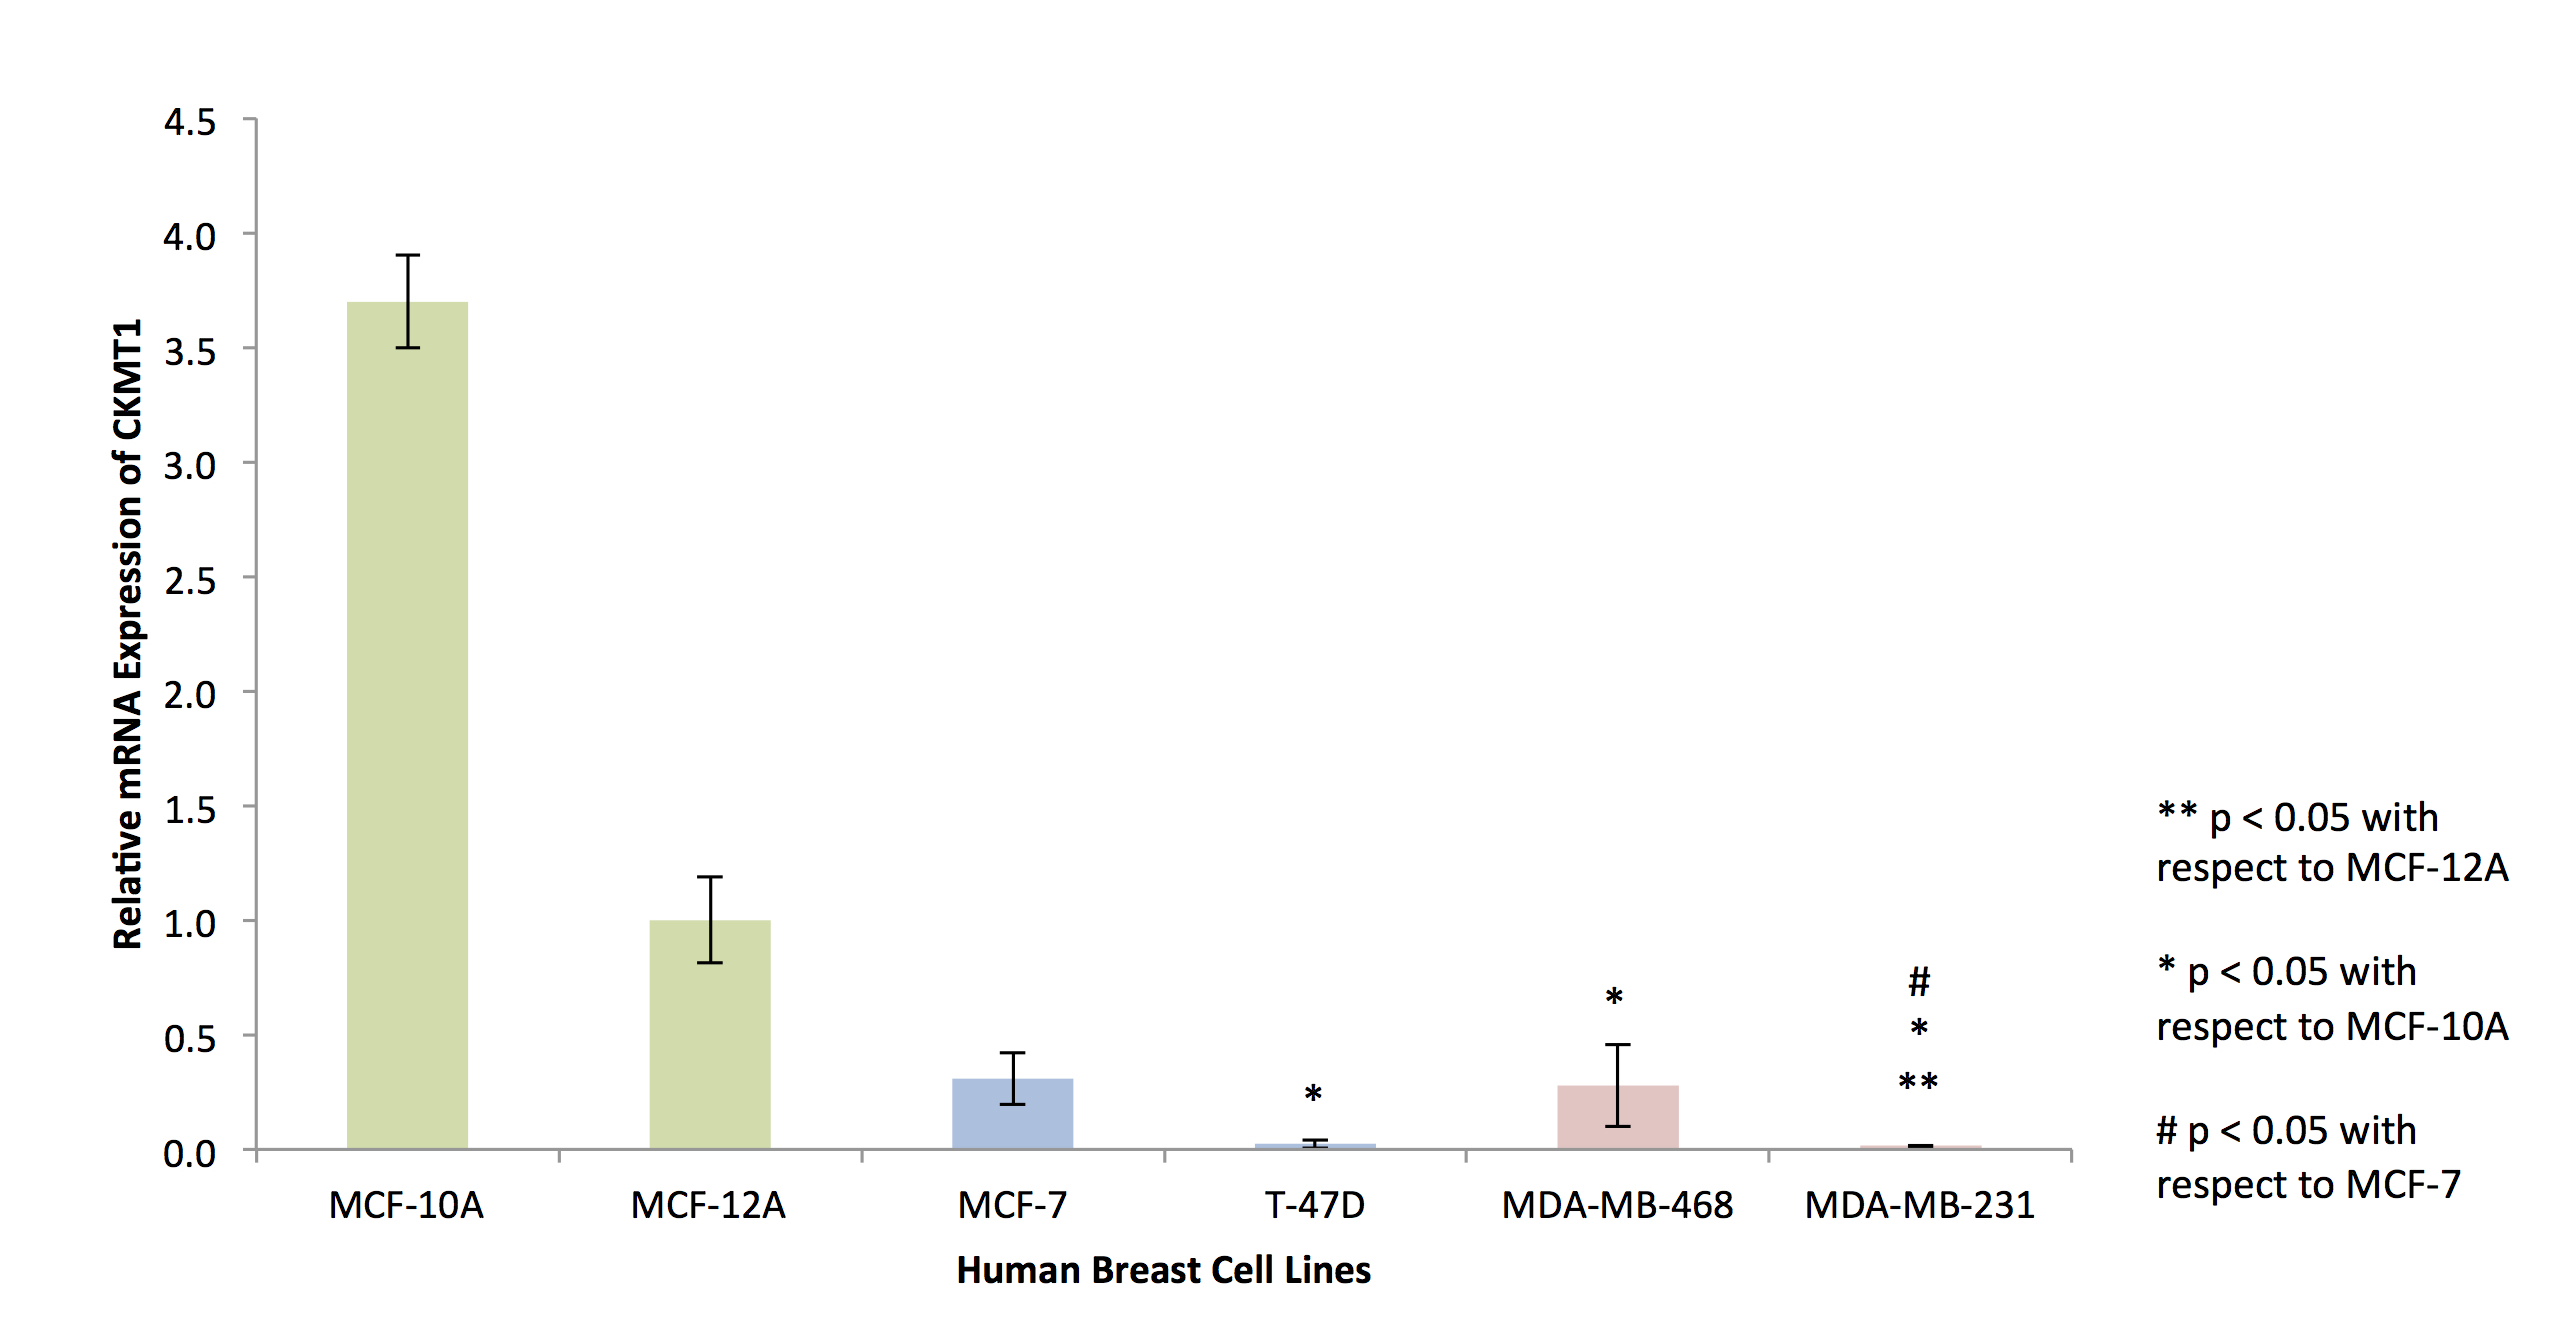
RNA isolated from cells of the six breast cell lines (MCF-10A, MCF-12A, MCF-7, T-47D, MDA-MB-468, MDA-MB-231) was reverse-transcribed before SYBR Green-based quantitative RT-PCR was used to detect variations in endogenous CKMT1 expression. Expression was quantified via the ΔΔCT method, in triplicates.
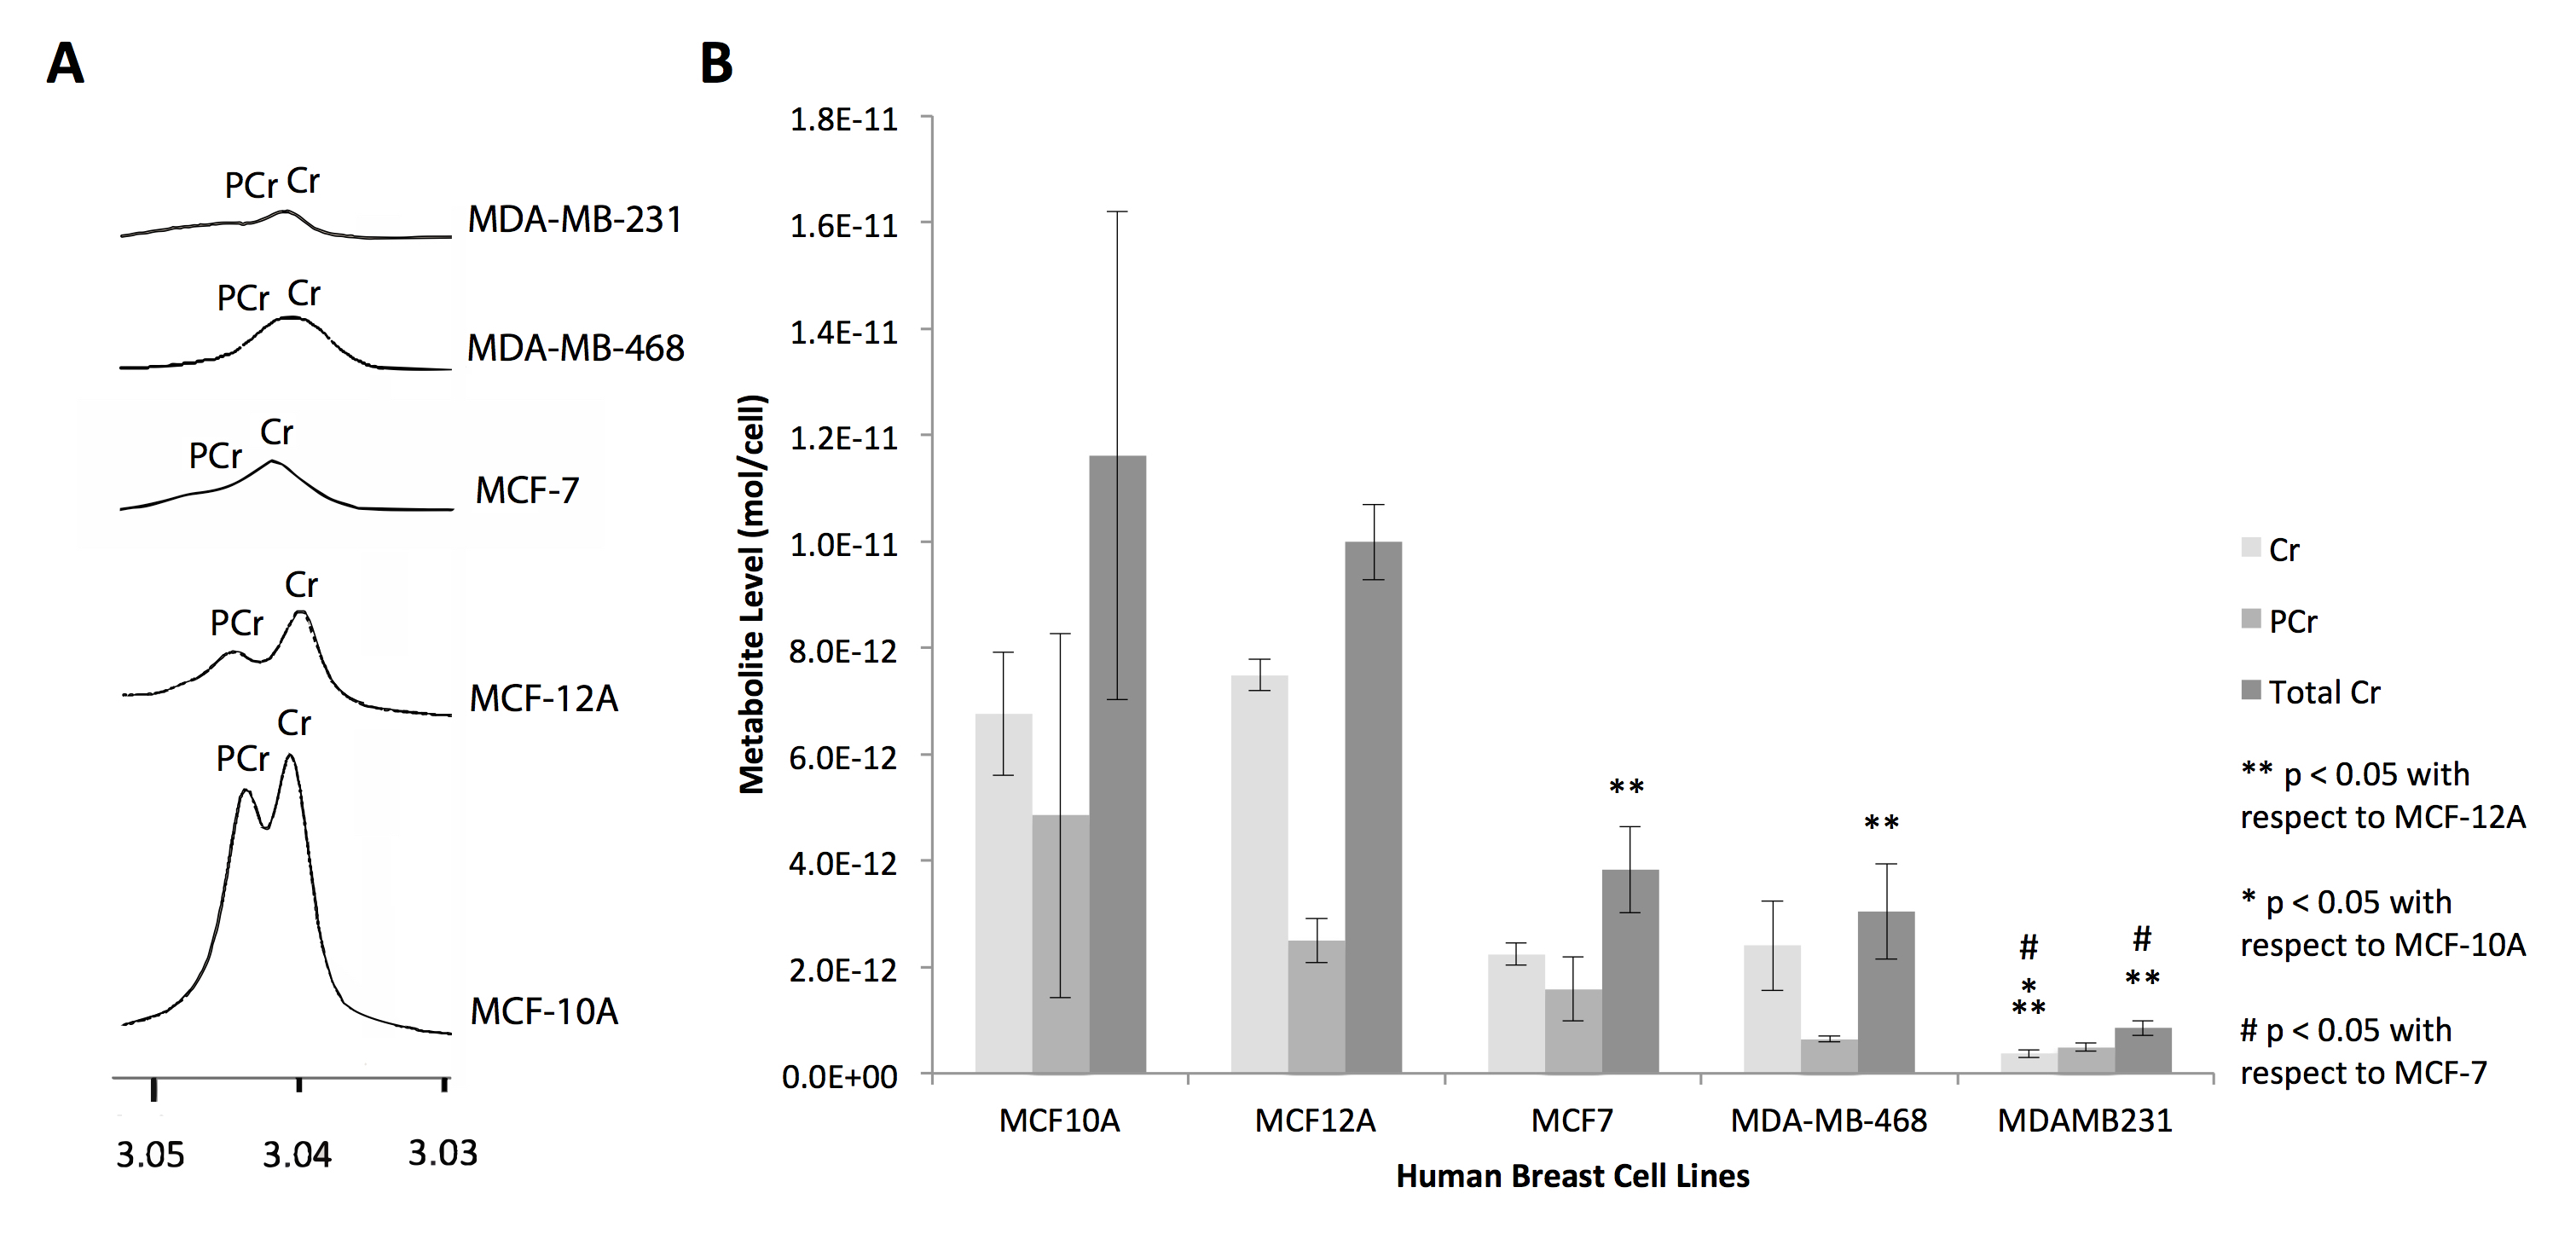
Metabolites were extracted from five breast cell lines (MCF-10A, MCF-12A, MCF-7, MDA-MB-468, MDA-MB-231) using dual-phase extraction (methanol:chloroform:water=1:1:1). 1H MRS of the aqueous extract fraction was obtained via a Bruker 750 MR spectrometer, and creatine and phosphocreatine concentrations were quantified using TopSpin software.
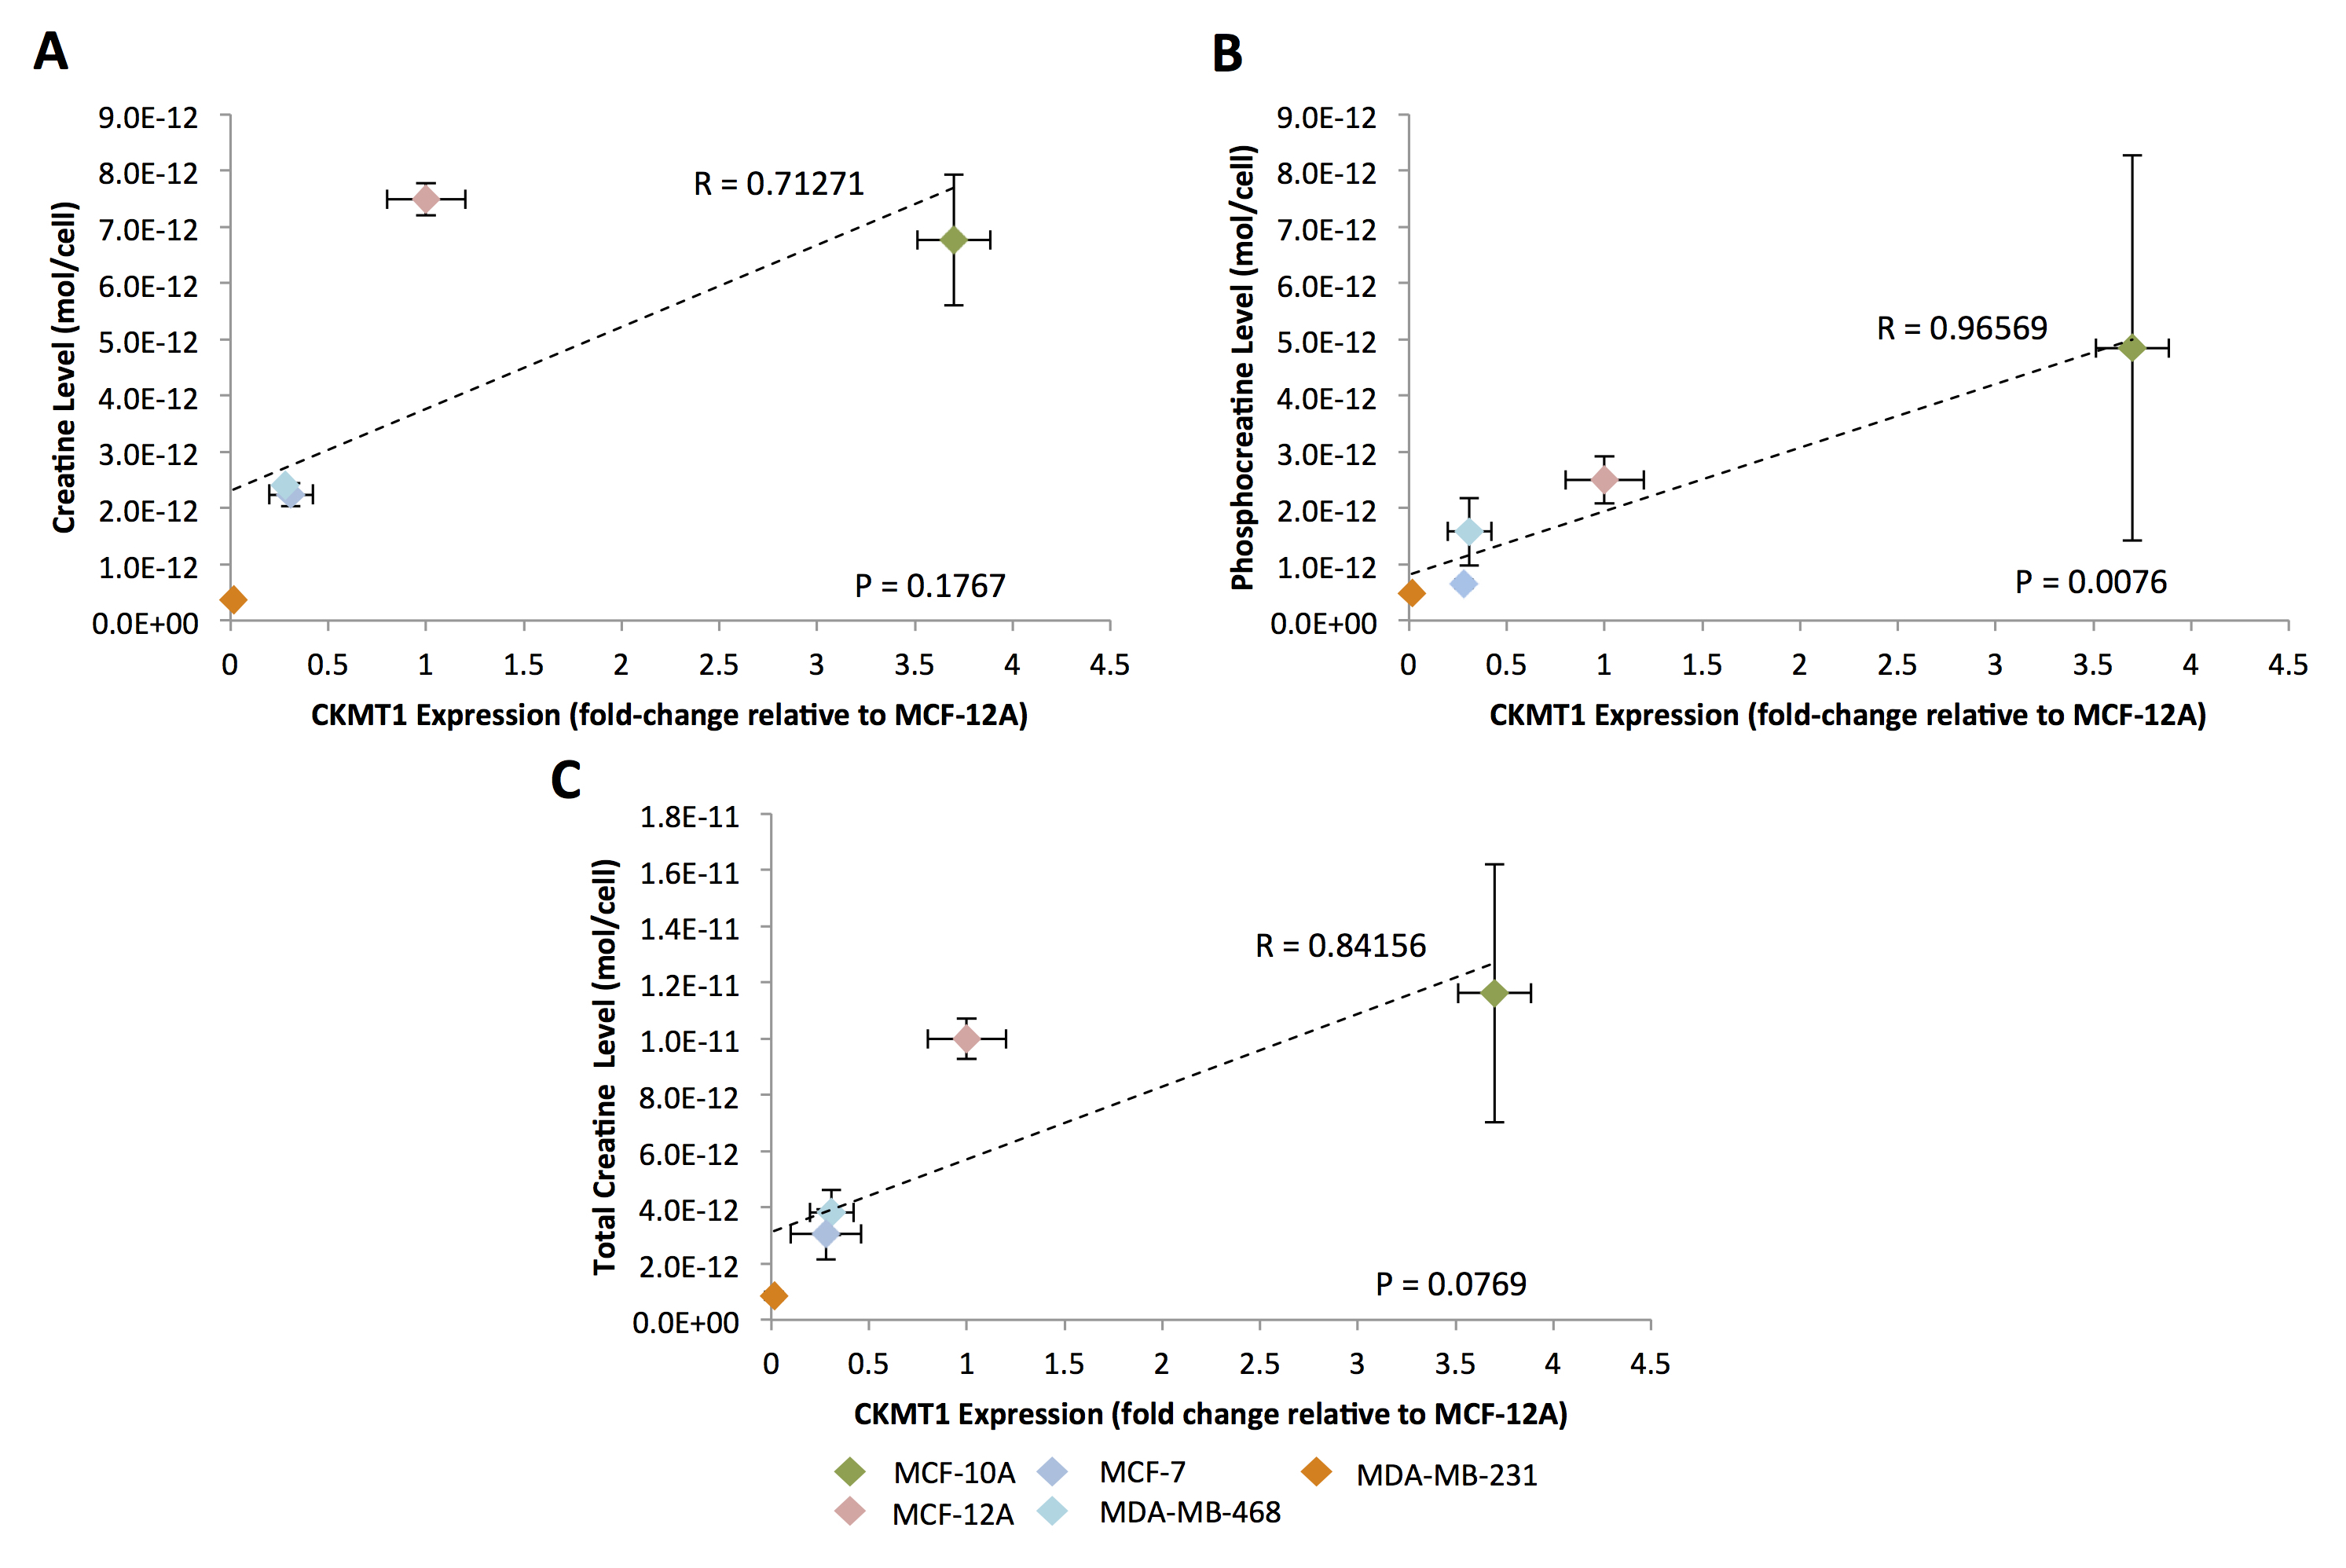
For all studies, unpaired, two-sample t-tests were used, with p-value < 0.05 considered significant. Correlations between mRNA expression and metabolite concentrations were detected using Pearson correlation analysis with p-value < 0.05 considered significant and p-value 0.05 < p < 0.15 considered trending toward significance.
Results
In silico analysis of six genes involved in creatine synthesis and metabolism identified significant downregulation (Figure 1A,C) of CKMT1, which phosphorylates creatine to form phosphocreatine7, among metastatic compared to nonmetastatic breast cancer cell lines, and more specifically, among ER-negative compared to ER-positive breast cancer cell lines. None of the other genes examined displayed significant alterations in mRNA expression with respect to metastatic potential or estrogen-receptor positivity/negativity (Figure 1B). These trends in CKMT1 expression were confirmed by quantitative RT-PCR validation (Figure 2). 1H MRS demonstrated increases in total creatine (tCr) signal with respect to increasing mRNA CKMT1 expression (Figure 4C), including a statistically significant correlation of PCr level with CKMT1 expression (Figure 4B). Moreover, among the five cell lines tested, malignant cell lines contained decreased creatine metabolite levels compared to nonmalignant cell lines; specifically, the ER/PR positive MCF-7 and triple-negative MDA-MB-468 and MDA-MB-231 cells displayed a significantly smaller tCr signal than nonmalignant MCF-12A cells. Moreover, MDA-MB-231 cells displayed significantly lower tCr levels than MCF-7 cells (Figure 3A, B).Discussion
This study demonstrates for the first time that CKMT1 expression positively correlates with PCr levels and shows a trend toward positive correlation with the total creatine signal in breast cancer. The expression of CKMT1 was significantly decreased in triple-negative breast cancer cell lines relative to ER/PR positive and nonmalignant cell lines. Consistent with previous studies2, triple-negative cell lines showed significantly decreased creatine metabolite levels relative to ER/PR-positive and nonmalignant cell lines. Since it has been established that CKMT1 is a prognostic indicator in several cancers3, our study shows that 1H MRS detection of creatine metabolite signals in breast cancer may be useful for noninvasively assessing CKMT1 levels in breast cancer patients.Conclusions
1H MRS-detected creatine metabolite concentrations can be used to evaluate CKMT1 expression and may in the future improve breast cancer diagnosis and patient stratification. Moreover, CKMT1 may be an interesting theranostic target that could be monitored using MRS.Acknowledgements
We thank all members of the Division of Cancer Imaging Research in The Russell H. Morgan Department of Radiology and Radiological Science for their help and support.References
[1] Cao, M. D., Lamichhane, S., Lundgren, S., Bofin, A., Fjøsne, H., Giseødegård, G. F., Bathen, T. F. (2014). Metabolic Characterization of Triple Negative Breast Cancer. BMC Cancer. 14 (941).
[2] Chan, K. W. Y., Jiang, L., Cheng, M., Wijnen, J. P., Liu, G., Huang, P., van Zijl, P. C. M., McMahon, M. T., Glunde, K. (2016) CEST-MRI Detects Metabolite Levels Altered by Breast Cancer Cell Aggressiveness and Chemotherapy Response. NMR Biomed., 10(29): 806-816.
[3] Fenouille, N., Bassil, C.F., Ben-Sahra, I., Benajiba, L., Alexe, G., Ramos, A., Pikman, Y., Conway, A.S., Burgess, M.R., Li, Q., Luciano, F., Auberger, P., Galinsky, I., DeAngelo, J.D., Stone, R.M., Zhang, Y., Perkins, A.S., Shannon, K., Hemann, M.T., Puissant, A. and Stegmaier, K. (2017). The Creatine Kinase Pathway is a Metabolic Vulnerability in EVI1-Positive Acute Myeloid Leukemia. Nature Medicine. 23(3):301-313.
[4] Hanahan, D., Weinberg, R.A. (2011). Hallmarks of Cancer: The Next Generation. Cell. 144(5):646-674.
[5] Neve, R. M., Chin, K., Fridlyand, J., Yeh, J., Baehner, F. L., Fevr, T., … Gray, J. W. (2006). A collection of breast cancer cell lines for the study of functionally distinct cancer subtypes. Cancer Cell, 10(6):515–527.
[6] Wijnen, J. P. Wybe, J. M. V., Luttje, M., Korteweg, M., Luijten, P. R., Klomp, D. Quantitative 31P Magnetic Resonance Spectroscopy of the Human Breast at 7T. Magnetic Resonance in Medicine.68(2):339-348.
[7] Wyss, M., Kaddurah-Daouk, R. (2000). Creatine and Creatinine Metabolism. Physiological Review, 80(3):1107-1213.
Figures