1164
Predicting breast cancer patient survival using textural features in CE MR images1Department of Circulation and Medical Imaging, NTNU, Trondheim, Norway, 2Department of Radiation Oncology, NYU Langone Health, New York, NY, United States, 3Cancer clininc, St. Olavs University Hospital, Trondheim, Norway, 4Department of Clinical and Molecular Medicine, NTNU, Trondheim, Norway, 5Department of Radiology, St. Olavs University Hospital, Trondheim, Norway, 6Radiology department, Hull & East Yorkshire Hospitals NHS Trust, Hull, United Kingdom, 7Department of Radiology, Memorial Sloan Kettering Cancer Center, New York, NY, United States
Synopsis
Treatment for women with locally advanced breast cancer (LABC) is determined with inadequate knowledge of the long-term outcome. We evaluated the prognostic value of textural features derived from pre-treatment CE-MRI in 55 LABC patients scheduled for neoadjuvant chemotherapy. Using overall survival at 7-years follow-up as endpoint, textural features derived from post-contrast pre-treatment images were significantly different. Using all textural features as input for multivariate analysis, we achieved a classification accuracy of 72% (p<0.001), which increased to 78% when including traditional prognostic factors (p<0.001). Textural features provide prognostic information, which can complement the stratification of patients to treatment.
Introduction
The prognosis for women with locally advanced breast cancer (LABC) is poor, and treatment is aggressive with a multimodal approach1. Tumor stage and receptor status are current clinical predictive biomarkers2, and neoadjuvant chemotherapy has become the standard treatment, with the purpose to downstage the tumor and eradicate possible micrometastases prior to surgery. To optimize stratification to treatment, it is crucial to improve prediction of long-term response. The aim of this study was to evaluate the prognostic value of textural features derived from contrast enhanced MR images obtained prior to onset of neoadjuvant therapy in patients with LABC.Methods
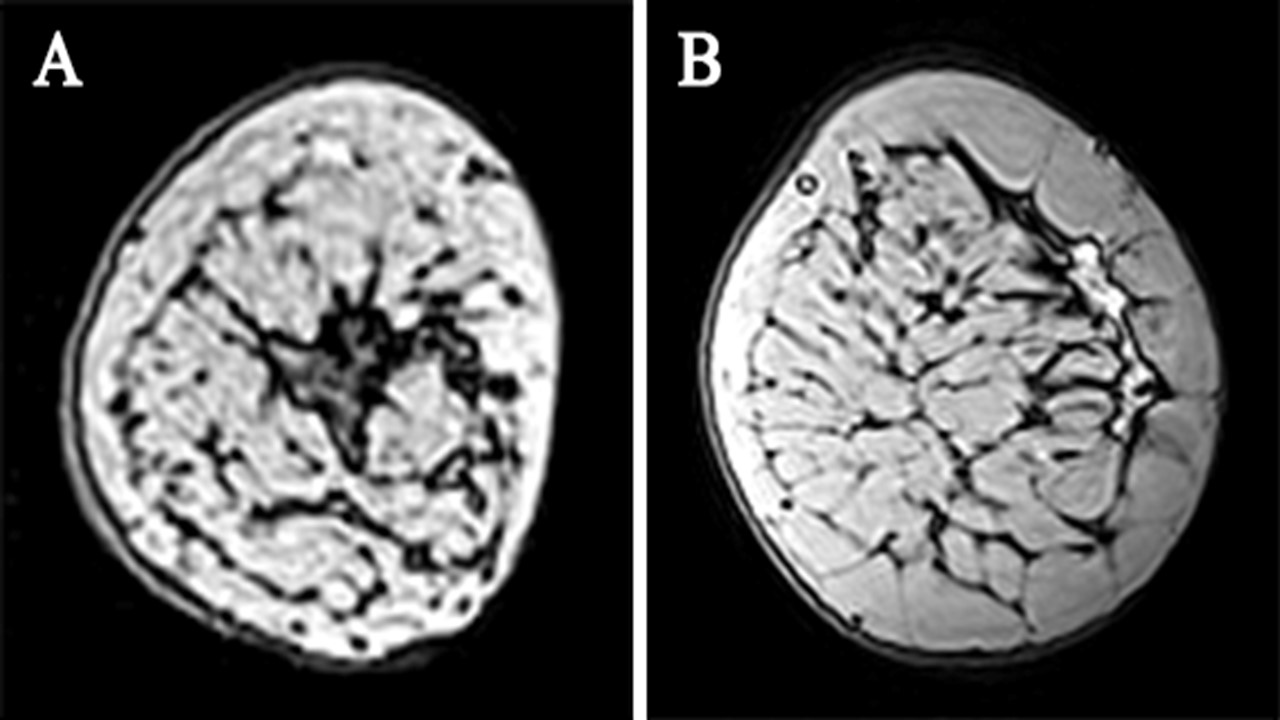
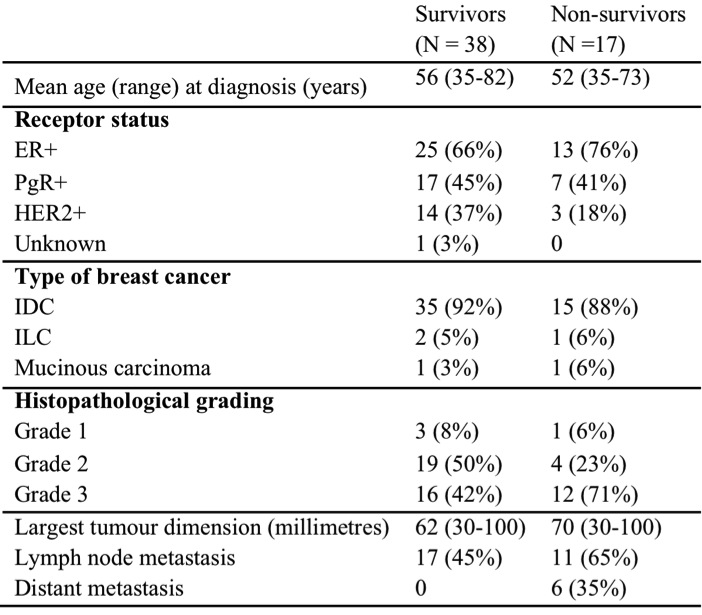
This study includes 55 women with LABC treated at St. Olav’s University Hospital, in Trondheim, Norway (2007 – 2010)3, Table 1. Pre-treatment T1-weighted GRE images were acquired on a 3T MR scanner (Siemens Tim Trio, Erlangen, Germany) with a dedicated four-channel bilateral breast coil. In addition to a baseline image, seven post-contrast images at one-minute temporal resolution were acquired. Figure 1 shows two-minutes post-contrast images from a survivor and non-survivor. After motion artefacts correction (FSL package, Oxford FMRIB Centre, UK), tumors were segmented in the two minutes post contrast images. Two-dimensional grey level co-occurrence matrix (GLCM) texture analysis on the segmented tumor after histogram equalization resulted in 16 GLCM features (f1 through f16), for each of the baseline and seven post-contrast images. Seven years of follow-up was available for all patients, and the overall survival (OS) at 7 years was used as endpoint in all further analyses.
We used linear mixed-effects models (LMMs) to examine if differences in GLCM features (f1-f16) were related to OS (nlme package in R), using both pre and all post-contrast measurements. Pre-contrast GLCM feature values, time (min) and OS were used as fixed effects and patient number as random effect for modelling post-contrast GLCM values. Kaplan-Meier analysis with log-rank test was applied to assess OS based on values for the 16 individual textural features, using the mean GLCM feature as threshold. The prognostic value was also assessed by partial least squares discriminant analysis (PLS-DA) using the PLS toolbox in MATLAB. GLCM features (2 and 3 minutes post contrast), clinical prognostic factors, and a combination of the two, were used as inputs to PLS-DA. Models were built for OS, using random subsets with 10 data splits and 20 iterations as cross-validation method.
Results
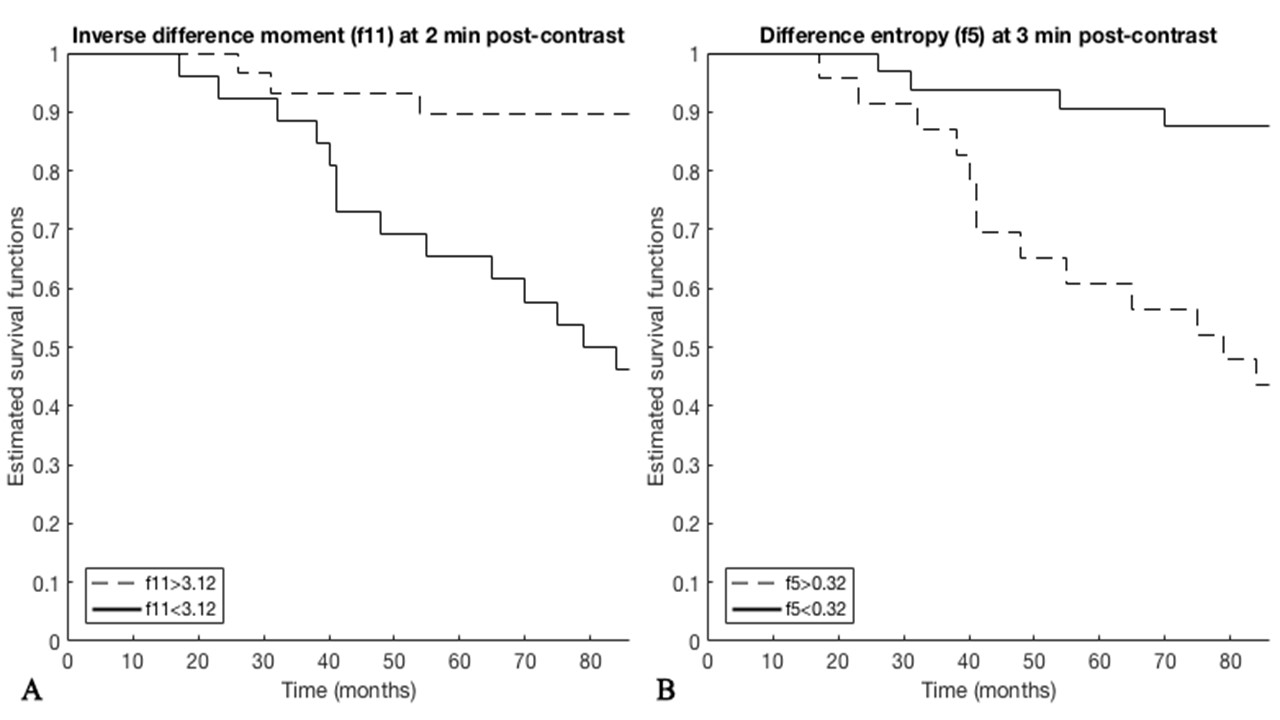
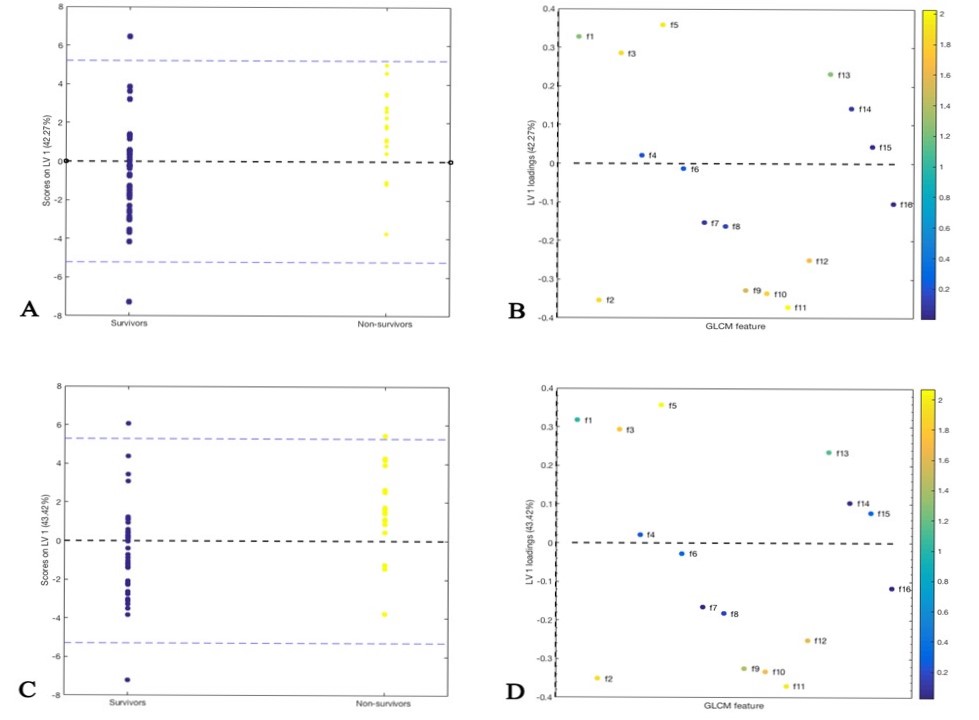
LMM showed significant differences in GLCM features (f1, f2, f5, f9, f10, f11) between survivors and non-survivors. GLCM features in two-minutes (f1, f2, f5, f10 and f11) and three minutes (f1, f5 and f11) post-contrast images were significantly different (p<0,05) between the two groups. The mean value for f11 from 2 minutes and f5 from 3 minutes post-contrast images provided most significantly different survival curves in Kaplan-Meier analysis (Figure 2). In the PLS-DA model for prediction of OS, GLCM features from 2 min post-contrast images achieved a classification accuracy of 72% (p<0.001), whereas traditional prognostic factors resulted in a classification accuracy of 70% (p=0.005). Using a combination of traditional prognostic factors and GLCM features yielded the highest classification accuracy (78%, p<0.001). Scores and loadings from PLS-DA are shown in Figure 3.Discussion
This study shows that textural features from post-contrast MR images display prognostic information. f1 (angular second moment) measures homogeneity of an image, while f11 (difference entropy) is related to heterogeneity of the image. In our cohort, survivors were associated with lower and higher values of f1 and f11, respectively. The relationship between textural features and overall survival in locally advanced breast cancer is in accordance with recently reported studies4,5, although there appears to be differences regarding what features are considered most useful. However, of the features with most significant association to survival in our cohort, f10 (a measure of variation in the difference in gray levels between voxel pairs) was previously shown to correlate with treatment response in the same dataset3, but also in an independent patient cohort6. We also observed more significant associations for features in two-minutes compared to three minutes post contrast images, as also reported when associating textural features to treatment response3, 4, demonstrating that this post-contrast time-point may be more sensitive for cancer tissue signal enhancement of clinical importance.Conclusion
The current study shows a clear association between textural features from post-contrasts images obtained prior to onset of neoadjuvant chemotherapy and overall survival at 7 years of follow-up. Further studies in larger cohorts should be undertaken to investigate how this prognostic information can be used to benefit treatment stratification.Acknowledgements
No acknowledgement found.References
1. Giordano, S. H. Update on locally advanced breast cancer. The oncologist, 2003; 8(6), 521-530.
2. Connolly R, Stearns V. Current approaches for neoadjuvant chemotherapy in breast cancer. Eur J Pharm. 2013;717(0):58-66.
3.Teruel JR, Heldahl MG, Goa PE, Pickles M, Lundgren S, Bathen TF, et al. Dynamic contrast-enhanced MRI texture analysis for pretreatment prediction of clinical and pathological response to neoadjuvant chemotherapy in patients with locally advanced breast cancer. NMR Biomed. 2014;27(8):887-896.
4. Pickles MD, Lowry M, Gibbs P. Pretreatment Prognostic Value of Dynamic Contrast-Enhanced Magnetic Resonance Imaging Vascular, Texture, Shape, and Size Parameters Compared With Traditional Survival Indicators Obtained From Locally Advanced Breast Cancer Patients. Invest Radiol 2016;58(3):177-185
5. Kim J-H, Ko ES, Lim Y, Lee KS, Han B-K, Ko EY, et al. Breast Cancer Heterogeneity: MR Imaging Texture Analysis and Survival Outcomes. Radiology 2017:282(3):665–675
6. Ahmed A, Gibbs P, Pickles M, Turnbull L. Texture analysis in assessment and prediction of chemotherapy response in breast cancer. J Magn Reson Imaging 2013;38:89–101.
Figures