1163
Radiomics of DCE-MRI to selectively down-stage the risk of breast cancers with a high-risk 70-gene signature1Image Sciences Institute, UMC Utrecht, Utrecht, Netherlands, 2Netherlands Cancer Institute - Antoni van Leeuwenhoek Hospital, Amsterdam, Netherlands
Synopsis
The 70-gene signature (70GS) is a prognostic marker for patient survival that is used to guide treatment decisions. For a dataset of early-stage breast cancer patients, the 70GS were established retrospectively. We investigated the potential of DCE-MRI to stratify patient survival within the high-risk 70GS group. Eigentumor analysis and 3D lesion texture features from washin and post-contrast images were compared in survival analysis and hazard ratios were computed. Results show that the investigated features are able to significantly stratify survival, and suggest that radiomics of DCE-MRI may have complementary value to the 70-gene signature to reduce overtreatment.
Introduction
The 70-gene signature (70GS) is a molecular assay, derived from tumor tissue, that predicts which breast cancer patients will have poor survival without chemotherapy, and which patients will have survival benefit from chemotherapy.1 Here we hypothesize that DCE-MRI complements the 70GS to identify patients at low risk of dying without systemic therapy. The aim of this study is to assess the potential of DCE breast MRI features to identify patients at low risk, from the group considered to be at high risk according to the 70GS.Methods
1.5 T pre-treatment non-fat-suppressed T1-weighted dynamic contrast-enhanced (DCE) MRI time series were available for early-stage breast cancer patients (N=563). Five series of images (one pre-contrast, four post-contrast) were acquired, 90 seconds apart, while a gadolinium-based contrast agent was administered. For a subset of patients, the 70GS was determined retrospectively2, dividing patients into high-risk and low-risk groups. The analyses in this study were applied to the high-risk 70GS group.
Using a previously reported method3, principal components of the MRI in and around the tumor were calculated (i.e. eigentumors). Probabilities of overall survival (OS)4 were calculated from these eigentumors and internally validated by bootstrapping. In addition, 14 three-dimensional Haralick texture features5, 6 were calculated from the first post-contrast series and from the washin series (i.e., first post-contrast series minus pre-contrast series divided by the pre-contrast series). For this purpose, a previously reported method for automated lesion segmentation was used.7
Patients at high risk according to the 70GS were stratified on eigentumors analysis (yielding probability of survival, dichotomized at 0.5 for low risk versus high risk) or on texture feature value (using the median feature value as threshold). Inverse probability weighting (IPW)8 was applied, thus correcting for potential confounders including patient age, lesion diameter, tumor grade, number of positive lymph nodes and systemic treatment received (yes/no). Missing values (histologic grade: n=3, immunohistological subtype: n=1) were imputed for the IPW. Survival analysis was performed using Cox regression to obtain hazard ratios, confidence intervals and two-sided p-values for all features, as well as Kaplan-Meier curve analysis. Subset analyses were done in the group of patients at high risk according to the 70GS, who did not receive systemic treatment.
Results
Retrospective 70GS could be derived for 277 patients, showing 163 patients with positive outcome, thus to be at increased risk of death. Systemic therapy was given to 101 (62%) of the high-risk patients. The median follow-up time was 85 months. Twenty-six overall survival events were recorded.
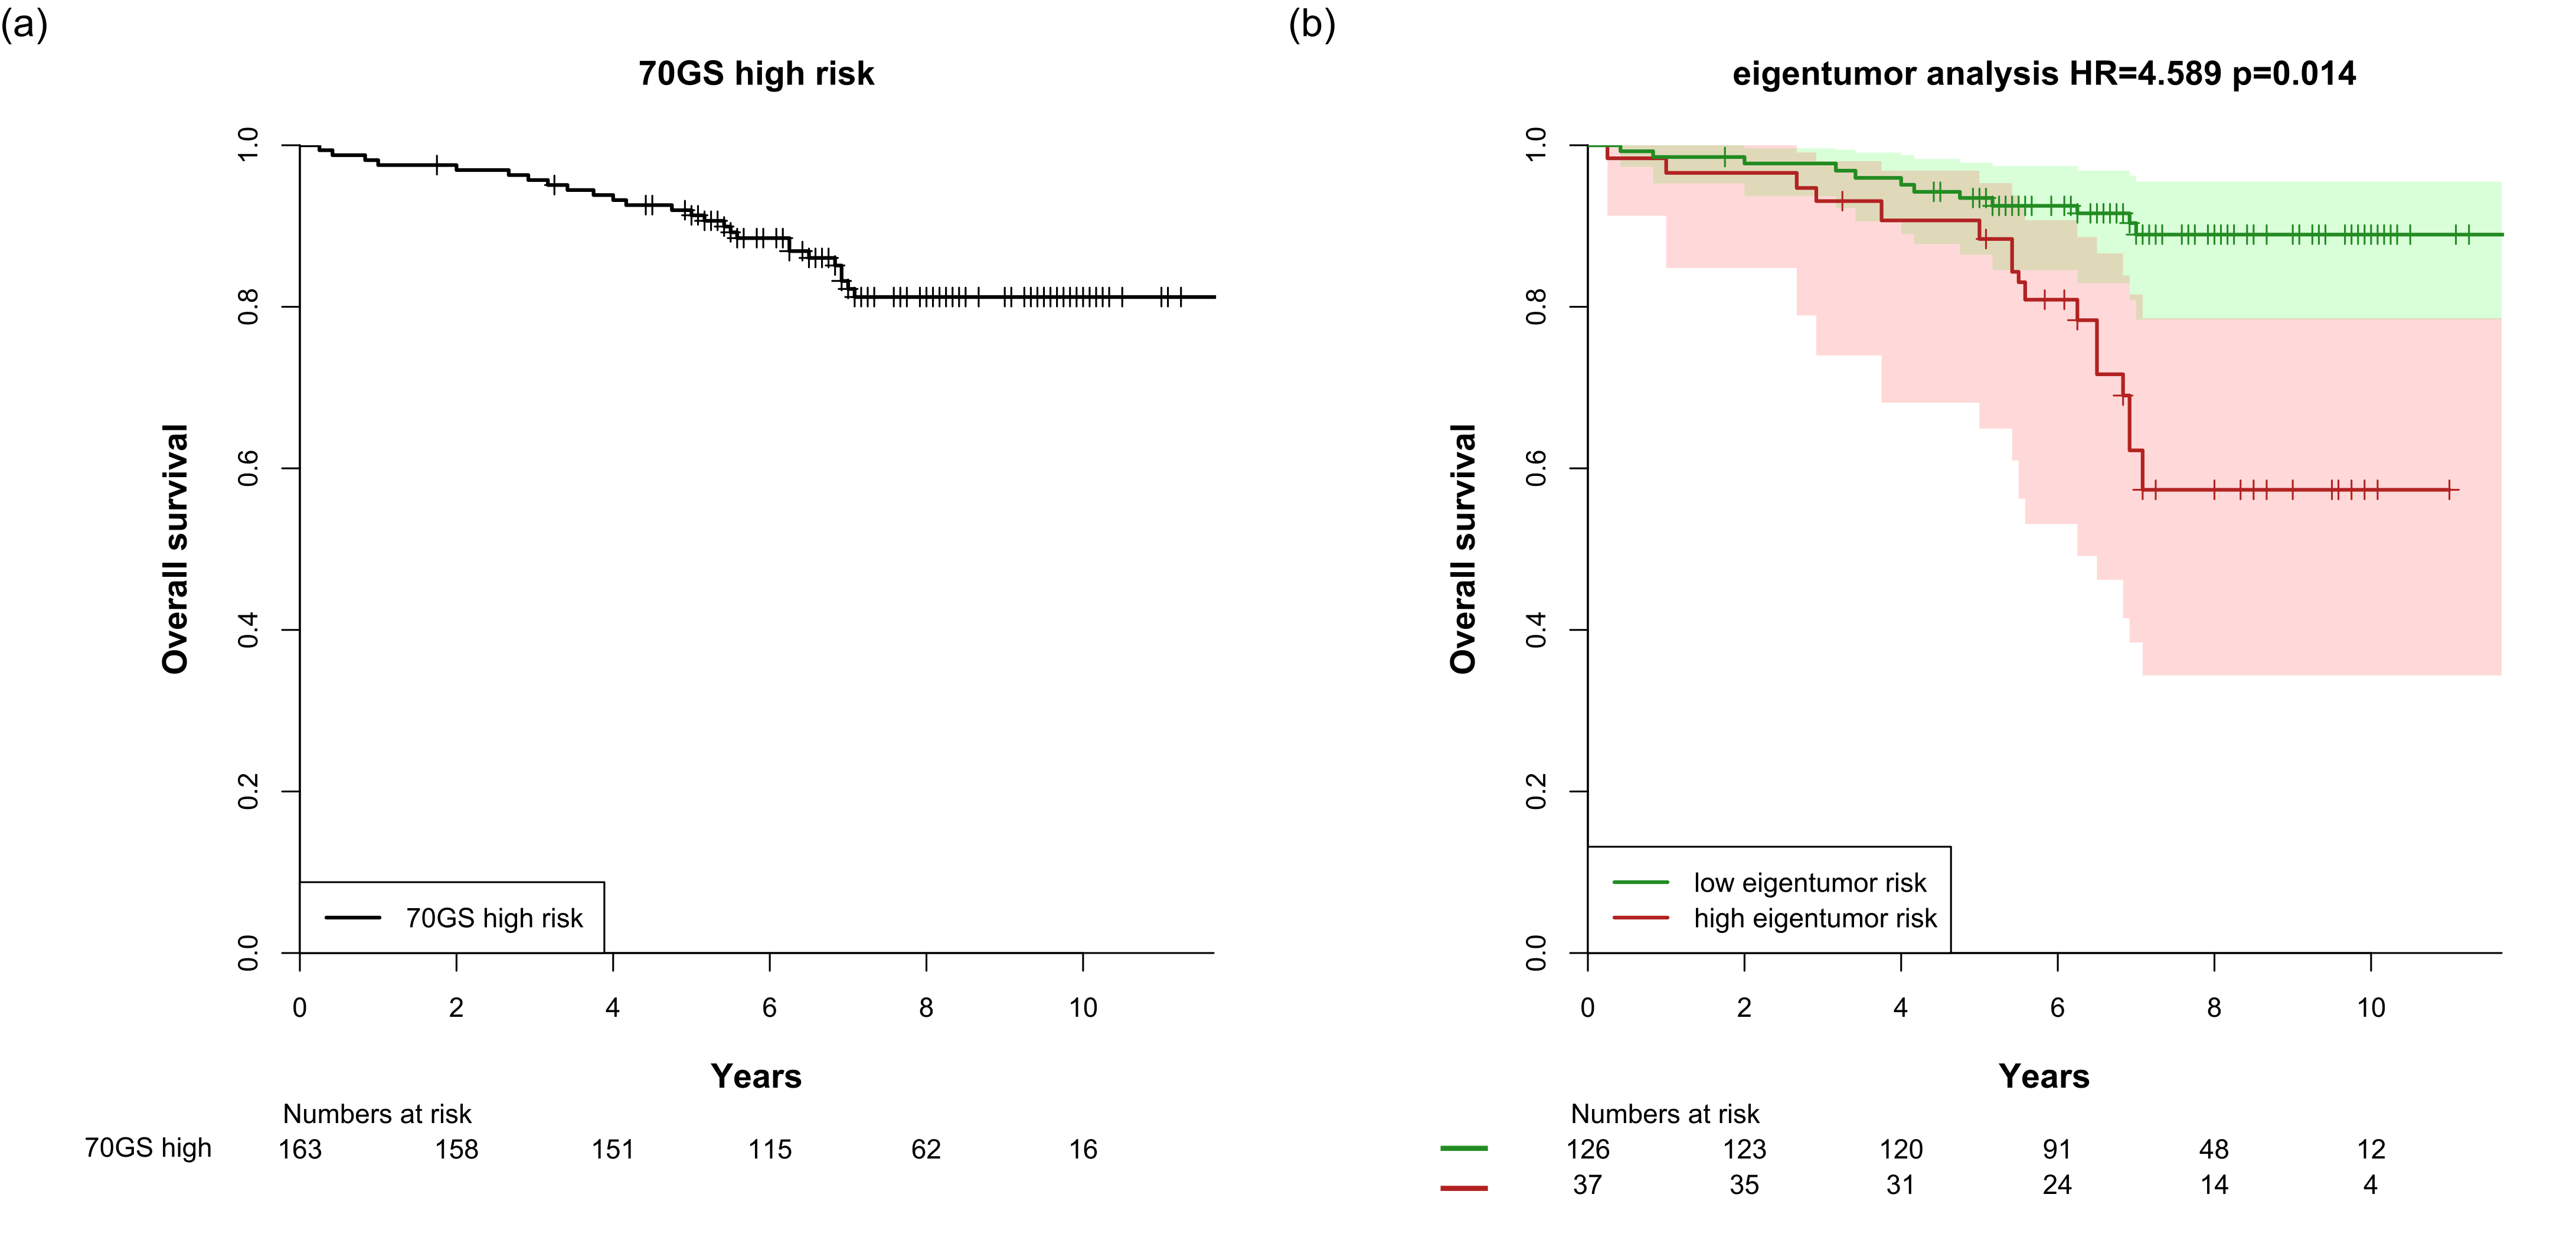
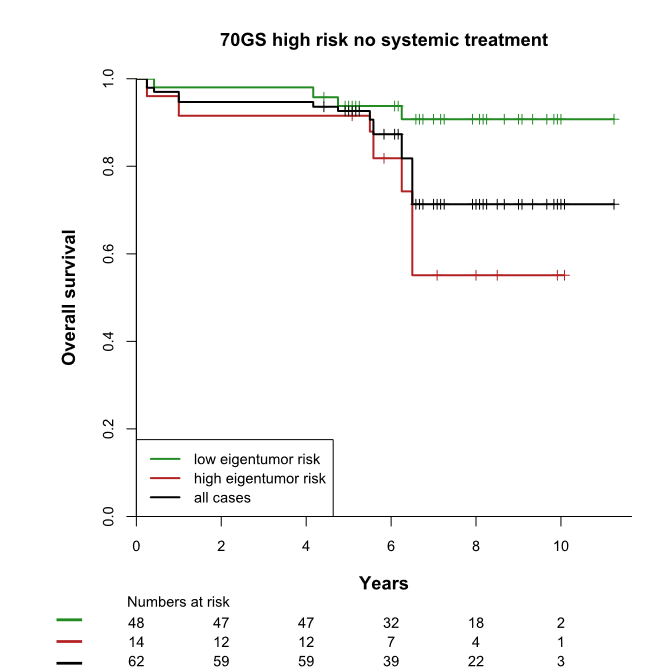
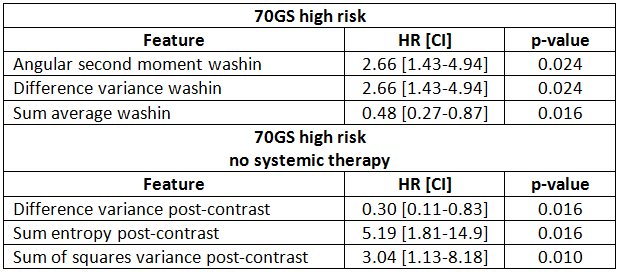
The high and low eigentumor risk groups contained 37 and 126 patients, respectively. Within these groups, 14/37 (38%) and 48/126 (38%) patients did not receive systemic therapy, respectively. Eigentumor analysis significantly stratified survival in the high-risk 70GS group: HR=4.59 [2.59-8.09], p=0.014 (Figure 1). This stratification was also observed for the subgroup that was not treated systemically (Figure 2). Several Haralick features also showed significant stratification for survival in both patient sets (Figure 3). Hazard ratios and p-values for the top-3 best performing Haralick texture features are tabulated in Table 1.
Discussion
Both eigentumor analysis and a number of Haralick texture features showed significant survival stratification in the 70GS high-risk group. Because all statistics were corrected for confounders, this stratification cannot be explained by differences in treatment received. In fact, approximately one third of the patients in the upper Kaplan-Meier curve did not receive systemic treatment, while they show excellent survival after 10 years of follow-up. These findings suggest that radiomics of DCE-MRI may down-stage the risk of patients with a high-risk breast cancer according to the 70GS, thus contributing to reduction of overtreatment. This exploratory finding needs to be validated in independent future studies.Conclusion
DCE-MRI based radiomics, such as eigentumor analysis and 3D lesion texture features, can potentially provide complementary value to the 70GS for predicting patient survival.Acknowledgements
This work is part of the research program IMDI with project number 104003019, which is (partly) financed by the Netherlands Organisation for Scientific Research (NWO).References
1. M. J. Van de Vijver, Y. D. He, L. J. Van 't Veer, H. Dai, A. A. M. Hart, D. W. Voskuil, G. J. Schreiber, J. L. Peterse, C. Roberts, M. J. Marton, M. Parrish, D. Atsma, A. T. Witteveen, A. Glas, Delahaye L., T. Van der Velde, H. Bartelink, S. Rodenhuis, E. J. Rutgers, S. H. Friend, and R. Bernards. A gene-expression signature as a predictor of survival in breast cancer. The New England Journal of Medicine. 2002; 347(25): 1999-2009.
2. B. H. M. van der Velden, S. G. Elias, T. Bismeijer, C. E. Loo, M. A. Viergever, L. F. A. Wessels, and K. G. A. Gilhuijs. Complementary value of contralateral parenchymal enhancement on DCE-MRI to prognostic models and molecular assays in high-risk ER+/HER2- breast cancer. Clin Cancer Res. 2017; 23(21): 6505-15.
3. H. M. Chan, B. H. M. van der Velden, C. E. Loo, and K. G. A. Gilhuijs. Eigentumors for prediction of treatment failure in patients with early-stage breast cancer using dynamic contrast-enhanced MRI: a feasibility study. Phys Med Biol. 2017; 62(16): 6467-85.
4. C. A. Hudis, W. E. Barlow, J. P. Costantino, R. J. Gray, K. I. Pritchard, J. A. W. Chapman, J. A. Sparano, S. Hunsberger, R. A. Enos, R. D. Gelber, and J. A. Zujewski. Proposal for standardized definitions for efficacy end points in adjuvant breast cancer trials: The STEEP system. Journal of Clinical Oncology. 2007; 25(15): 2127-32.
5. W. Chen, M. L. Giger, H. Li, U. Bick, and G. M. Newstead. Volumetric texture analysis of breast lesions on contrast-enhanced magnetic resonance images. Magn Reson Med. 2007; 58(3): 562-71.
6. R. M. Haralick, K. Shanmugam, and I. Dinstein. Textural features for image classification. Ieee Transactions on Systems Man and Cybernetics. 1973; Smc3(6): 610-21.
7. T. Alderliesten, A. Schlief, J. Peterse, C. Loo, H. Teertstra, S. Muller, and K. Gilhuijs. Validation of semiautomatic measurement of the extent of breast tumors using contrast-enhanced magnetic resonance imaging. Investigative Radiology. 2007; 42(1): 42-49.
8. P. C. Austin. An introduction to propensity score methods for reducing the effects of confounding in observational studies. Multivariate Behav Res. 2011; 46(3): 399-424.
Figures