1162
The Effect of Altered Glucose Utilization on Dynamic GlucoCEST in a Preclinical Model of Glioblastoma1Russell H. Morgan Department of Radiology and Radiological Science, Johns Hopkins University, Baltimore, MD, United States, 2F. M. Kirby Research Center for Functional Brain Imaging, Kennedy Krieger Research Institute, Baltimore, MD, United States, 3Radiology College, Guizhou Medical University, Guiyang, China, 4Department of Radiology, Guangdong Academy of Medical Sciences/Guangdong General Hospital, Guangzhou, China, 5Department of Medical Radiation Physics, Lund University, Lund, Sweden, 6Department of Ultrasound, Guangzhou Panyu Central Hospital, Guangdong, China, 7Division of Cancer Imaging Research, Johns Hopkins University School of Medicine, Baltimore, MD, United States, 8Department of Mechanical and Biomedical Engineering, City University of Hong Kong, Hong Kong, Hong Kong
Synopsis
To investigate the origin of glucoCEST contrast, we altered glucose utilization using an mTOR inhibitor (rapamycin) and studied dynamic glucoCEST signals in a human glioblastoma mouse model. By inhibiting glucose transport, cellular uptake and metabolism are suppressed and the perfusion of vessels and leakage into extravascular extracellular space highlighted. A great increase in glucoCEST contrast was seen in tumors in mice with the inhibitor compared to without. This provides evidence of a large extracellular glucose contribution to glucoCEST, and suggests that we can use glucoCEST to monitor the efficacy of rapamicin with respect to its inhibitory effect.
Purpose
D-glucose can be used as a biocompatible contrast agent for cancer detection by employing its hydroxyl protons as a natural label for chemical exchange saturation transfer (glucoCEST) (1-4) or spin Lock (glucoCESL) (5,6,7) GlucoCEST contrast can in principle originate from three different compartments: vascular space (v), extravascular extracellular space (EES) and intracellular space (c), with the latter containing mainly phosphorylated glucoses. We applied dynamic glucoCEST enhanced (DGE) imaging(3) to study the effect of altered glucose metabolism under the effect of rapamycin in a human brain tumor mouse model, with the purpose of identifying the compartmental contributions to glucoCEST contrast. This inhibitor is used for glucose deprivation treatment in brain tumors and is expected to affect the glucose utilization.Methods
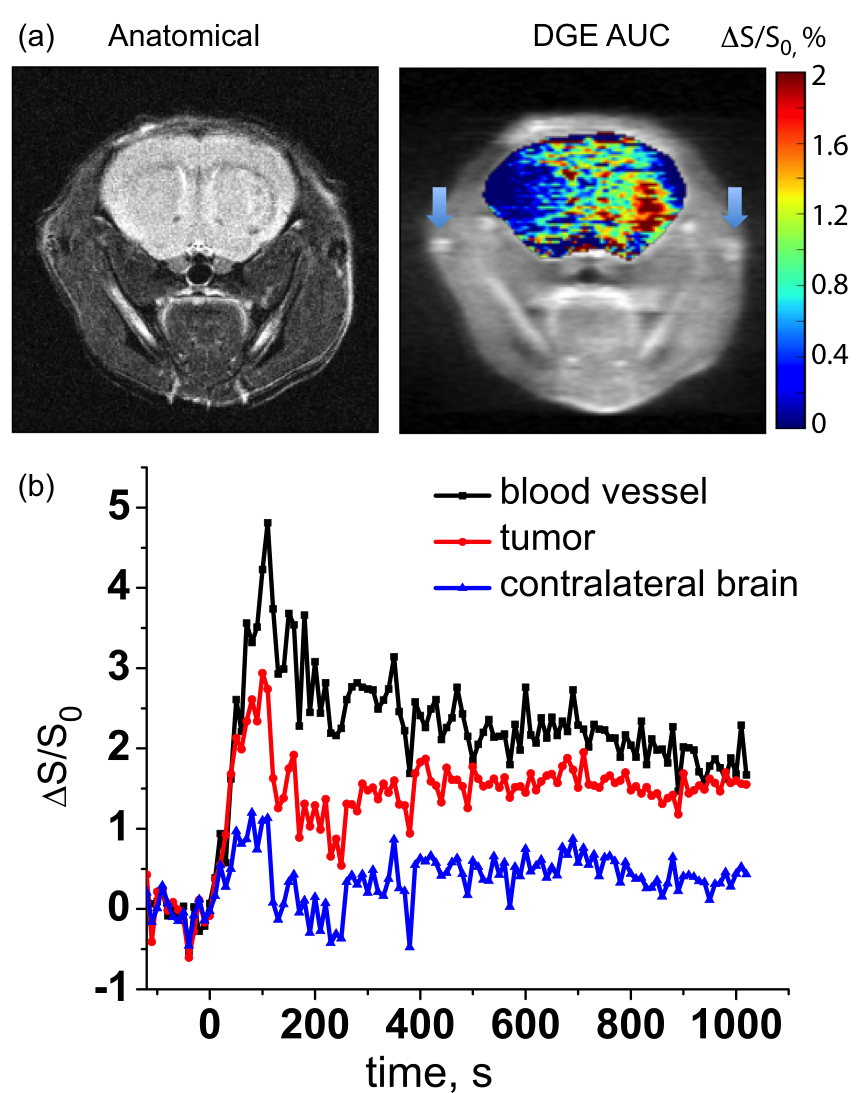
Animal preparation: Human U87-EGFRvIII glioma cells were implanted (0.5×10⁵ cells/μl) by stereotaxic injection into the right caudate/putamen of female SCID mice. Mice in the inhibitor group received intraperitoneal injection of the inhibitor (rapamycin, 3 mg/kg every other day for two days) prior to MRI (8, 9). CEST imaging: Mice were fasted overnight and anesthetized using isoflurane and positioned in an 11.7T horizontal bore Bruker Biospec scanner. DGE images were acquired at a single frequency of 1.2 ppm for the hydroxyl protons before, during and after glucose injection at a temporal resolution of 10 s for both the inhibitor (N=4) and no treatment group (N=4). 0.15 mL 50% w/w glucose was given over 60 s through the tail vein, leading to a prolonged increase in vascular glucose levels as verified by analyzing glucoCEST signal in the blood vessel. The DGE images were acquired over 20 minutes using a short-echo Rapid Acquisition with Relaxation Enhancement (RARE) sequence, TR/TE = 5.0 s/3.8 ms, RARE factor of 23, a matrix of 128x64 and a FOV of 1.6 cm2 (All images were normalized to an image without saturation acquired prior to injection). A single slice with 0.12 x 0.25 mm3 in plane resolution and thickness of 1 mm was imaged with fat suppression. Saturation was achieved by a single continuous wave magnetization transfer pre-pulse of 3 s at B1 = 1.6 μT. Data analysis: Area-under-curve (AUC) was calculated over 300 s post bolus injection to study the uptake and retention of glucose.Results and Discussion
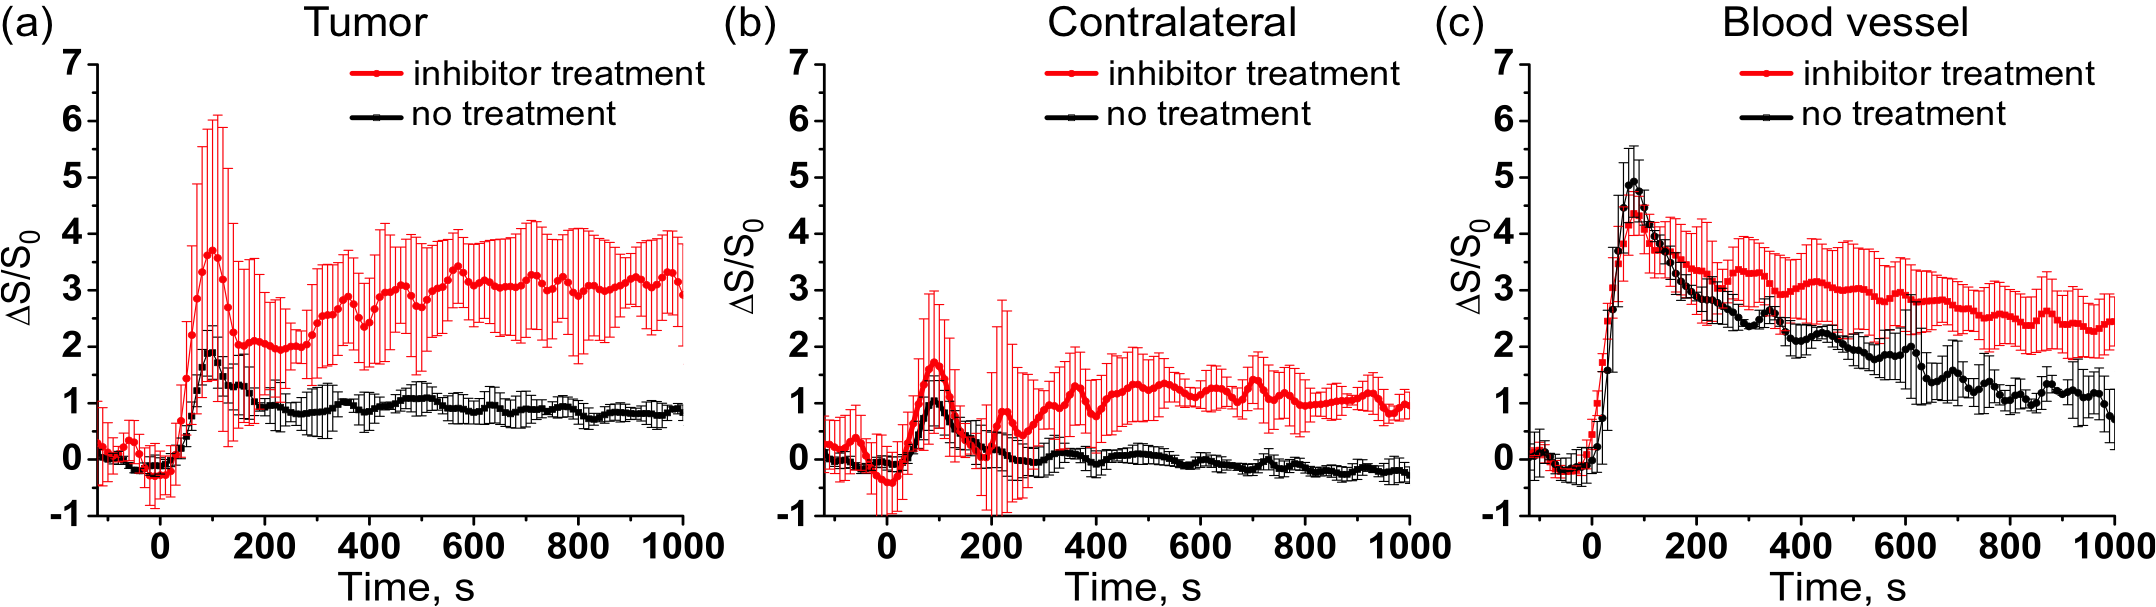
DGE contrast in the inhibitor group increased upon glucose injection and after an initial maximum reduced and stabilized with a similar pattern in the vessels, tumor and contralateral tissue (Fig. 1). DGE highlighted the tumor as shown in the AUC image in Fig. 1, in a pattern similar to previously reported for mice without treatment (3). Interestingly, the data in Figure 2 show that, for contralateral brain, the steady state DGE signal returned to the pre-injection level in the no-treatment group, while it remained high in the treatment group, namely on the order of magnitude (~1%) of the no-treatment tumor contrast. The tumor DGE contrast persisted during the total measurement period in both the no-treatment and inhibitor-treatment group. The inhibitor effect is observable in the tumor, contralateral brain and blood vessel (Fig. 2). The glucose enhancement under the inhibitor effect is the more pronounced in the tumor. An increase of 3.7%± 2.3% at maximum is observed compared to the contralateral brain where it is 1.7% ±1.3% at maximum. Interestingly, the glucoCEST signal in the blood vessel was higher in the inhibitor treatment group, which suggests a global reduction in glucose utilization under the inhibitor treatment. When considering the three compartments, i.e. v, EES and c, the signal difference between the two groups should be contributed to a consistent increase in the vasculature (as confirmed by contralateral brain) and the absence of cellular transport followed by tumor metabolism. Since the glucose transport into the cells was reduced in the inhibitor group, the observed glucoCEST signal was greater. For aggressive tumors such as human U87 glioma, the observed high glucoCEST contrast in the tumor can be attributed to the acidic EES together with some contribution of increased vascular compartment due to angiogenesis.Conclusion
The DGE imaging approach enables the study of uptake and retention of glucose in tumors. Comparing two groups of mice implanted with human brain tumors treated with and without the inhibitor to alter the glucose utilization for treatment, a great difference in glucoCEST contrast is seen. The stronger signal observed in the inhibitor group provides evidence that a large part of glucoCEST signal originates from the EES and blood vessels. In addition, it can be concluded that DGE MRI can be applied to monitor the inhibitor treatment efficacy with respect to drug delivery.Acknowledgements
Grant support: 1R21EB018934 and R01EB019934References
1. Chan KW, et al. Magn Reson Med. 2012; 68(6):1764-73.
2. Walker-Samuel S, et al. Nat Med. 2013; 19(8):1067-72.
3. Xu X, Chan KW, et al. Magn Reson Med. 2015; 74(6):1556-63.
4. Xu X, et al. Tomography. 2015; 1(2):105-14.
5. Jin T, Mehrens H, Hendrich KS, Kim SG. J. Cereb. Blood Flow and Metab. 2014;34(8):1402-1410. 6. Zu Z, Spear J, Li H, Xu J, Gore JC. Magn. Reson Imag. 2014;32(9):1078-1084.
7. Paech D, et al. Radiology 2017 Jun 16:162351. doi: 10.1148/radiol.2017162351
8. Cloughesy TF, et al. PLoS Med. 2008; 5(1):e8. doi:10.1371/journal.pmed.0050008
9. Wei LH, et al. 2008; 14(11):3416-26. doi:10.1158/1078-0432.ccr-07-1824
Figures