1159
Tracking the evolution of individual prostate cancer metastases in patients under the selective pressure of Radium-223 treatment using whole-body radiomics.1Division of Radiotherapy and Imaging, The Institute of Cancer Research, London, United Kingdom, 2MRI Unit, The Royal Marsden NHS Foundation Trust, London, United Kingdom, 3Urology Department, The Royal Marsden NHS Foundation Trust, London, United Kingdom
Synopsis
Whole-Body Diffusion-Weighted-MRI is emerging as an imaging response biomarker in metastatic bone disease. Tumour heterogeneity resulting in differential response to therapy is a well-recognized phenomenon. We propose that calculating radiomic features from the apparent diffusion coefficients within individual lesions can identify differential response patterns in whole-body bone disease. Robust statistical assessment of radiomic features based on repeatability assessment aids identification of significant changes.
Background
Bone metastases occur in more than 80% of patients with metastatic castration-resistant prostate cancer (mCRPC) and are associated with significant morbidity. Radium-223, an alpha-emitting radiopharmaceutical, has been shown to prolong overall survival (OS), delay symptomatic skeletal events, and improve quality of life in mCRPC patients1. Monitoring Radium-223 therapeutic efficacy however is challenging as no biomarker for response assessment yet exists for metastatic bone disease. Whole-Body Diffusion-Weighted MRI (WBDWI) has shown potential as a biomarker of disease response via calculation of Apparent Diffusion Coefficient (ADC) maps. Conventional quantitative analyses of WBDWI typically rely on a handful of first-order ADC summary statistics (e.g. mean, median, variance) and conventional shape characteristics (e.g. volume and maximal tumour diameter) calculated over all metastases2 or within a number of target lesions3,4. Such global metrics may fail to capture the inter- and intra-lesion response heterogeneity that has previously been reported for Radium-2235. Moreover, relying on a small subset of summary statistics from the ADC distribution may lower sensitivity to treatment effectsPurpose
In this work, we study the correlation and repeatability of Radiomic features6,7 calculated from ADC values within spatially distinct bone metastases in patients with mCRPC. We identify a subset of uncorrelated and repeatable features that may be used to investigate differential response of bone metastases to Radium-223 treatment.Materials and Methods
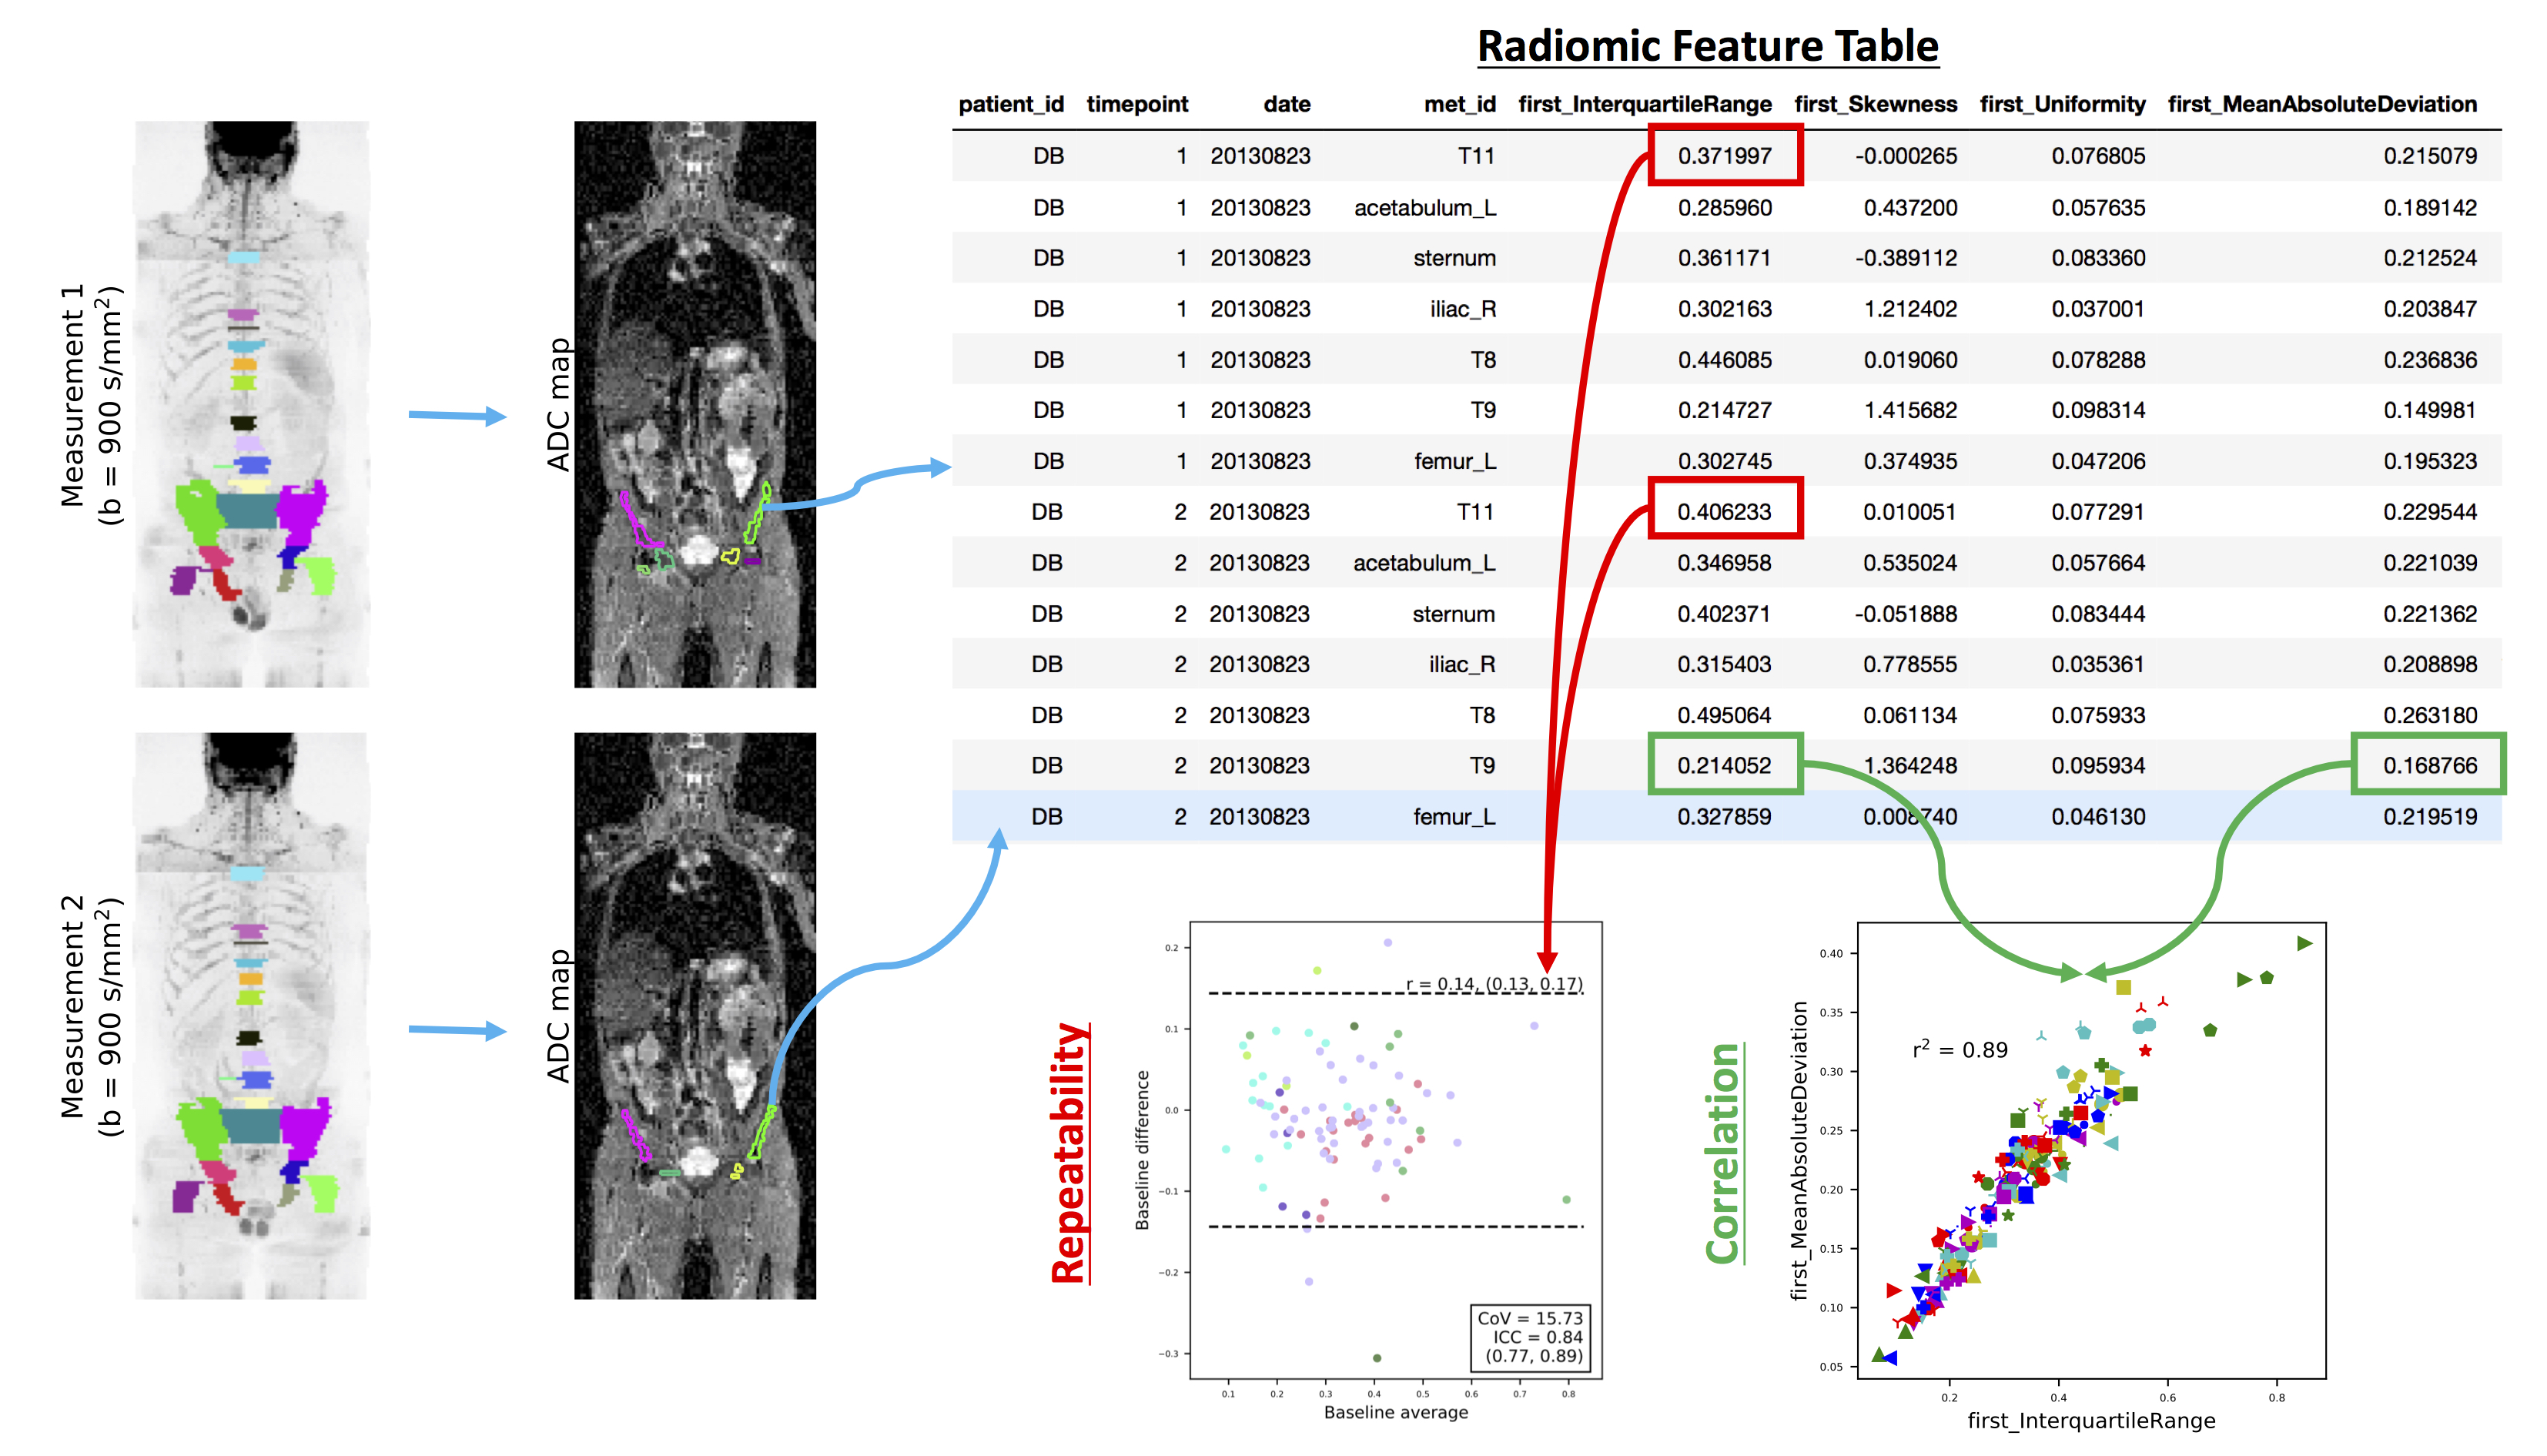
Repeatability Cohort: Seven patients with mCRPC received two baseline WBDWI scans (six received both on the same day, one received them twelve days apart). A radiologist with 8 years of experience in reporting WBDWI delineated volumes-of-interest (VOIs) around bone metastases on both baseline scans at least two weeks apart; these VOIs were transferred onto ADC maps (calculated from data acquired with b-values of 50 and 900 s/mm2). Radiomic features were calculated for the ADC values within each of the VOIs using the pyradiomics toolbox8: the Pearson correlation (r2) between each pair of features was calculated, and repeatability (R) and intra-class correlation (ICC) coefficients were calculated from the repeat baseline data (Figure 1). Hierarchical clustering was used to group features that demonstrated an average Pearson correlation of r2 > 0.49 between all features in the group. For repeatability assessments, features were computed at 7 resolutions using 2D stationary wavelet decomposition (coiflet-1 wavelet)6. A total of 113 features were considered consisting of the following groups: (i) first-order summary statistics (N=19), (ii) shape features (N=16), and (iii) texture features (N=78). ADC maps were histogram-equalised prior to texture feature calculation to render them insensitive to underlying ADC values.
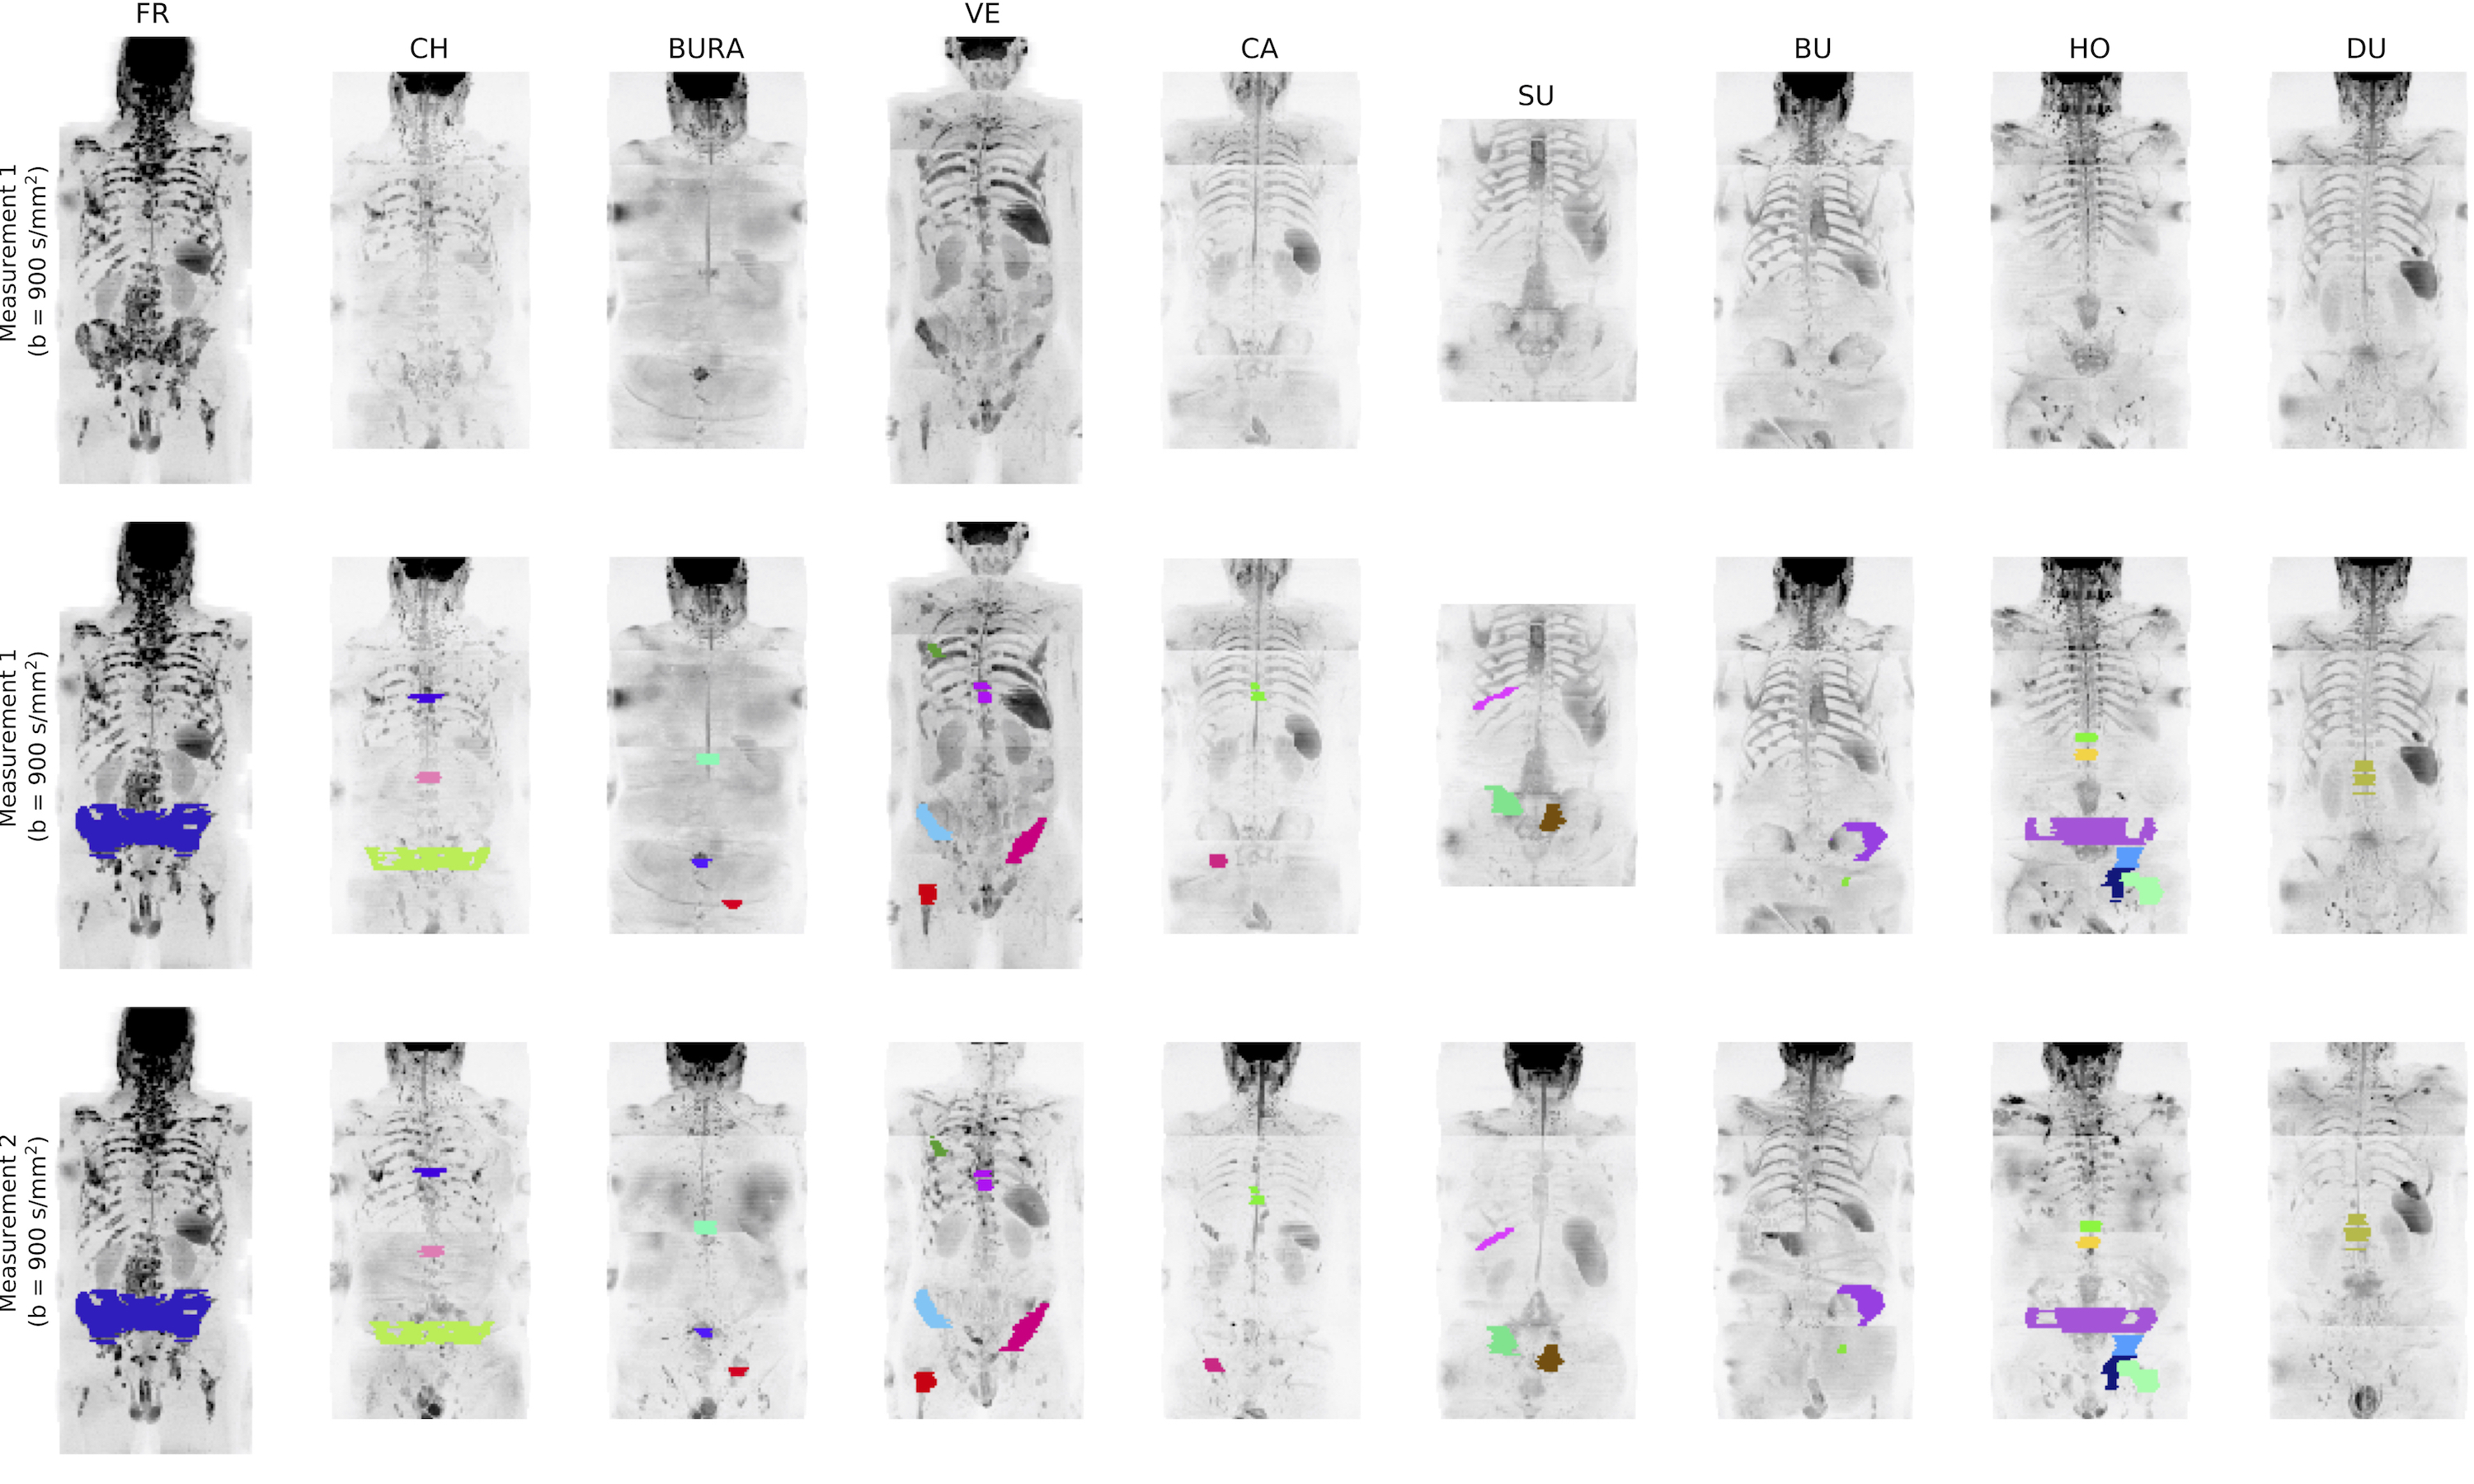
Radium-223 Cohort: Eleven patients (Figure 2) who received Radium-223 as part of the patient access programme had baseline WBDW-MRI performed a maximum of 2 months after initiation of therapy, and then received a post-treatment, follow-up WB-DWI examination after administration of a minimum of 2 cycles of Radium. The same radiologist delineated volumes of metastatic bone disease before and after treatment. Radiomic features were identified to be (i) significantly decreasing, (ii) stable, or (iii) significantly increasing, as define by the repeatability coefficients provided by the repeatability cohort.
Results
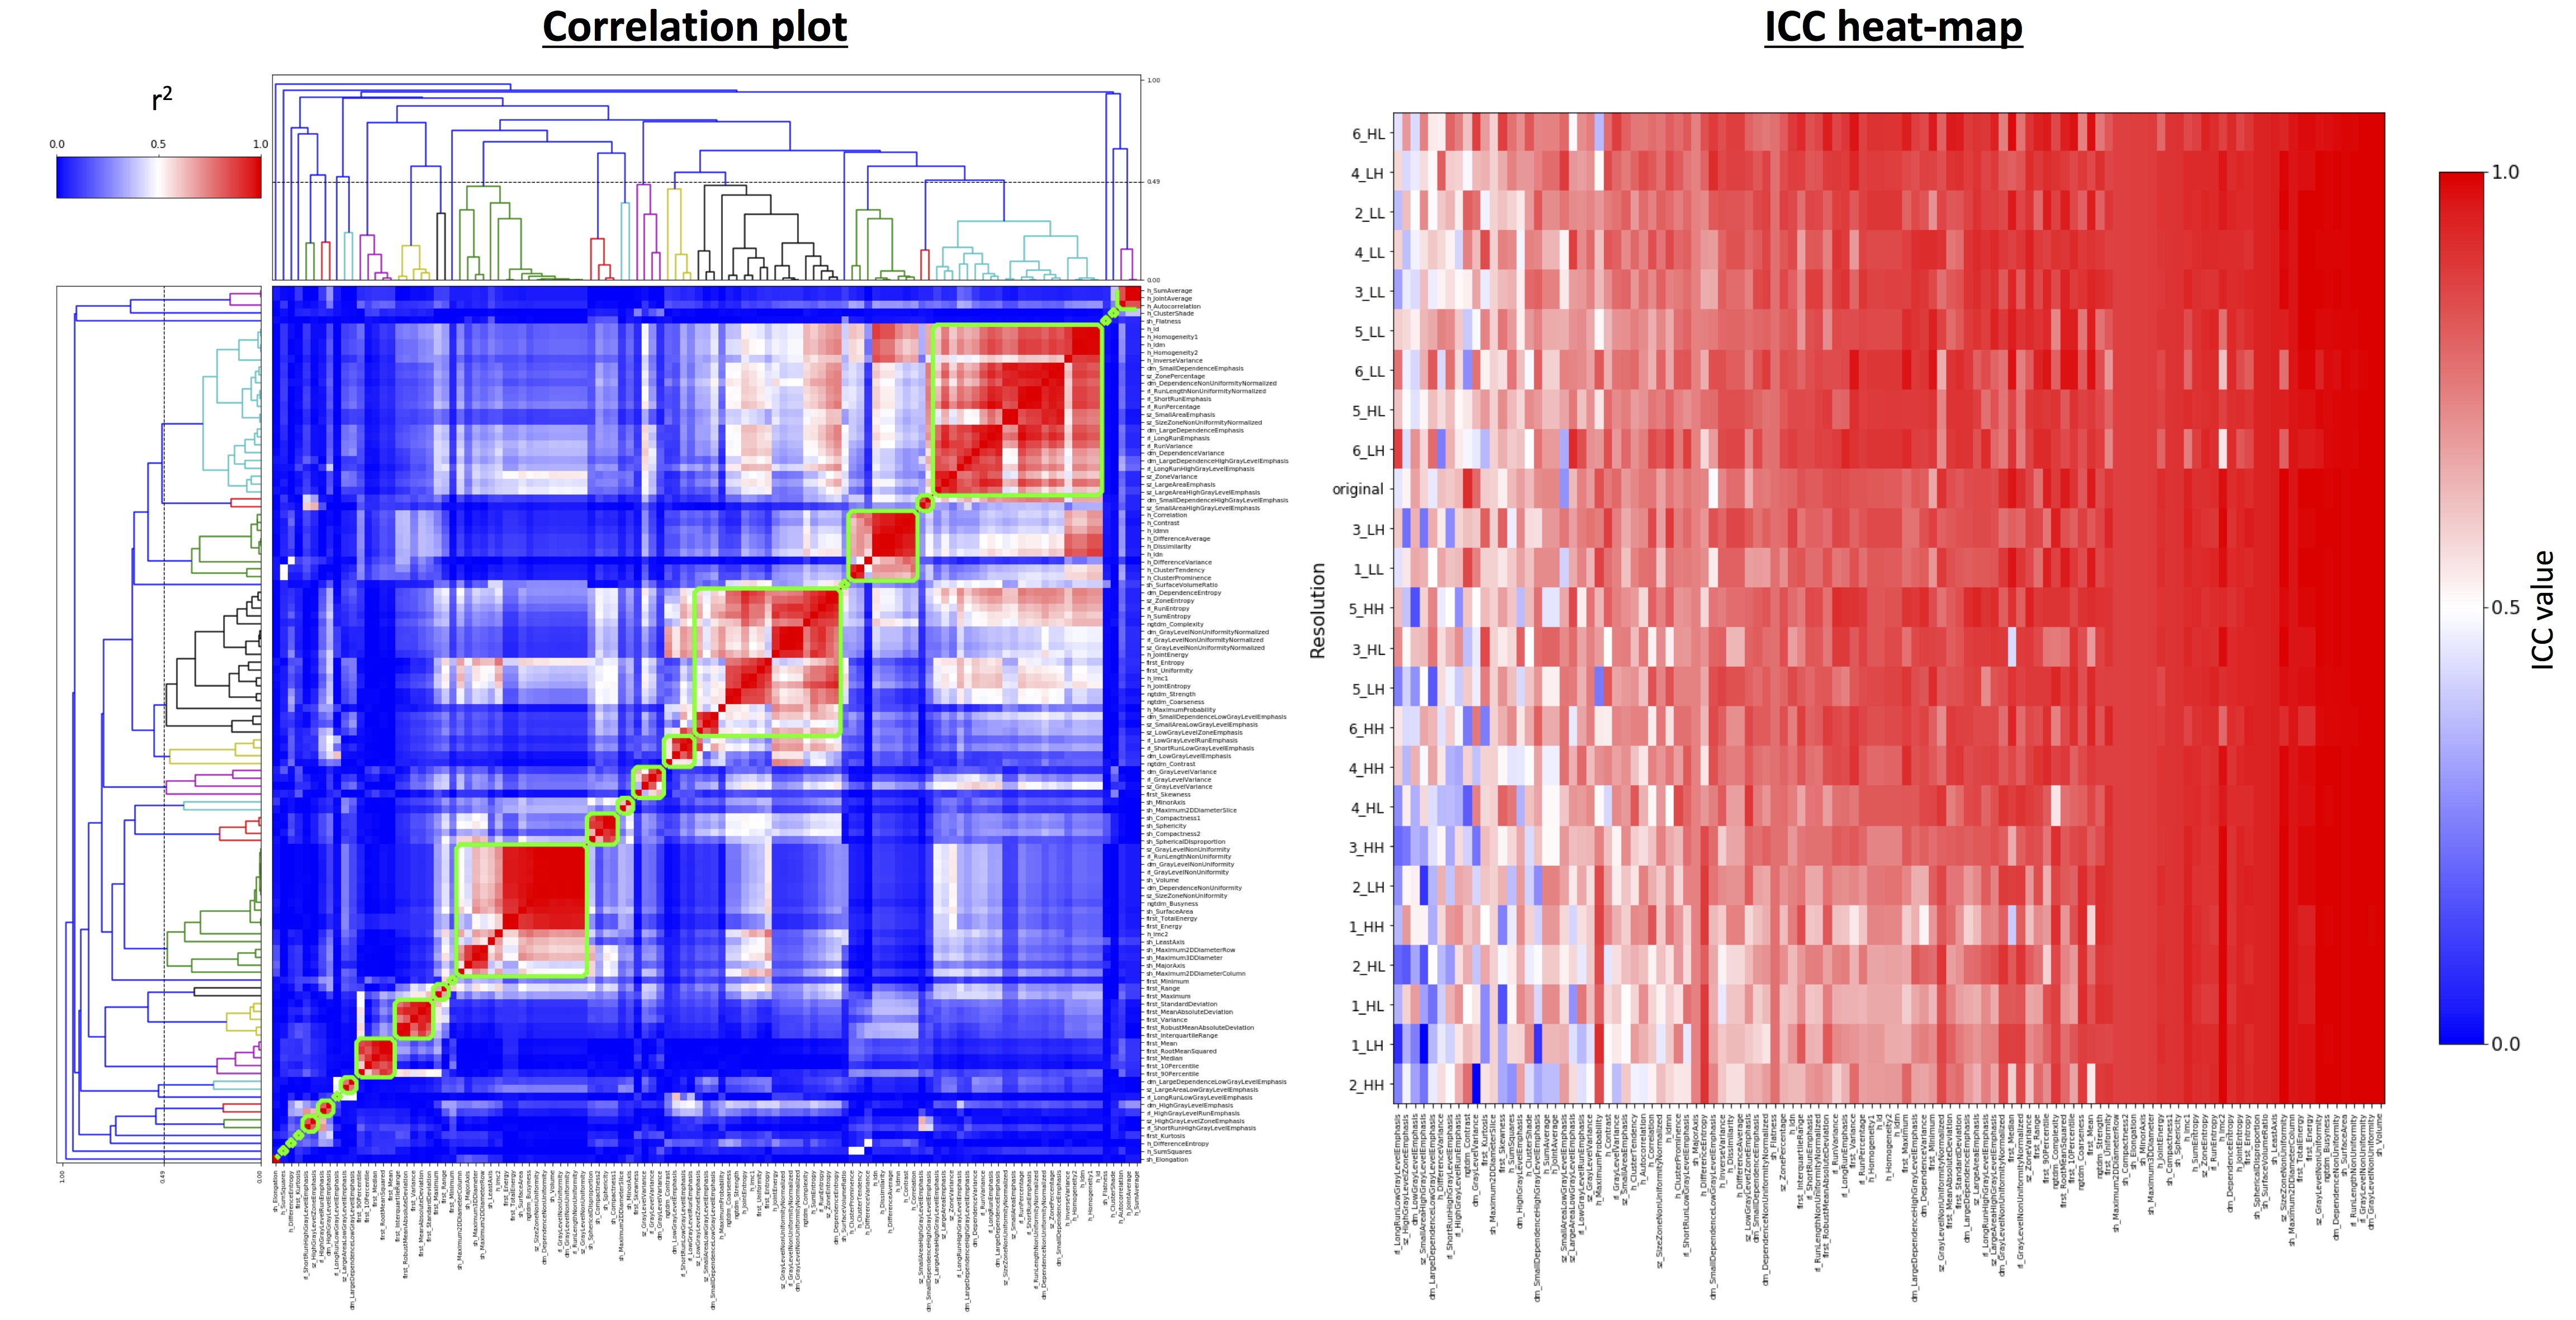
Repeatability Analysis: Figure 3 demonstrates heat-maps of correlations between radiomic features (left) and ICC values computed for all features at all resolutions (right). Hierarchical clustering of features revealed that there were 25 groups of features that could be considered independent. The feature that demonstrated highest mean ICC value across all resolutions was chosen to represent its associated group, and of these features only those with ICC > 0.7 (17/25) were considered for further analysis.
Radium-223 Analysis: Figure 4 demonstrates the changes occurring for each lesion in the cohort for all 17 representative radiomic features identified from the repeatability cohort. From the divergent changes following treatment it is clear that differential response can be observed between metastases. This methodology also allows exploration of the predictive power of features for post-treatment changes as explored in Figure 5.
Discussion
This preliminary investigation reveals good repeatability of inter-lesional radiomic ADC features from WBDWI. Assessment of repeatability also provides justification for choosing relevant features for post-treatment follow-up. Textural features demonstrated utility within this cohort, which may indicate how ADC heterogeneity within single lesions (intra-lesional heterogeneity) changes following therapy, and features were found to demonstrate some predictive capabilities, although this would need to be confirmed in much larger patient cohorts. Methods such as those studied here may provide a potent clinical biomarker for stratification of patients who demonstrate mixed response to therapy. By detecting lesions that are not responding to treatment it may be possible to guide innovative combination therapies and evaluate their impact.Acknowledgements
CRUK and EPSRC support to the Cancer Imaging Centre at ICR and RMH in association with MRC and Department of Health C1060/A10334, C1060/A16464 and NHS funding to the NIHR Biomedical Research Centre and the Clinical Research Facility in ImagingReferences
1. Parker C. et al., New England Journal of Medicine 2013; 369:213–223.
2. Blackledge MD et al., PLoS One. 2014 Apr 7;9(4):e91779
3. Perez-Lopez R et al., Radiology 2017; 283(1):168-177
4. Padhani AR et al., European Urology 2017; 71(1):81-92
5. Blackledge MD et al., ISMRM 2017
6. Aerts HJWL et al., Nature Communications 2014; 5:4006
7. Lerski RA et al., Magnetic resonance Imaging 1993; 11:873-887
8. van Griethuysen JJM et al., Cancer Research 2017, 77(21):e104-e107
Figures