1157
Investigating Oxygen Sensitive MRI to Provide Prognostic Biomarkers for Tumor Radiation Response1Radiology, University of Texas Southwestern Medical Center, Dallas, TX, United States, 2Radiation Oncology, University of Texas Southwestern Medical Center, Dallas, TX, United States
Synopsis
Prognostic imaging biomarkers to assess tumor hypoxia remain a Holy Grail. We present evidence that T1-weighted signal response to an oxygen breathing challenge before a single high dose of radiation is related to long term tumor control. Specifically, Dunning prostate R3327-AT1 tumors showing a small signal response showed poor control for relatively lower doses (30-50 Gy). Meanwhile, higher doses overcame the radio resistance, which we associate with hypoxia. A large BOLD response (ΔR2*) was associated with poor outcome irrespective of radiation dose. These results provide further evidence for the potential utility of oxygen sensitive MRI in guiding radiation therapy.
Introduction
It is widely recognized that hypoxia is associated with radiation resistance (1). This is expected to be particularly relevant to hypofractionated radiation therapy approaches such as SABR/SBRT, but there is currently no accepted non-invasive procedure for identifying tumor hypoxia in the clinic. Correlations have been shown using exogenous reporters for 19F MRI (hexafluorobenzene) and ESR (India ink) to measure pO2 in rat tumors and predict tumor growth delay (2,3). Non-invasive methods would be more practical and both Blood Oxygen Level Dependent (BOLD) and Tissue Oxygen Level Dependent (TOLD) are attractive approaches (4,5). Notably, TOLD responses have been related to pO2 (6,7), but to date few studies have explored prognostic relevance with respect to radiation response. Notably, Cao-Pham et al. reported correlations between R2* and tumor growth delay in 9L-glioma but not rhabdomyosarcomas in rats with respect to radiation (8). Rodrigues et al. reported tumor growth delay associated with radiation in GH3 prolactinomas, but not Rif-1 tumors was correlated with pre-treatment R2* response to carbogen breathing challenge. Meanwhile, Hallac et al. found that Dunning prostate R3327-AT1 tumors showing a larger TOLD response to an oxygen breathing challenge before radiation exhibited a longer tumor growth delay following 30 Gy radiation when accompanied by oxygen breathing (9). We hypothesized that application of greater radiation dose could overcome hypoxia and we have now explored the utility of BOLD and TOLD MRI to predict tumor control.METHODS
Tumor model: Dunning prostate R3327-AT1 tumors were implanted subcutaneously in the thigh of adult male Copenhagen rats and allowed to grow to about 0.25 cm3. Anesthetized rats were exposed to an oxygen breathing challenge and BOLD (multi-gradient-echo) and TOLD (T1-weighted gradient-echo) MRI at 4.7 T to examine signal response on the day before irradiation. Tumors were stratified based on median BOLD and TOLD responses respectively.
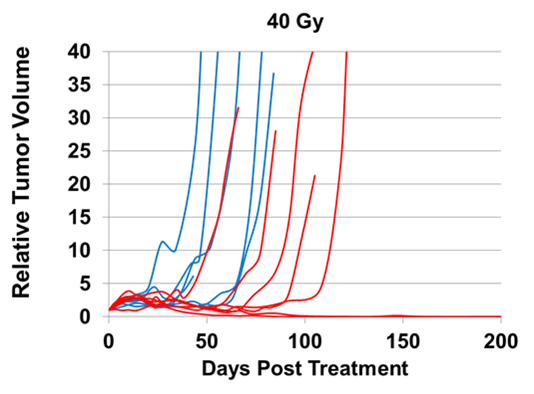
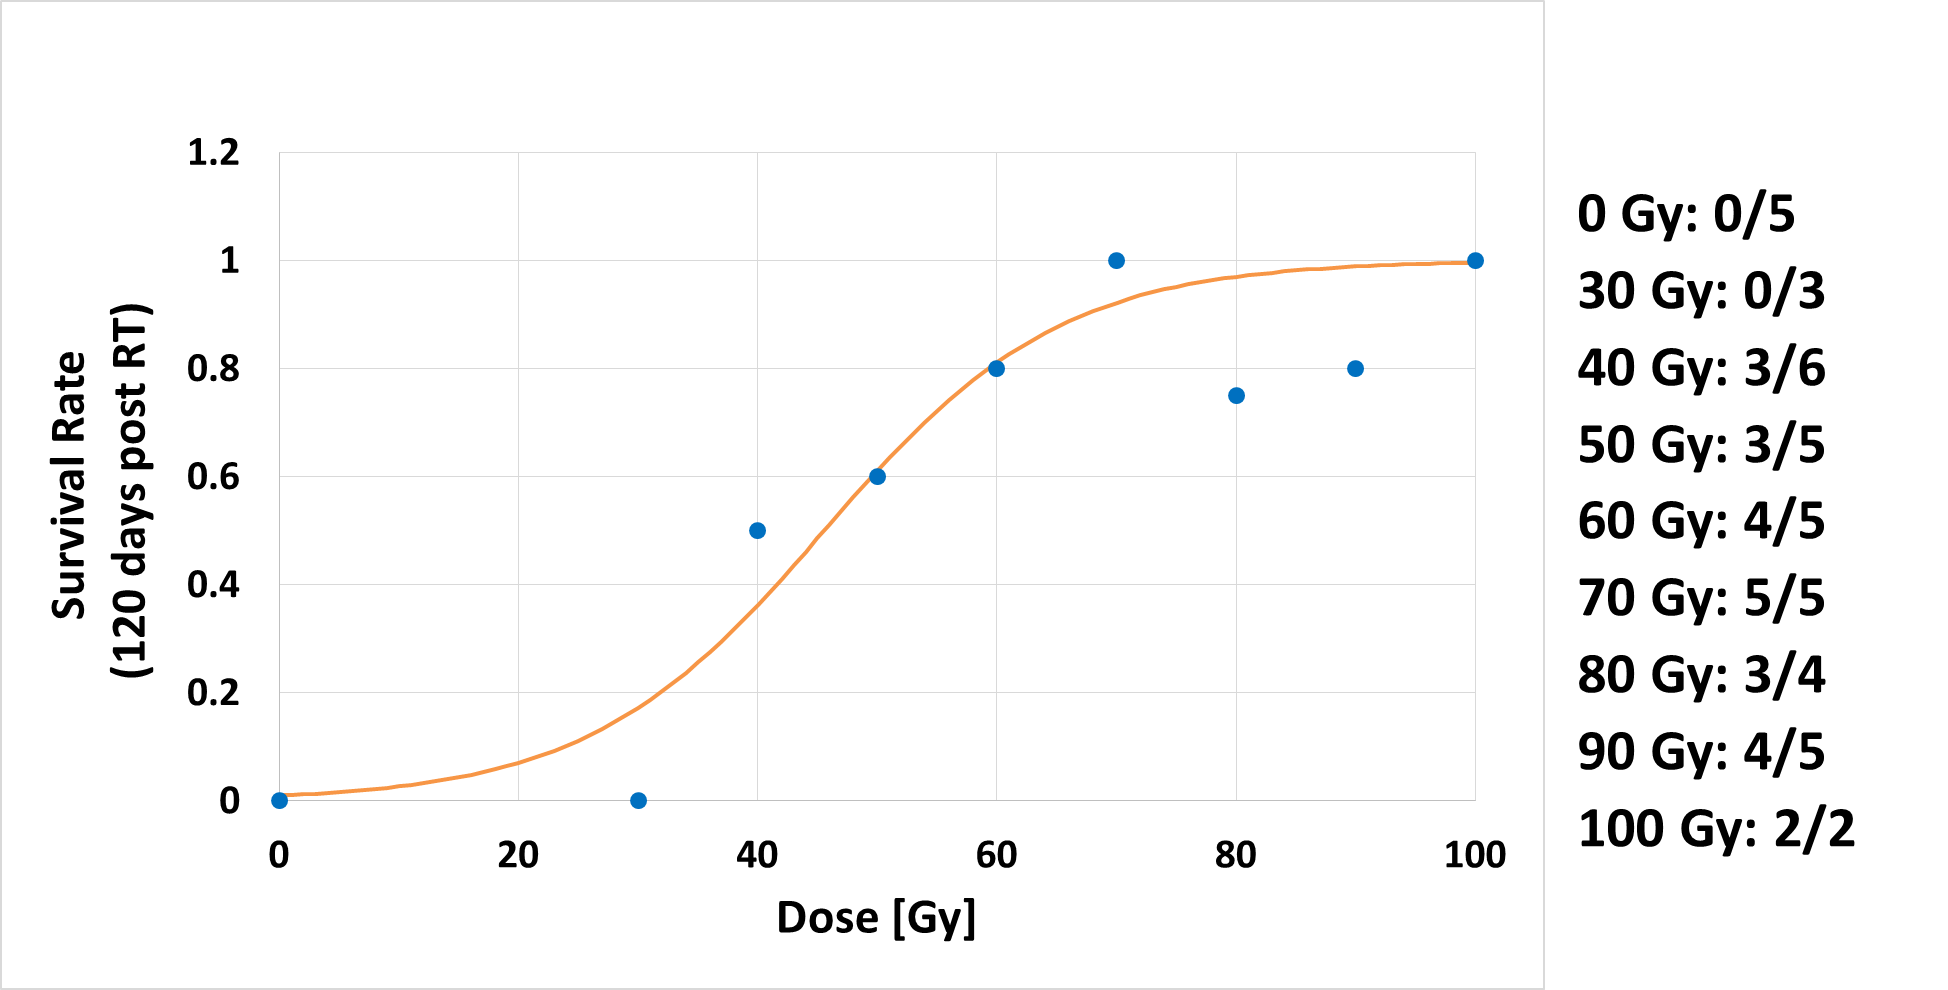
Radiation Treatment: Tumors were irradiated with a single dose (ranging from 30 to 100 Gy) using a small animal X-ray irradiator (XRAD 225Cx, Precision X-ray), while anesthetized rats breathed air or oxygen. Tumors on oxygen breathing rats received 0 (n=5), 30 (n=3), 40 (n=6), 50 (n=5), 60 (n=5), 70 (n=5), 80 (n=4), 90 (n=5), and 100 Gy (n=2), respectively. Following irradiation, tumor volume was monitored by calipers with an end point of progression requiring humane sacrifice or 200 days with local control
RESULTS AND DISCUSSION
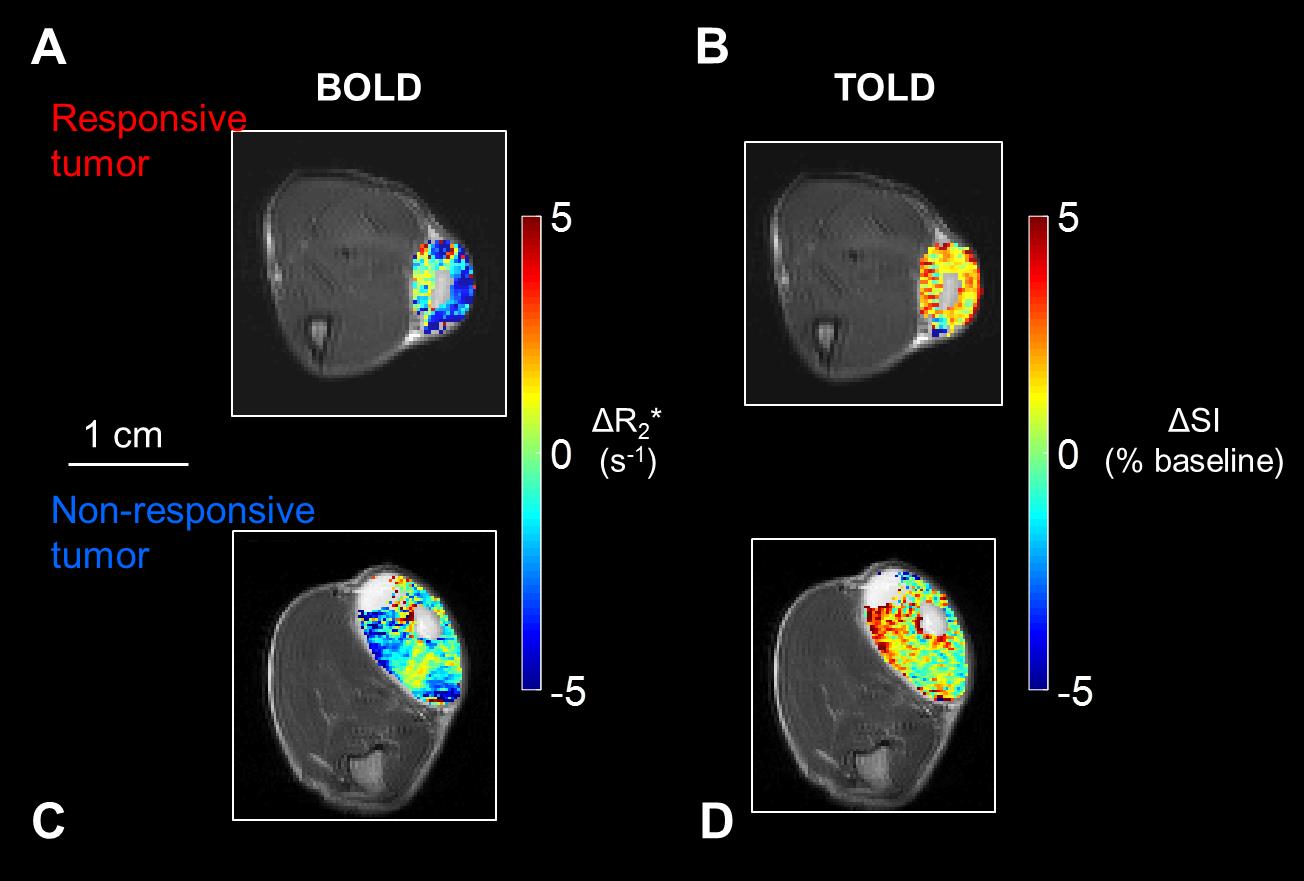
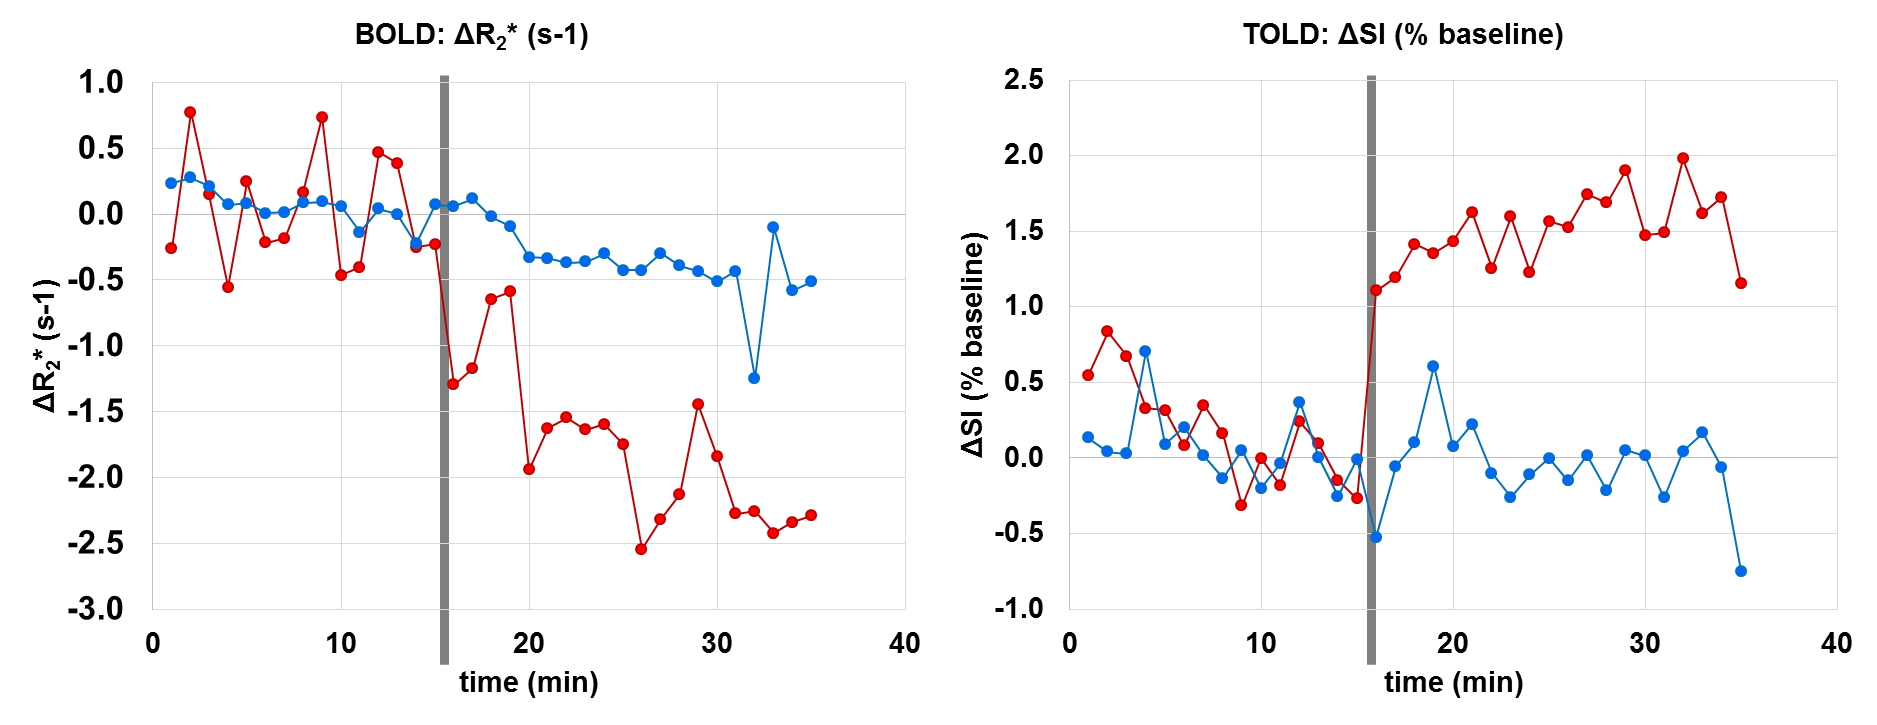
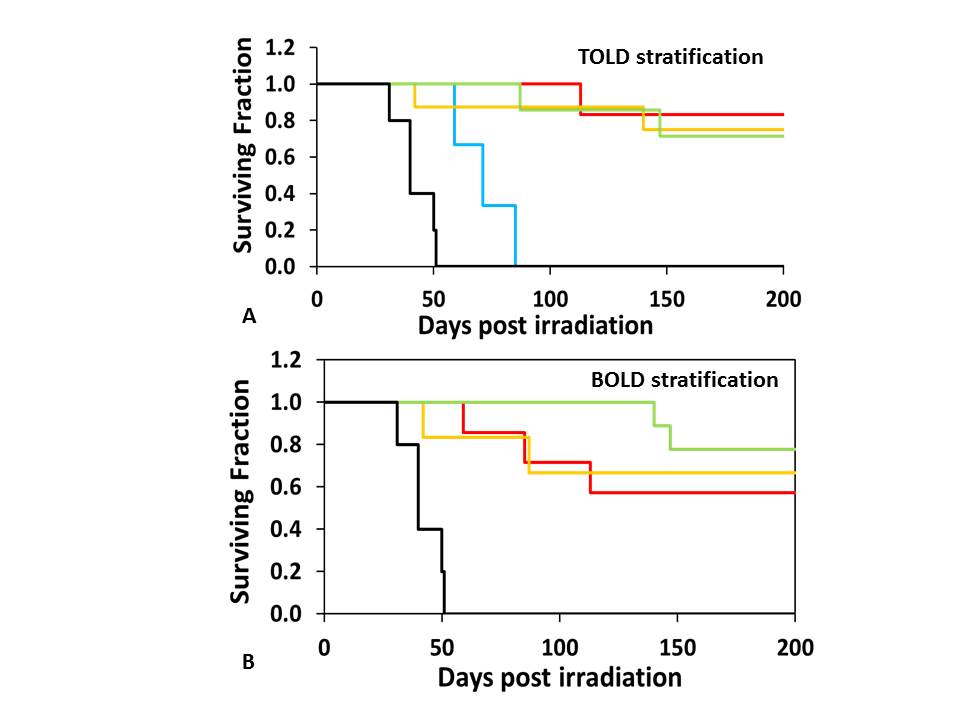
Both BOLD and TOLD MRI showed a range of distinctly heterogeneous response to an oxygen breathing challenge (Figure 1). Some tumors showed significant changes in oxygen-sensitive MR parameters, while others were essentially unresponsive (Figure 2). In general, breathing oxygen during radiation enhanced tumor growth delay, but there was some overlap (Figure 3). Broadly, higher dose generated better control and TCD50 was determined to be about 45.5 Gy for tumors in the oxygen group (Figure 4). Intriguingly, tumors showing a small TOLD response and receiving relatively low dose (30-50 Gy) showed poor control (mean survival of 72 days), while those showing a high TOLD response did much better (mean survival 186 days) (Figure 5a). By contrast tumors receiving higher doses showed good control, irrespective of TOLD response. Intriguingly, tumors exhibiting a significant R2* response to the O2-breathing challenge did less well irrespective of radiation dose (Figure 5b).CONCLUSION
TOLD response to an oxygen breathing challenge provided a non-invasive prognostic imaging biomarker for radiation induced tumor control. The results confirmed the R3327-AT1 tumor to be particularly radiation resistant (10), and indicate that increased radiation dose overcomes hypoxia, identified by the TOLD response. BOLD response also provided prognostic insights to stratify tumors with respect to local control, but was not associated with enhanced response with radiation boost.Acknowledgements
Supported in part by RP140285; P41 EB015908, 1P30 CA142543, 1U24 CA126608 and S10 RR028011.References
1. Gallez B, Neveu MA, Danhier P, Jordan BF. Manipulation of tumor oxygenation and radiosensitivity through modification of cell respiration. A critical review of approaches and imaging biomarkers for therapeutic guidance. Biochimica Et Biophysica Acta-Bioenergetics 2017;1858(8):700-711.
2. Bourke VA, Zhao D, Gilio J, et al. Correlation of Radiation Response with Tumor Oxygenation in the Dunning Prostate R3327-AT1 Tumor. Int J Radiat Oncol Biol Phys 2007;67(4):1179-1186.
3. O'Hara JA, Goda F, Demidenko E, Swartz HM. Effect on regrowth delay in a murine tumor of scheduling split-dose irradiation based on direct pO2 measurements by electron paramagnetic resonance oximetry. Radiat Res 1998;150:549-556.
4. O'Connor JPB, Boult JKR, Jamin Y, et al. Oxygen-Enhanced MRI Accurately Identifies, Quantifies, and Maps Tumor Hypoxia in Preclinical Cancer Models. Cancer Res 2016;76(4):787-795.
5. Zhao D, Pacheco-Torres J, Hallac RR, et al. Dynamic oxygen challenge evaluated by NMR T1 and T2* – insights into tumor oxygenation. NMR Biomed 2015;28:937–947.
6. Matsumoto K, Bernardo M, Subramanian S, et al. MR assessment of changes of tumor in response to hyperbaric oxygen treatment. Magn Reson Med 2006;56(2):240-246.
7. Beeman SC, Shui Y-B, Perez-Torres CJ, Engelbach JA, Ackerman JJH, Garbow JR. O2-sensitive MRI distinguishes brain tumor versus radiation necrosis in murine models. Magn Reson Med 2015;75(6):2442-2447.
8. Cao-Pham TT, Tran LBA, Colliez F, et al. Monitoring Tumor Response to Carbogen Breathing by Oxygen-Sensitive Magnetic Resonance Parameters to Predict the Outcome of Radiation Therapy: A Preclinical Study. Int J Radiat Oncol Biol Phys 2016;96(1):149-160.
9. Hallac RR, Zhou H, Pidikiti R, et al. Correlations of noninvasive BOLD and TOLD MRI with pO2 and relevance to tumor radiation response. Magn Reson Med 2014;71(5):1863-1873.
10. Glowa C, Karger CP, Brons S, et al. Carbon ion radiotherapy decreases the impact of tumor heterogeneity on radiation response in experimental prostate tumors. Cancer Letters 2016;378(2):97-103.
Figures