1156
Predictive Value of Magnetic Resonance Spectroscopic Imaging during Anti-angiogenic Treatment in Recurrent Glioblastoma1Radiology, Massachusetts General Hospital, Boston, MA, United States, 2Radiology, Athinoula A. Martinos Center for Biomedical Imaging, Charlestown, MA, United States, 3Neurology, Massachusetts General Hospital, Boston, MA, United States, 4Radiology, Boston Children's Hospital, Boston, MA, United States
Synopsis
Our study examines the use of MR Spectroscopic Imaging to predict treatment response to anti-angiogenic therapy for recurrent glioblastoma patients. Our data demonstrated that early changes at 1-3 days, 4 weeks, and 6 weeks in Cho/NAA, Lac/
Introduction
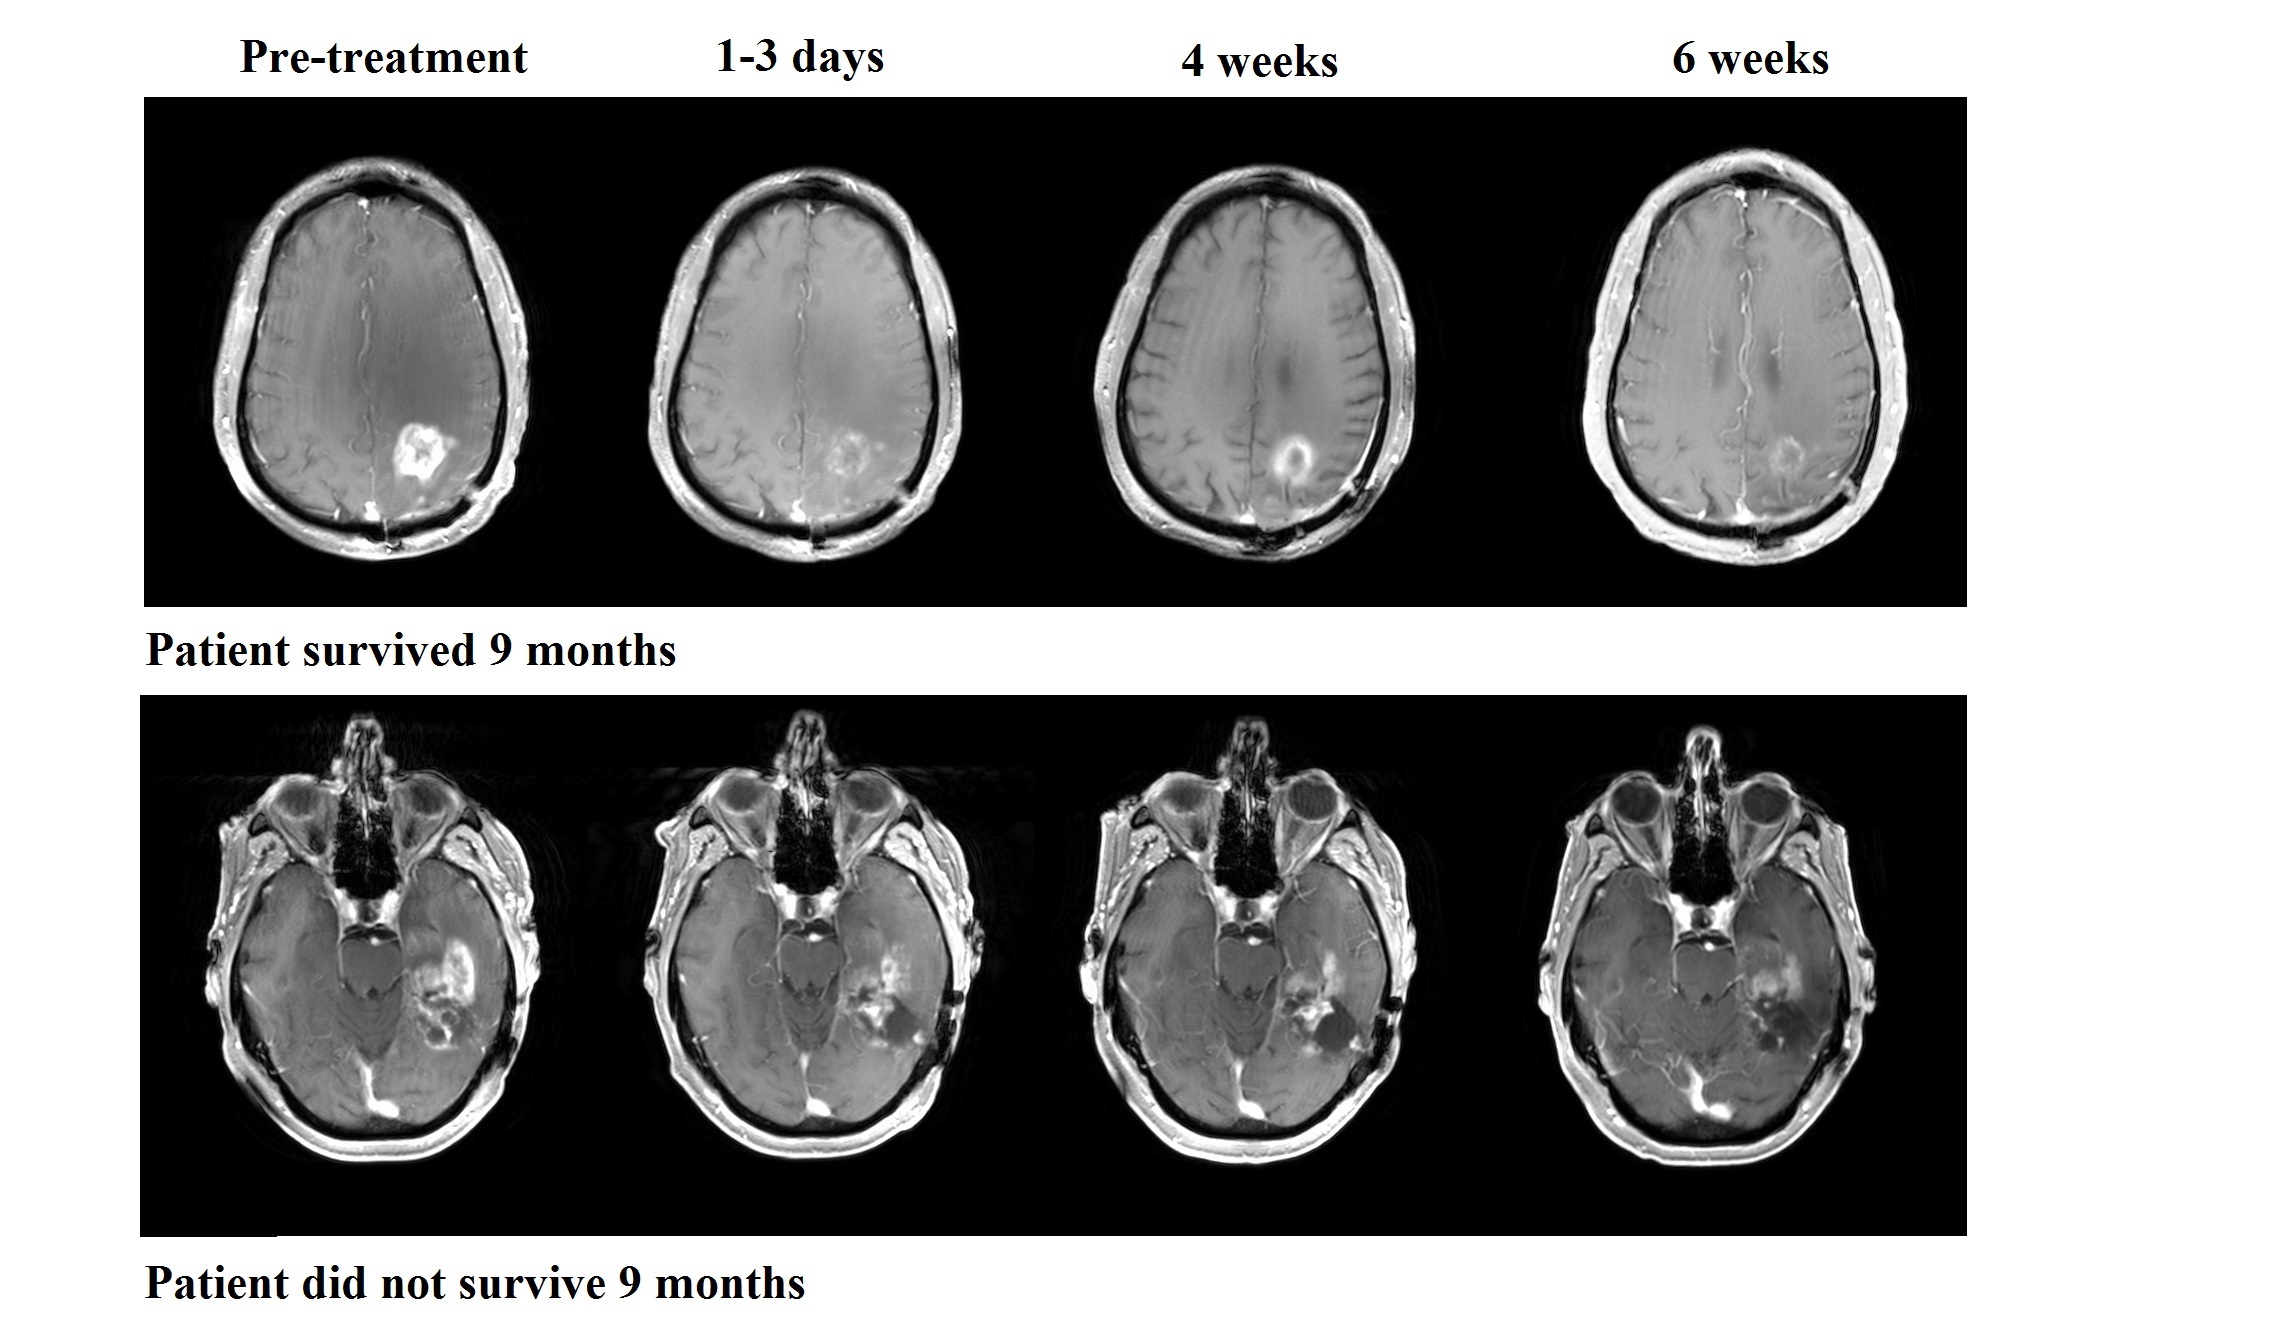
Glioblastomas are challenging cancers to treat, and long term favorable clinical outcomes in patients with recurrent glioblastoma (rGBM) continue to be difficult to achieve.1 One of the main characteristics of glioblastoma is the presence of intratumoral neoangiogenesis, and patients with rGBM are often treated with anti-angiogenic agents such as bevacizumab.2,3 Treatment with bevacizumab has shown potential in extending progression-free survival.4 However, not every patient with rGBM benefits from bevacizumab treatment. Because the use of bevacizumab is frequently associated with substantial reduction in contrast enhancement on T1-weighted MR imaging, as shown in Figure 1, it is often difficult to distinguish a true favorable tumoral response from pseudo-response using conventional MRI.5 Preliminary data from the clinical trial RTOG 0625/ACRIN 6677 suggests that MR Spectroscopy Imaging (MRSI) may be a useful modality to predict the efficacy of bevacizumab-based treatment.6 We here examine whether MRSI is clinically reliable to identify true responders from “non-responders”.Methods
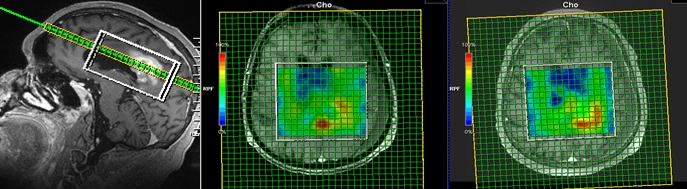
Thirty-one patients with rGBM were enrolled after obtaining informed consents for all subjects. 2D & 3D MRSI datasets were acquired on GE or Siemens scanners at either 1.5T or 3T field strengths. Acquisition parameters included TR/TE=1700/135 ms, VOI=0.7 – 1.7 cm3. Figure 2 shows an example of our longitudinal 3D MRSI voxel placement in a subject with rGBM. Collected MRSI data were analyzed using LCModel to quantify metabolites N-acetylaspartate (NAA), Creatine (Cr), choline (Cho), and lactate (Lac) in regions of interest at baseline and subsequent time points. Voxels within enhancing areas were identified by visual inspection using the corresponding T1-weighted post-contrast images. Normalized Creatine (nCr) values were collected by measuring the Creatine level in the contralateral normal white matter. The average metabolite concentrations were calculated from the selected voxels. We then examined the percent changes (Δ%) in the metabolic ratios Cho/nCr, NAA/nCr, Lac/nCr, Cho/NAA, and Lac/NAA from baseline (pre-treatment) to three subsequent timepoints: 1-3 days, 4 weeks, and 6 weeks after starting treatment. Receiver operating characteristic (ROC) curves for these spectroscopic markers were constructed for a binary outcome, overall survival at 9 months (OS-9).7Results
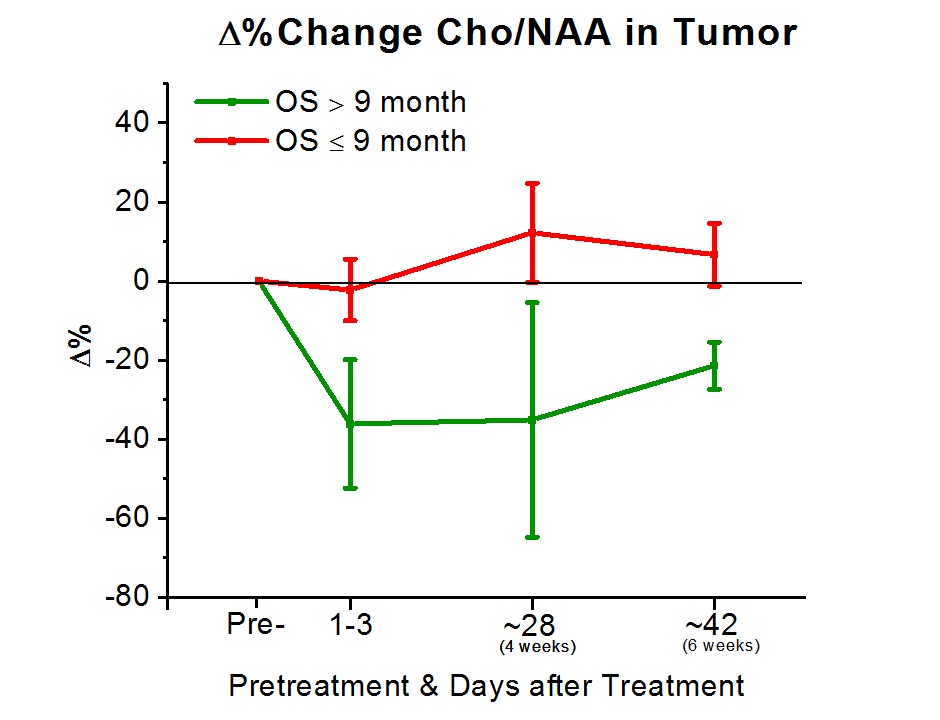
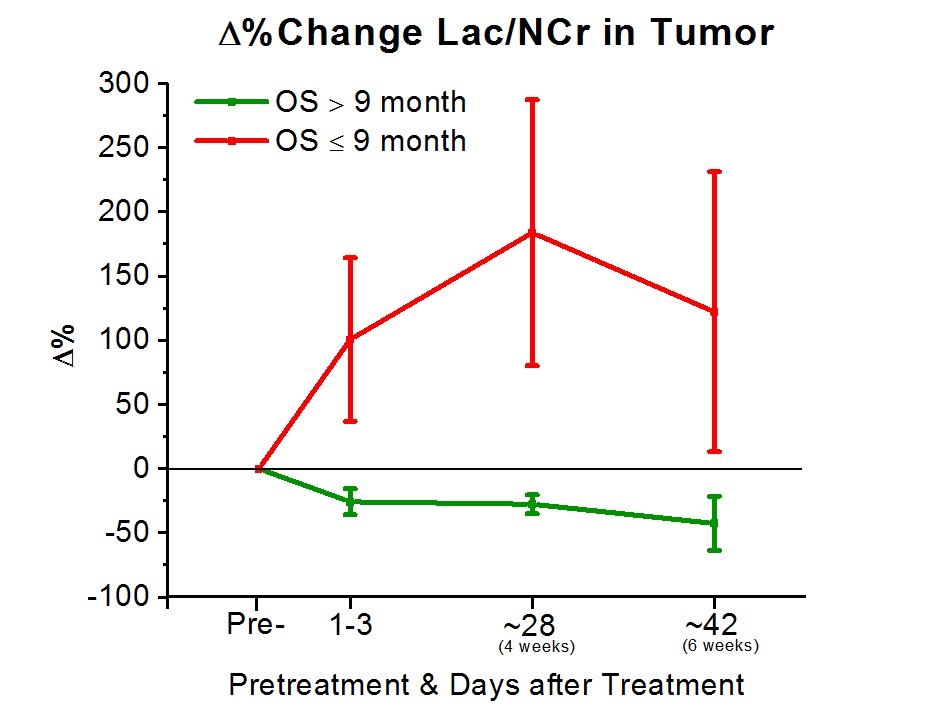
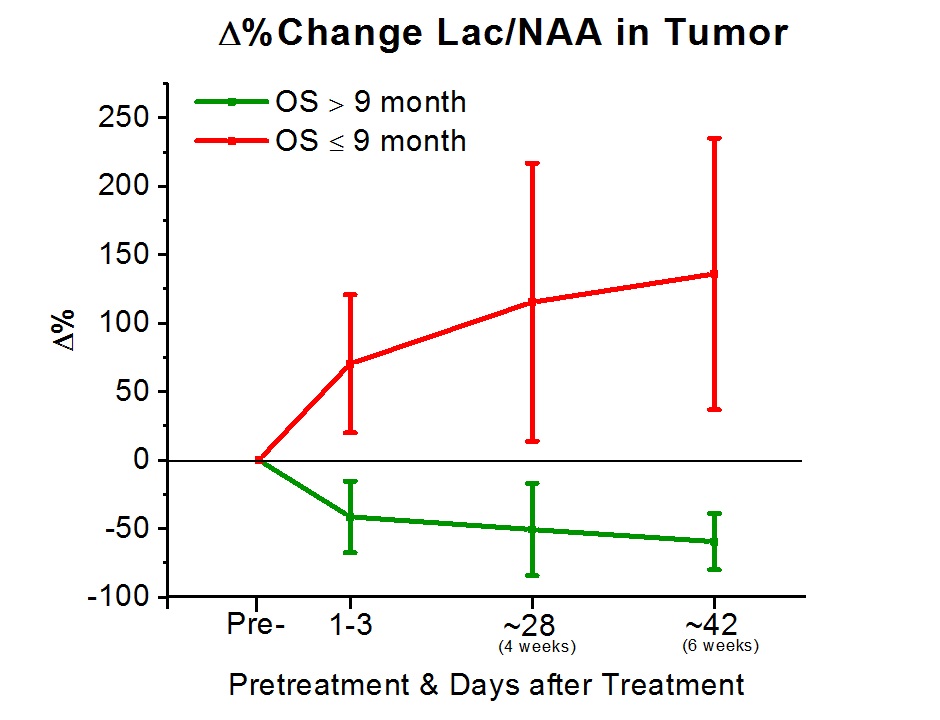
To date, 11 (8M/3F, mean age 57±15) of the 31 subjects had reached the endpoint of the study for preliminary analysis. All subjects were treated with bevacizumab-based therapy (2 received bevacizumab mono-therapy, 7 received bevacizumab+lomustine, and 3 received bevacizumab+temozolomide). 5 of these 11 subjects were alive at 9 months. Analysis of the areas under the ROC curves (AUC) revealed that Δ% in Cho/NAA from the baseline to 1-3 days, 4 weeks, and 6 weeks after treatment was predictive for OS-9 (AUC=0.86, 0.79, and 0.93, respectively). Figure 3 shows that subjects with better prognosis had a significant decline in Δ% of Cho/NAA from the baseline. Percent changes in the ratio of Lac/nCr was another marker that showed a significant predictive value at the three time-points (AUC=0.86, 0.86, and 0.80). As Figure 4 demonstrates, lactate remarkably increased for those with poor OS-9 outcomes. In accordance with these two markers, Δ% of Lac/NAA was associated with poor OS-9 (AUC=0.86, 0.93, and 0.93). Figure 5 shows that Δ% of Lac/NAA increases in those who did not survive longer than 9 months. AUC for Δ% in Cho/nCr and NAA/nCr only showed statistical trends for predicting survival.Discussion
The MRSI data demonstrated that early changes in Cho/NAA, Lac/nCr, and Lac/NAA can be predictive of survival outcomes in patients with rGBM treated with bevacizumab. The increase in lactate concentration associated with worse outcomes may be reflective of true tumoral growth with intratumoral areas of acidosis, glutaminolysis, and hypoxia.8-11 The association between decreases in Cho/NAA ratios and positive OS-9 is also in agreement with many previous studies that showed direct links between increases in choline-containing compounds with tumoral recurrence.12-14 However, our MRSI data did not confirm a significant relationship between changes in Cho/nCr and OS-9 as predicted, possibly related to the limited sample size of this preliminary analysis. Other studies have examined the use of MRSI to monitor the response to anti-angiogenic therapy,6,15 and our additional data shows that MRSI can identify the response earlier than previous studies. The ability to predict outcomes with the described changes in Cho/NAA, Lac/nCr, and Lac/NAA ratios demonstrates the potential value of MRSI for monitoring response during treatment with bevacizumab.Conclusion
Our preliminary findings suggest that early changes in Cho/NAA, Lac/nCr and Lac/NAA ratios can be useful markers for predicting therapeutic response and overall survival in patients with rGBM treated with bevacizumab.Acknowledgements
This research was supported by NIH/NCI grants R01CA190901 and R01CA129371. We would like to thank MGH Cancer Center staffs, Imaging staffs from Athinoula A. Martinos Center for Biomedical Imaging, and Quantitative Tumor Imaging staffs for assisting us in this study. We would also like to thank all the patients for participating in our study.References
1. Stupp R, Mason WP, van den Bent MJ, et al. Radiotherapy plus concomitant and adjuvant temozolomide for glioblastoma. N Engl J Med 2005;352:987-996
2. Dewhirst MW, Cao Y, Moeller B. Cycling hypoxia and free radicals regulate angiogenesis and radiotherapy response. Nat Rev Cancer 2008;8:425-437
3. Jain RK. Normalization of tumor vasculature: an emerging concept in antiangiogenic therapy. Science 2005;307:58-62
4. Kreisl, Teri N., et al. "Phase II trial of single-agent bevacizumab followed by bevacizumab plus irinotecan at tumor progression in recurrent glioblastoma." Journal of clinical oncology 27.5 (2008): 740-745.
5. Da Cruz, LC Hygino, et al. "Pseudoprogression and pseudoresponse: imaging challenges in the assessment of posttreatment glioma." American Journal of Neuroradiology 32.11 (2011): 1978-1985. 6. Ratai EM, Zhang Z, Snyder BS, et al. Magnetic resonance spectroscopy as an early indicator of response to anti-angiogenic therapy in patients with recurrent glioblastoma: RTOG 0625/ACRIN 6677. Neuro Oncol 2013;15:936-944
7. Taal, Walter, et al. "A randomized phase II study of bevacizumab versus bevacizumab plus lomustine versus lomustine single agent in recurrent glioblastoma: The Dutch BELOB study." (2013): 2001-2001.
8. Marchiq I, Pouyssegur J. Hypoxia, cancer metabolism and the therapeutic benefit of targeting lactate/H(+) symporters. J Mol Med (Berl) 2016;94:155-171
9. Vaupel P, Kallinowski F, Okunieff P. Blood flow, oxygen and nutrient supply, and metabolic microenvironment of human tumors: a review. Cancer Res 1989;49:6449-6465
10. Vander Heiden MG, Cantley LC, Thompson CB. Understanding the Warburg effect: the metabolic requirements of cell proliferation. Science 2009;324:1029-1033
11. Levine AJ, Puzio-Kuter AM. The control of the metabolic switch in cancers by oncogenes and tumor suppressor genes. Science 2010;330:1340-1344
12. Nelson SJ. Multivoxel magnetic resonance spectroscopy of brain tumors. Mol Cancer Ther 2003;2:497-507
13. Lin A, Ross BD, Harris K, et al. Efficacy of proton magnetic resonance spectroscopy in neurological diagnosis and neurotherapeutic decision making. NeuroRx 2005;2:197-214
14. Oz G, Alger JR, Barker PB, et al. Clinical proton MR spectroscopy in central nervous system disorders. Radiology 2014;270:658-679
15. Kim, Heisoog, et al. "Serial magnetic resonance spectroscopy reveals a direct metabolic effect of cediranib in glioblastoma." Cancer research 71.11 (2011): 3745-3752.
Figures