1154
Increased spatial resolution of MR Spectroscopic Imaging improves the detectability of metabolic changes in Multiple Sclerosis lesions1High Field MR Centre, Department of Biomedical Imaging and Image-guided Therapy, Medical University of Vienna, Vienna, Austria, 2Athinoula A. Martinos Center for Biomedical Imaging, Department of Radiology, Massachusetts General Hospital, Harvard Medical School, Boston, MA, United States, 3Russell H. Morgan Department of Radiology and Radiological Science, The Johns Hopkins University School of Medicine, Baltimore, MD, United States, 4F. M. Kirby Research Center for Functional Brain Imaging, Kennedy Krieger Institute, Baltimore, MA, United States, 5Department of Neurology, Medical University of Vienna, Vienna, Austria, 6Christian Doppler Laboratory for Clinical Molecular Molecular MR Imaging, Vienna, Austria
Synopsis
MR Spectroscopic Imaging provides the ability to assess the abundance and spatial distribution of several neurometabolites, which are characteristic for pathophysiological processes related to the formation and development of Multiple Sclerosis lesions. In presented work we aimed to compare the detectability of metabolic changes in MS lesions for three different in-plane resolutions of MRSI, i.e. 2.2×2.2 mm2, 3.4×3.4 mm2 and 6.8×6.8 mm2. Our results suggest that the vast majority of metabolic changes in MS cannot be reliably assessed using MRSI with typical matrix sizes of 24x24 to 32x32. With ultra-high spatial resolution (2.2x2.2 mm2 in-plane) even very small MS lesions can be well resolved.
Purpose
Multiple Sclerosis (MS) is characterized by the presence of white matter lesions, which are well visualized as hyperintensities on conventional T2-weighted MRI. However little is known about the pathophysiological mechanisms behind the lesion formation and development. MR Spectroscopy provides the ability to monitor several markers, which are characteristic for these pathological processes (i.e., inflammation, demyelination, axonal damage) in vivo, specifically N-acetyl aspartate (tNAA), Choline (tCho), Myo-Inositol (Ins), Creatine (tCr) and Glutamate+Glutamine (Glx).
Several studies reported changes in Ins, Ins/tNAA [1]; tNAA, tCho/tCr [2], Glutamate [3] or GABA [4] levels within the MS lesions or in specific brain structures of MS patients. In comparison to MRI, MR spectroscopic imaging (MRSI) studies were severely handicapped by poor spatial resolution, which is usually lower than the lesion size. Hence, these changes appear often rather diffuse or in case of smaller lesions no metabolic changes can be observed. With the advent of ultra-high resolution FID-MRSI (e.g., 100×100 to 128×128 matrix size) at 7T [5,6], this limitation may be finally overcome. In our study we aimed to compare the detectability of metabolic changes in MS lesions for three different spatial resolutions of MRSI.
Methods
After IRB approval and obtaining written informed consent, 20 RRMS and SPMS patients were scanned on Siemens 7T scanner with 1H-FID-based MRSI sequence [5,6] at two different resolutions; with 100×100 and 64×64 matrix size. An additional MRSI dataset with 32×32 matrix size was reconstructed from the central k-space part of the 64×64 dataset (sequences details in Figure 1). Spectra were processed with in-house developed software employing LCModel, Bash, MINC Tools and Matlab. ROIs were defined in MS lesions based on FLAIR images within the overlaid MRSI slice. The lesion ROIs and metabolic maps of tNAA, tCr, tCho, Ins and Glx (at three different MRSI spatial resolutions) were resampled to the same high resolution and metabolic ratios for each MRSI resolution were obtained within each ROI. Statistical analysis was performed via SPSS software using non-parametric Wilcoxon signed-ranks test.Results
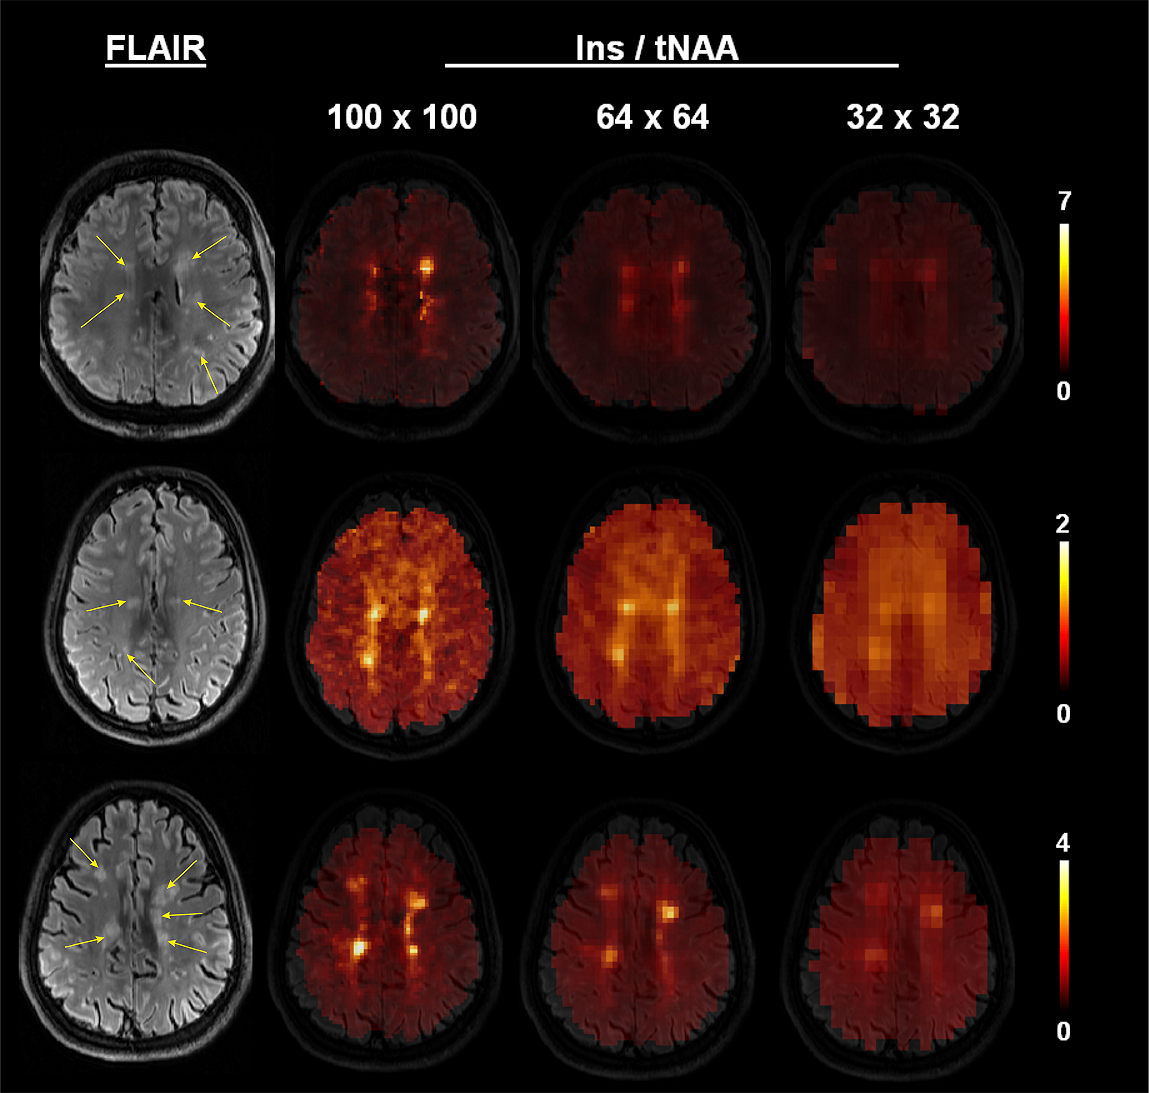
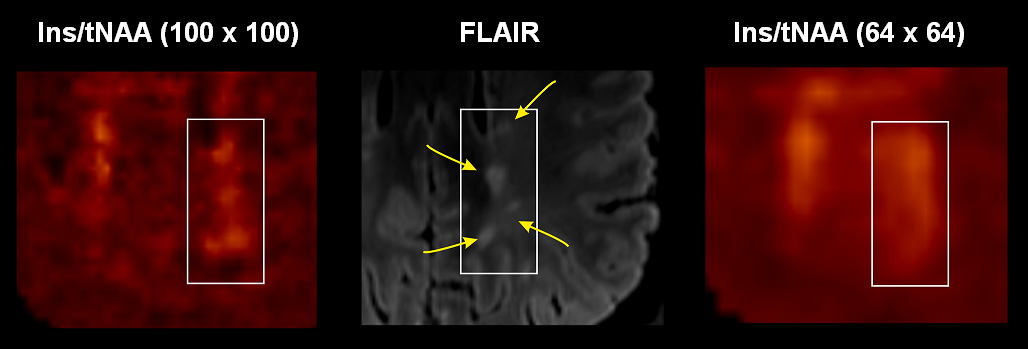
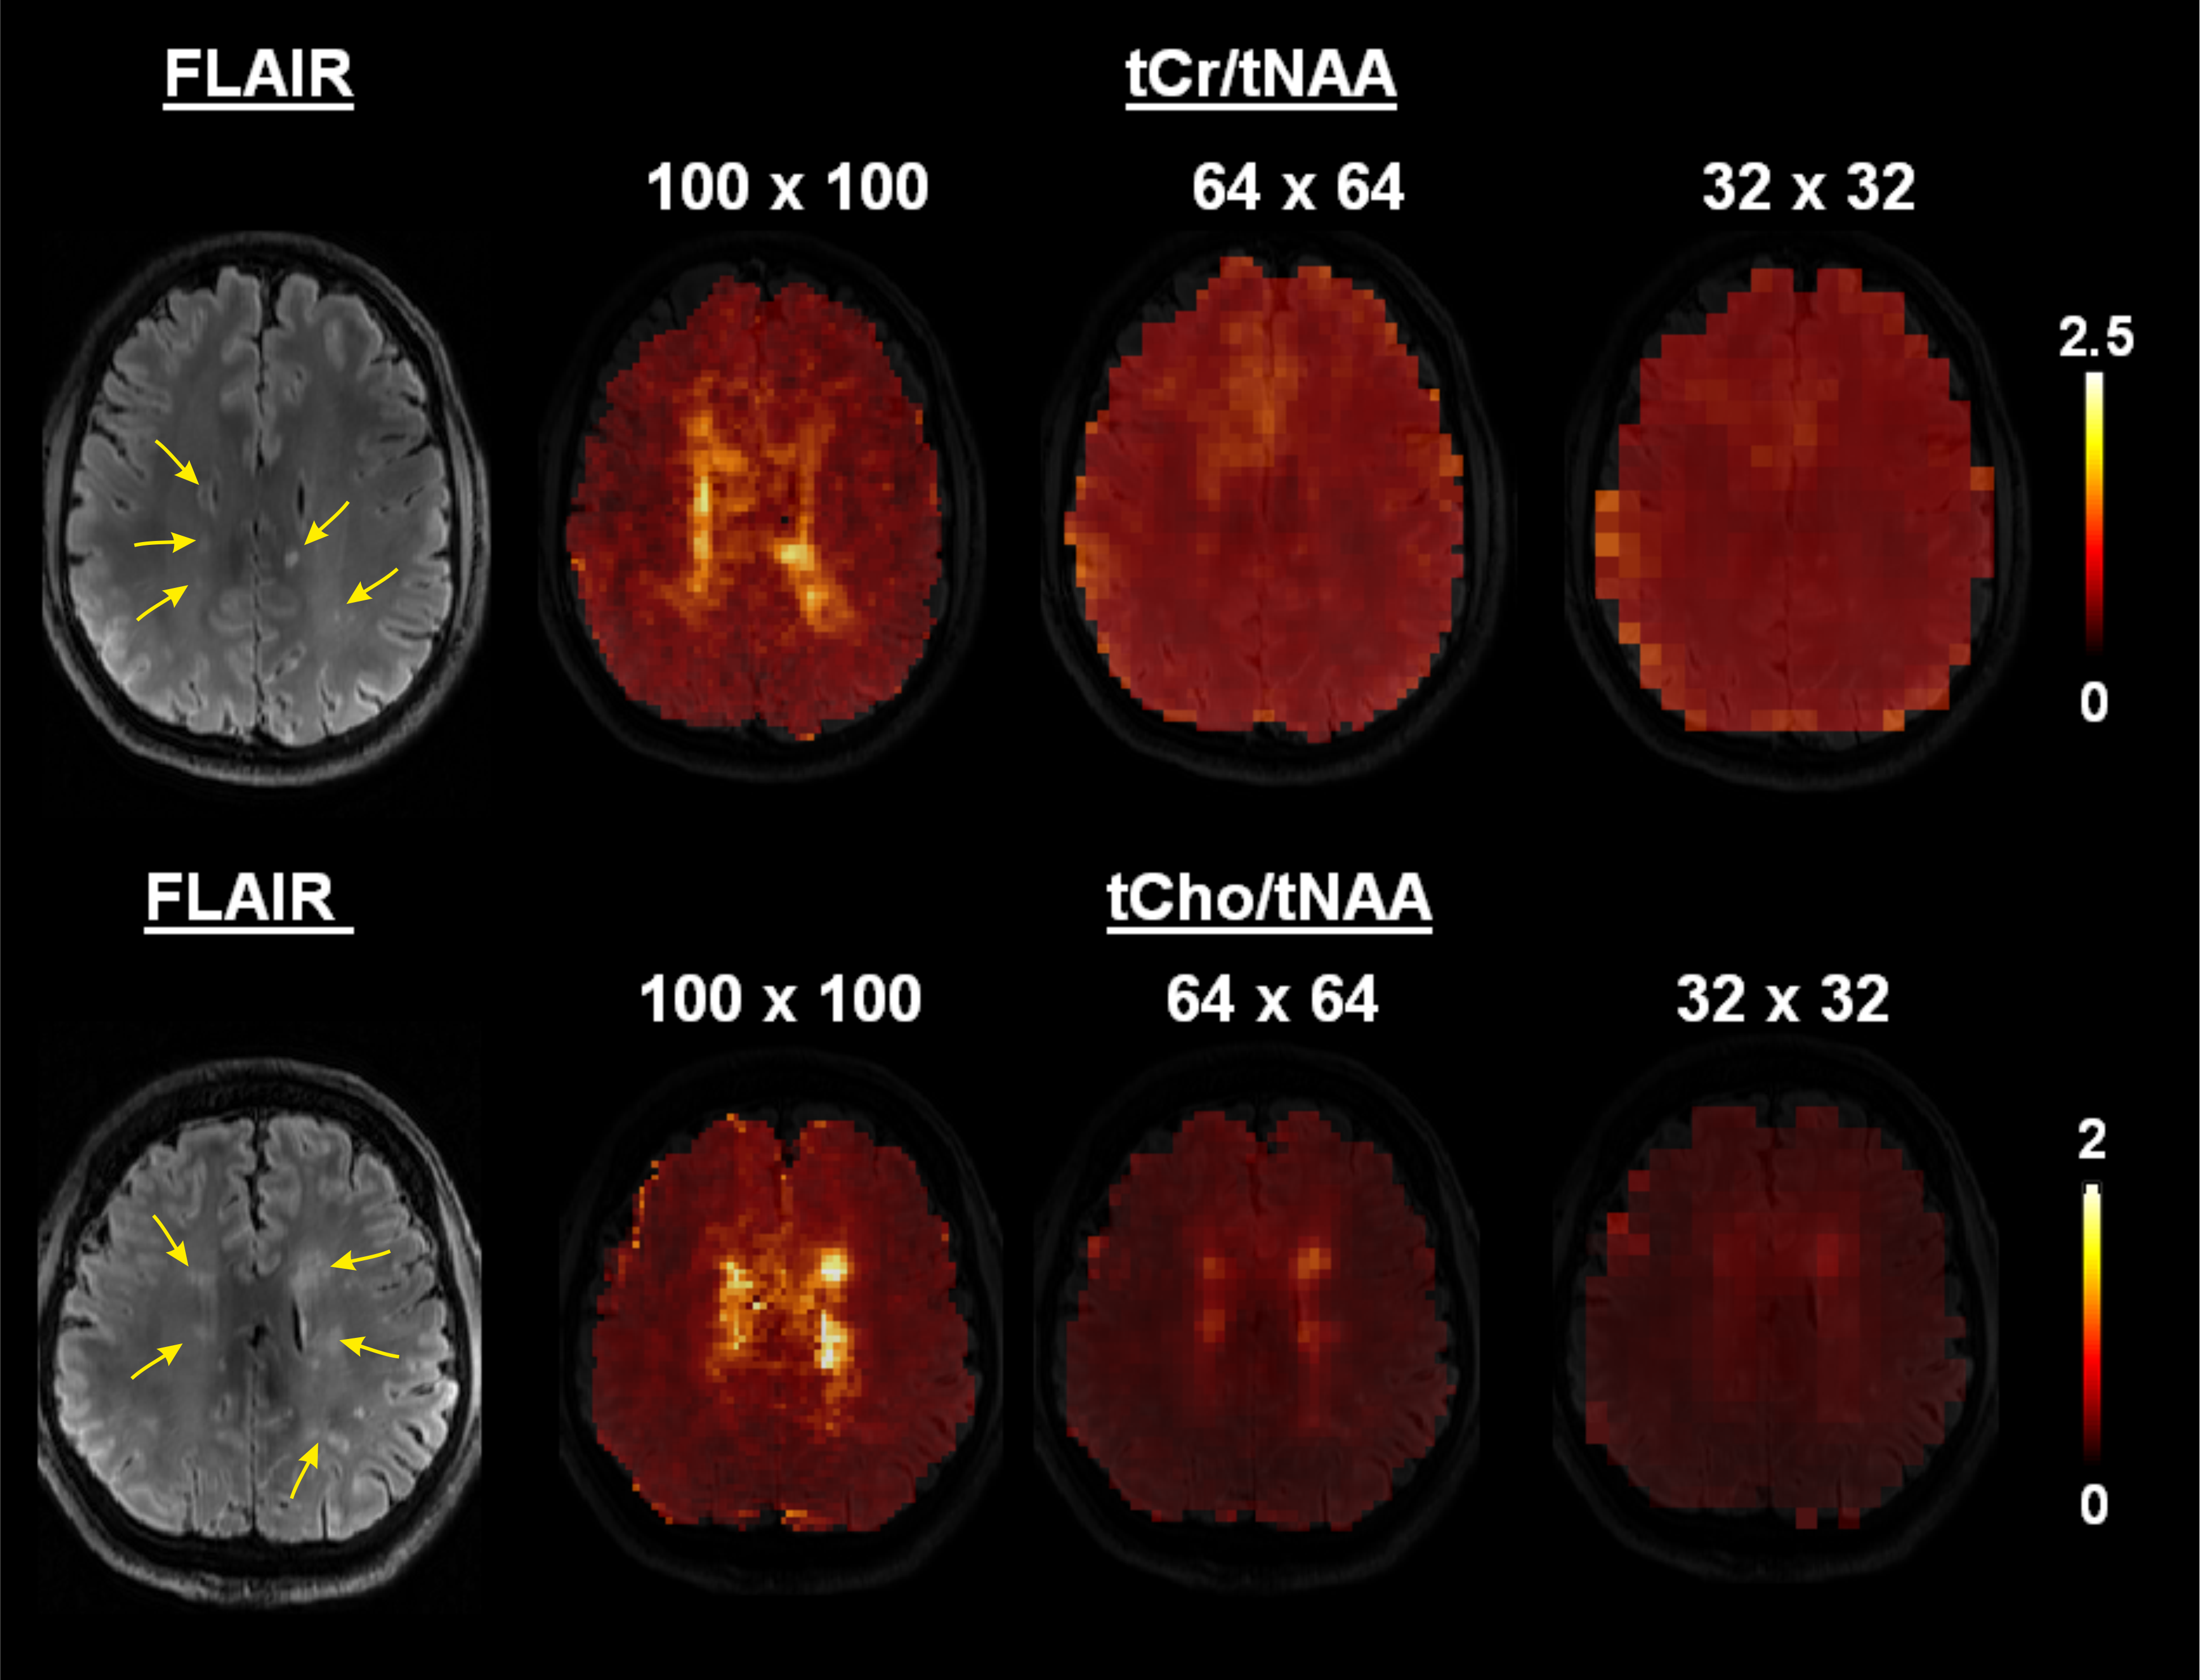
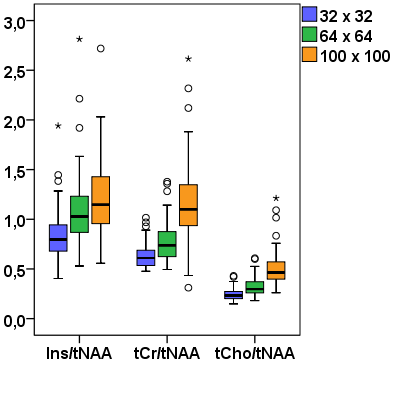
In total 75 MS lesions were investigated. Most of the lesions showed increased Ins/tNAA signal on 100×100 MRSI metabolic maps, but not all of them were elevated also on 64×64 maps, and even fewer were visible on 32×32 Ins/tNAA maps (Figure 2). Moreover, although some very small adjacent lesions showed elevations of Ins/tNAA also in 64×64 or 32×32 resolutions, they could not be properly resolved from each other, while this was well possible with the 100×100 resolution (Figure 3). Other metabolic ratios (e.g., tCr/tNAA, tCho/tNAA) were increased in some MS lesions in 100×100 resolution; however, these elevations were less obvious or even invisible in lower resolution maps (Figure 4). Metabolic ratios containing Glx could not be compared in all cases due to low SNR of Glx for the 100×100 resolution. The average metabolic ratios within MS lesions were significantly higher for the 100×100 resolution compared to those obtained from 64×64 (by 11% for Ins/tNAA, 59% for tCho/tNAA and 51% for tCr/tNAA) or 32×32 resolutions (by 45% for Ins/tNAA, 108% for tCho/tNAA and 87% for tCr/tNAA) (all p<0.001). Similarly, also the metabolic ratios of 64×64 resolution were significantly higher than those obtained for the 32×32 resolution (by 30% for Ins/tNAA, 29% for tCho/tNAA and 24% for tCr/tNAA) (all p<0.001) (Figure 5).Discussion and conclusions
In our study we compared metabolic changes in MS lesions assessed from MRSI data with three different in-plane resolutions (i.e., 6.8×6.8mm2, 3.4×3.4mm2 and 2.2×2.2mm2). Our results suggest that the vast majority of metabolic changes in MS cannot be reliably assessed using MRSI with typical matrix sizes of 24×24 to 32×32. In the best case, low-resolution MRSI significantly underestimates the amplitude of changes due to partial volume errors, but in the worst case pathologic metabolic changes are not detectable at all. Assessment of neurochemical changes in MS lesions can help to understand the role of these compounds in the pathogenesis of the disease or to monitor the activity of MS lesions. Increase of Ins, tCho, or decrease of tNAA signals were reported previously, suggesting the ongoing astrogliosis, cell membrane turnover or neuronal injury, respectively. Our MR spectroscopic imaging method is able to detect the neurometabolites in vivo in clinically feasible time (6min). With ultra-high spatial resolution (2.2×2.2 mm2 in-plane) even very small MS lesions can be well resolved. This will be particularly valuable for the study of the highly active periphery of MS lesions, where biochemical changes visible on MRSI can now be correlated with pathologic changes assessed via other MRI contrasts.Acknowledgements
This study was supported by the Austrian Science Fund (FWF): KLI 646 and P 30701 and the FFG Bridge Early Stage Grant #846505.References
1. Obert et al. PLoS One 2016; doi: 10.1371/journal.pone.0162583
2. Kocevar et al. J Neuroradiol 2017; doi: 10.1016/j.neurad.2017.06.010
3. Klauser et al. Mult Scler 2017; doi: 10.1177/1352458517702534
4. Cao et al. Eur Radiol 2017; doi: 10.1007/s00330-017-5064-9
5. Hangel et al. Neuroimage 2016; doi: 10.1016/j.neuroimage.2016.10.043
6. Strasser et al., MRM 2016; 78(2):429-440
Figures
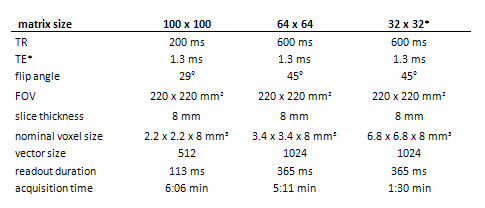
Figure 1: 1H-FID-MRSI sequence parameters for the three compared MRSI datasets with different spatial resolutions.
*Note: the dataset with 32×32 matrix was reconstructed by subsampling the inner k-space of the 64×64 dataset