1153
Investigation of Anterior Cingulate Cortex γ-Aminobutyric Acid and Glutamate-Glutamine Levels in Patients with Obsessive-Compulsive Disorder by Proton Magnetic Resonance Spectroscopy1Department of Radiology, Ruijin Hospital Shanghai Jiaotong University School of Medicine, Shanghai, China, 2Department of Functional Neurosurgery, Ruijin Hospital Shanghai Jiaotong University School of Medicine, Shanghai, China, 3Philips Healthcare, Shanghai, China, 4Philips Healthcare, Cleveland, OH, United States, 5Russell H. Morgan Department of Radiology and Radiological Science, The Johns Hopkins University School of Medicine, Baltimore, MD, United States
Synopsis
The aim of this study is to evaluate the feasibility of 1H-MR edited spectroscopy for the detection of cerebral abnormalities in Obsessive-Compulsive Disorder (OCD) patients. Twenty-three OCD patients and Twenty-four normal controls (NC) underwent MRS. The γ-Aminobutyric Acid (GABA) and Glutamate-Glutamine (Glx) level of anterior cingulate cortex (ACC) was quantified based on the GANNET 2.0 software. Differences of GABA and Glx levels between two groups were analyzed using independent two sample t-test analysis. Relative to NC group, OCD patients had higher GABA concentration in the ACC (p<0.05), but had no significant difference in ACC Glx levels. To our knowledge, this study presents the first GABA concentration measurements within ACC in OCD patients. Our results suggested that GABA and Glx levels in the ACC might be promising diagnostic and monitoring biomarker for OCD.
Purpose
Obsessive-Compulsive Disorder (OCD) is a debilitating neuropsychiatric disorder which was ranked as one of the top 20 disabling illnesses in middle-age [1]. It is believed that abnormalities in neurotransmitter systems, such as γ-Aminobutyric Acid (GABA) and Glutamate-Glutamine (Glx), may underlie symptoms in OCD patients [2], but it remains inconclusive. 1H-MR spectroscopy (MRS) allows in vivo quantitation of GABA and Glx [3]. The prevailing model of OCD pathophysiology focuses on the cortico-striato-thalamocortical circuits, with particular emphasis on the orbitofronto-striato-thalamic (‘affective’) circuits. The anterior cingulate cortex (ACC) is key region in the ‘affective’ circuits [4]. The aim of the present study was to investigate changes in GABA and Glx in the ACC using MRS technique at 3.0 T MR scanner.Methods
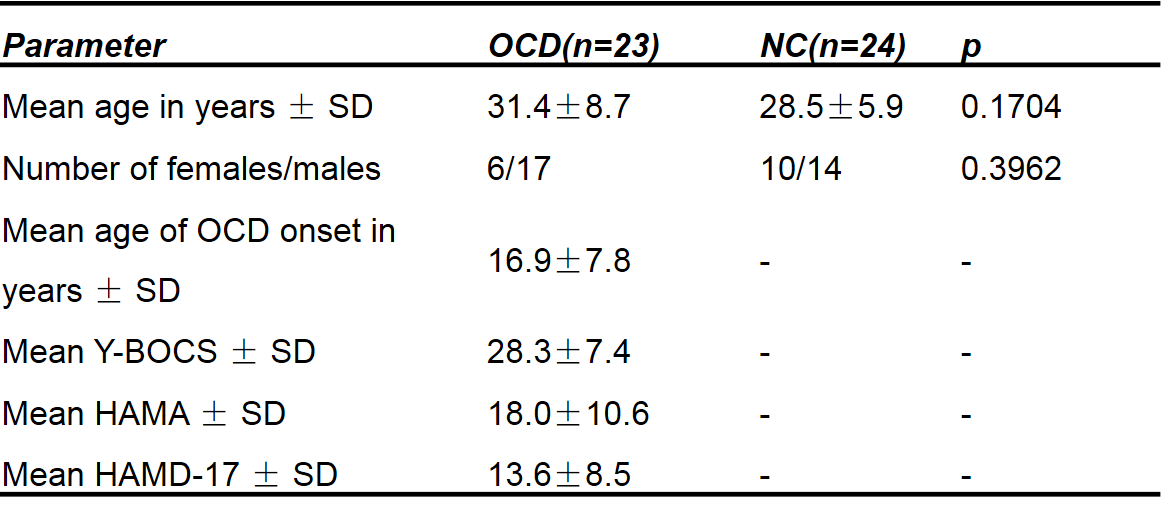
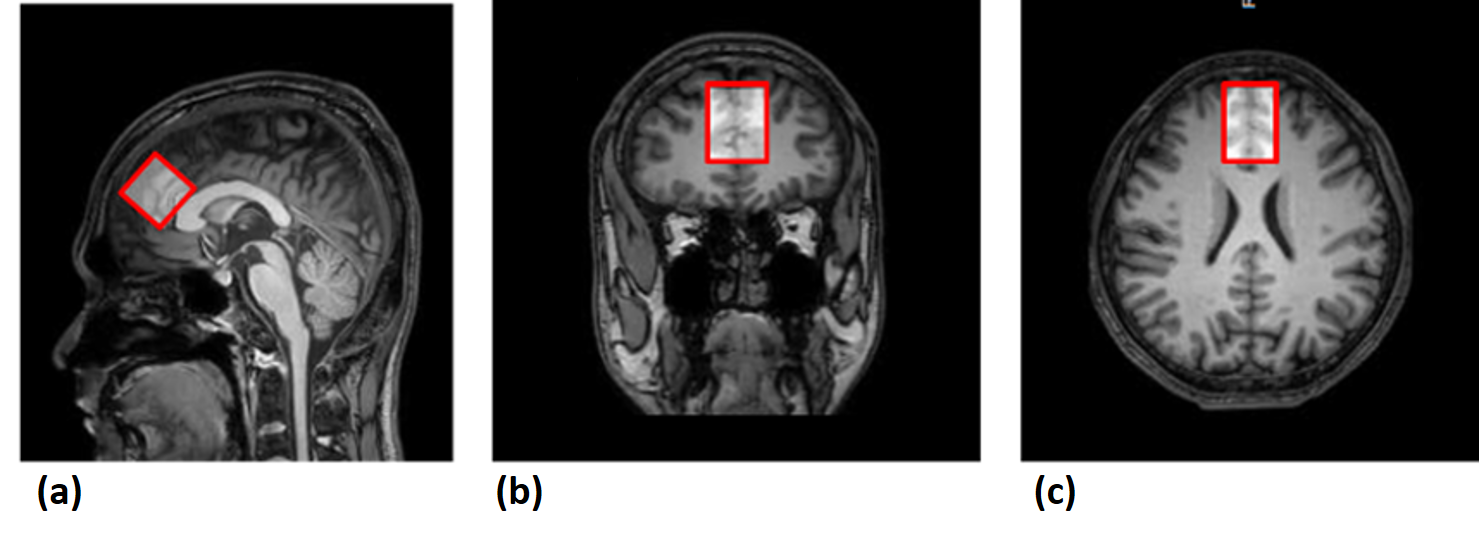
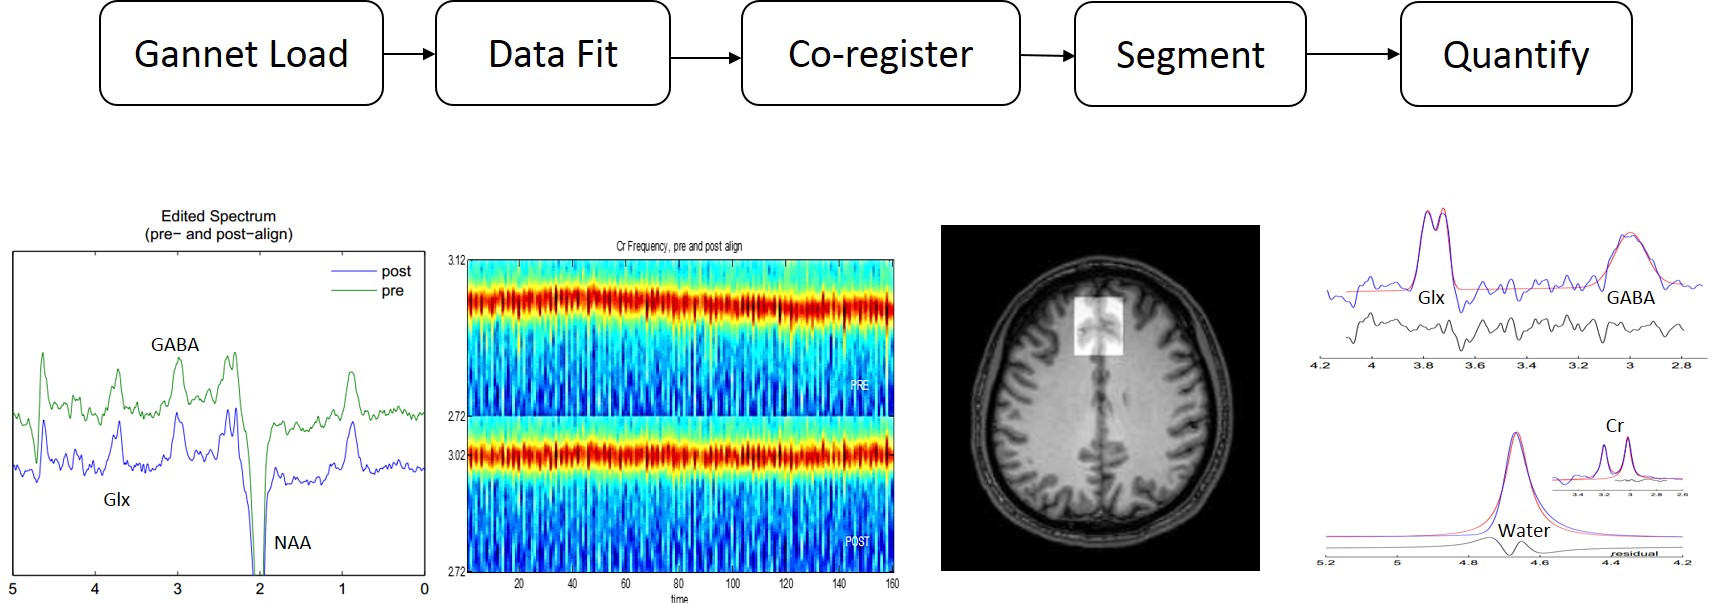
Twenty-three right-handed OCD patients (F/M:6/17, age: 31.4±8.7) were recruited from our hospital. OCD and depressive/anxiety severity were assessed by trained clinician raters using the Yale-Brown Obsessive Compulsive Scale (Y-BOCS) [5, 6], Hamilton Anxiety Scale (HAMA) and the 17-item Hamilton Depression Rating Scale (HAMD-17) [7]. Twenty-four gender and age-matched normal controls (NC) were recruited from the local community. Demographic and clinical characteristics of the subjects were provided in Table 1. All the participants provided written informed consent. MEGA-PRESS data were acquired on a 3.0 T Ingenia MRI scanner (Philips, Best, the Netherlands), using a fifteen-channel head coil and the following acquisition parameters: TR= 2000ms, TE=68ms, 14 ms-editing pulses at 1.9 ppm (“Edit-On”) and 7.46 ppm (“Edit-Off”), averages = 320, acquisition bandwidth = 1000Hz, total acquisition time = 10'56''. “MOIST” water suppression and eight unsuppressed water averages were applied for GABA level quantification. A volume of interest (VOI) with of size 30×30×30 mm3 was placed in the middle of the ACC, as shown in Figure 1. All analyses of GABA spectra were performed in Gannet 2.0, and the flow chart of data processing was shown in Figure 2, with integrated voxel-to-image co-registration and segmentation using SPM [8]. High resolution 3D T1WI (MP-RAGE, TR=8.1ms, TE=3.7ms, isotropic voxel size=1 mm3) were used to select the spectroscopic voxel. T2-weighted fluid-attenuated inversion recovery (FLAIR) images (TR=9000 ms, TE=120 ms, TI=2500 ms, field of view =230× 230 mm2, matrix size=256 × 256, slice thickness=5 mm) were acquired for the screening of cerebrovascular diseases and space-occupying lesions in brain. Differences of GABA and Glx levels between two groups were analyzed using independent two sample t-test analysis.Results and Discussion
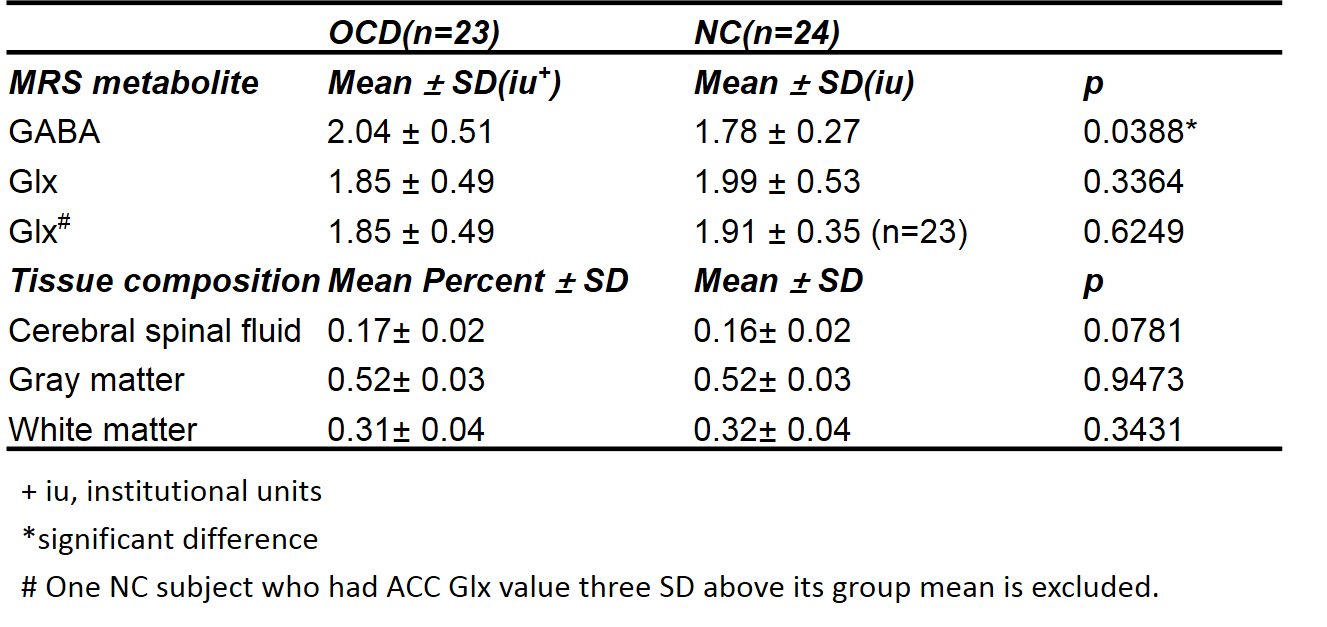
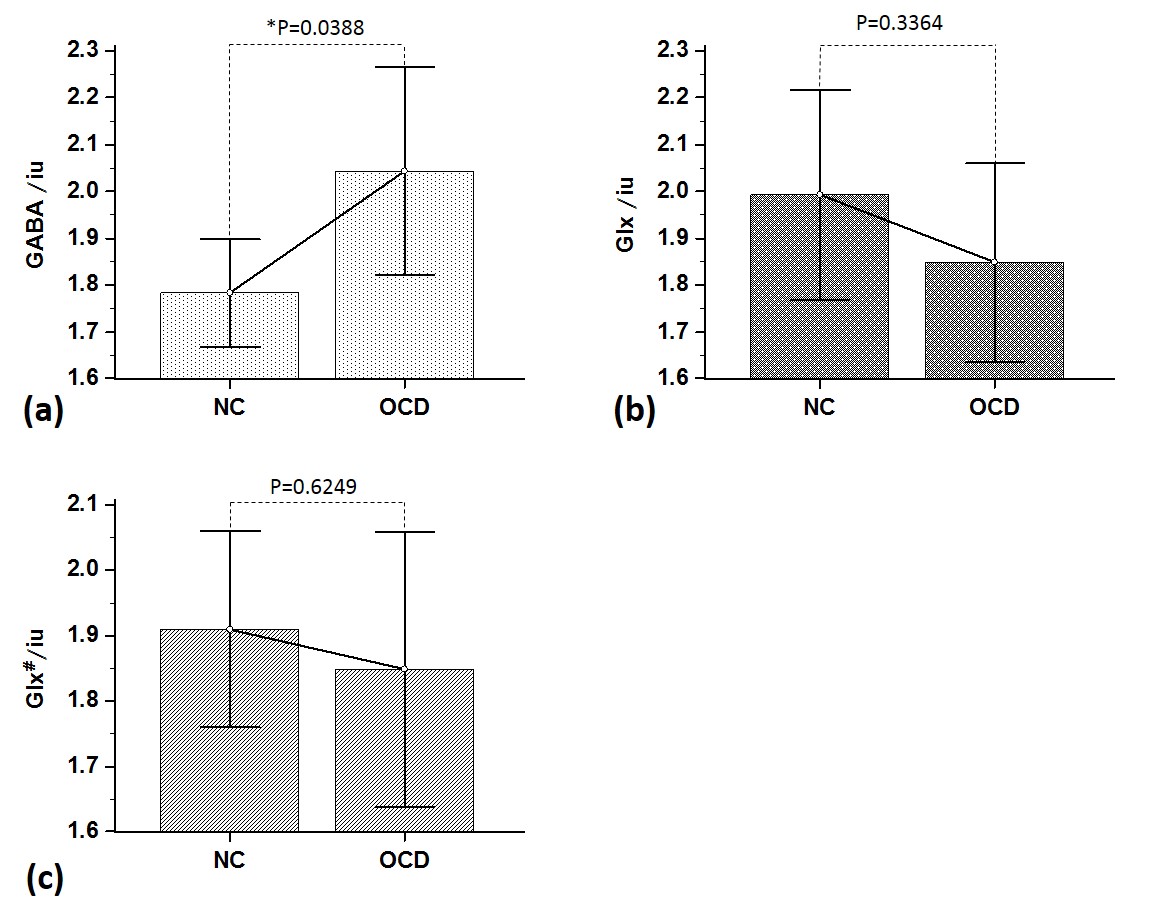
The measures of tissue segmentation are provided in Table 2, and there were no significant group differences in tissue composition in the ACC voxels. The means of GABA and Glx levels in OCD and NC are also listed in Table 2. The GABA level was reported as 2.04 ± 0.51 inst. units (iu) for OCD and 1.78 ± 0.27 iu for NC. As shown in Figure 3 (a), there was a statistically significant difference between the two groups (p=0.0388<0.05). To our knowledge, this study presents the first GABA concentration measurements within ACC in OCD patients, who showed elevations in GABA levels. This finding suggested GABA dysfunction in the cortical-striatal network involved in OCD.
The Glx was 1.85 ± 0.49 iu for OCD and 1.99 ± 0.53 iu for NC. We found a trend of decreased Glx level within the ACC in OCD patients compared with controls. Figure 3 (b) illustrates that no statistically significant differences were found (p= 0.3364 >0.05). Yucel et. al also found no differences in ACC Glx levels in 20 OCD subjects compared with 26 healthy controls [9]. However, Rosenberg et al found significant decreases (about 15%) in Glx levels in pediatric OCD patients in the same voxel [10]. The possible explanation is that there are reduced Glx levels in pediatric but not adult OCD patients in this brain region, the pathophysiology of pediatric and adult OCD might differ.
One NC subject had ACC Glx value three Standard Deviation (SD) above its group mean. If it was excluded, the results were qualitatively the same, as shown in Figure 3 (c). There were no clinical or measurement factors justifying the exclusion of the subject from the sample, so it was included.
We are in the process of recruiting a larger sample with more elaborate group division. Measurements of GABA and Glx abnormalities in patients with OCD may contribute to diagnostic subtyping into biologically meaningful component conditions, which could be valuable in ongoing efforts to make sense of the extreme heterogeneity of patients with OCD.
Conclusion
Our finding highlights that GABA and Glx levels in the ACC might be promising diagnostic and monitoring biomarker for OCD. However, further investigation of a more substantial number of subjects is needed. What’s more, the underlying mechanisms also need to be elucidated in the future.Acknowledgements
The study was supported in part through State Key Clinical Department of Medical Imaging, and Shanghai JiaoTongUniversity School of Medicine - Institute of Neuroscience(SHSMU-ION) Research Center for Brain Disorders.References
1. Abramowitz, J. S., Taylor, S., and McKay, D. Obsessive-compulsive disorder. The Lancet, 2009, 374(9688): 491-499
2. Simpson, Helen B, et al. Investigation of Cortical Glutamate–Glutamine and γ-Aminobutyric Acid in Obsessive–Compulsive Disorder by Proton Magnetic Resonance Spectroscopy. Neuropsychopharmacology Official Publication of the American College of Neuropsychopharmacology, 2012, 37(12): 2684-2692.
3. Edden RA, Puts NA, Harris AD, et al. Gannet: A batch-processing tool for the quantitative analysis of gamma-aminobutyric acid-edited MR spectroscopy spectra. Journal of Magnetic Resonance Imaging, 2014, 40(6):1445-1452.
4. Ting, Jonathan T, and G. Feng. Glutamatergic Synaptic Dysfunction and Obsessive-Compulsive Disorder. Current Chemical Genomics, 2008, 2(1):62-75.
5. Goodman W K, Price L H, Rasmussen S A, et al. The Yale-Brown Obsessive Compulsive Scale. I. Development, use, and reliability. Archives of General Psychiatry, 1989, 46(11):1012.
6. Goodman W K, Price L H, Rasmussen S A, et al. The Yale-Brown Obsessive Compulsive Scale. II. Validity. Archives of General Psychiatry, 1989, 46(11): 1012-1016.
7. Hamilton M. A Rating Scale for Depression. Journal of Neurology, Neurosurgery, and Psychiatry, 1960, 23(1): 56-62.
8. Ashburner and K. J. Friston. Unified segmentation. Neuroimage, 2005, 26(3): 839-851.
9. Yücel M, Wood S J, Wellard R M, et al. Anterior Cingulate Glutamate–Glutamine Levels Predict Symptom Severity in Women With Obsessive–Compulsive Disorder. Australian & New Zealand Journal of Psychiatry, 2008, 42(6):467.
10. Rosenberg D R, Mirza Y, Russell A, et al. Reduced anterior cingulate glutamatergic concentrations in childhood OCD and major depression versus healthy controls. Journal of the American Academy of Child & Adolescent Psychiatry, 2004, 43(9):1146-53.
Figures