1150
Why does a transient NAD+ infusion lead to a sustained increase in brain ATP levels? - A dynamic 31P MRS-MT imaging investigation at ultrahigh field1Center of Magnetic Resonance Research, Department of Radiology, University of Minnesota Medical School, Minneapolis, MN, United States
Synopsis
It has been observed recently that transient intraperitoneal infusion of oxidized nicotinamide adenine dinucleotide (NAD+) can increase intracellular ATP levels in healthy rat brain over time. Intrigued by this fascinating phenomenon, we investigated the dynamic changes of major phosphorous metabolites and the kinetics and metabolic rates of the ATP synthesis reactions in rat brain before and after introducing exogenous NAD+ using combined in vivo 31P MR spectroscopy (MRS) imaging with magnetization transfer (MT) technique at 16.4 Tesla magnet. The results of this comprehensive study provide important information for elucidating the cerebral energetic mechanism and regulation underlying this phenomenon.
INTRODUCTION
Nicotinamide adenine dinucleotide (NAD) plays key roles in regulating mitochondrial ATP production and mediating cellular signaling processes1. It has been suggested that declining intracellular NAD+ (oxidized NAD) can lead to cellular dysfunctions and disorders2-3, which could be reversed by restoring cellular NAD+ level4-5. However, the major challenge is how to evaluate the efficacy of the NAD+ restoration in vivo, especially in the human brain. We previously detected elevated NAD and ATP levels in rat brains after a brief intraperitoneal NAD+ infusion using the in vivo NAD assay 6-8. To understand this interesting phenomenon, we investigated the dynamic changes of phosphorous metabolites and kinetics of ATP synthesis reactions in rat brain before and after introducing NAD+ using combined in vivo 31P MRS imaging with magnetization transfer (MT).METHODS
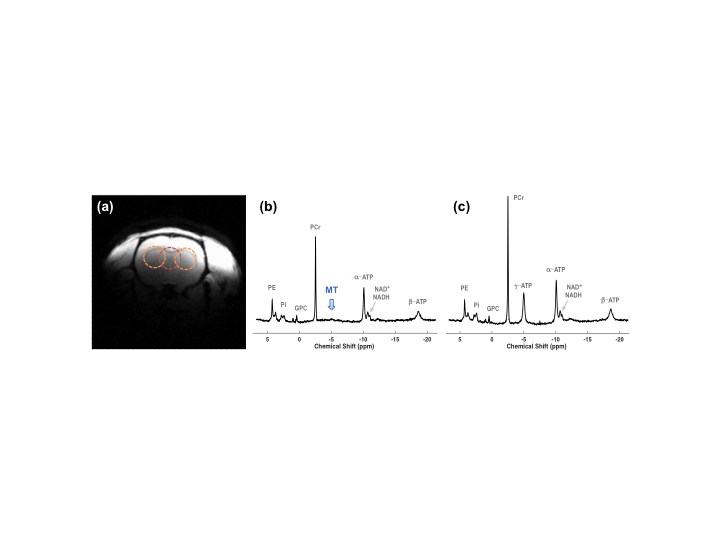
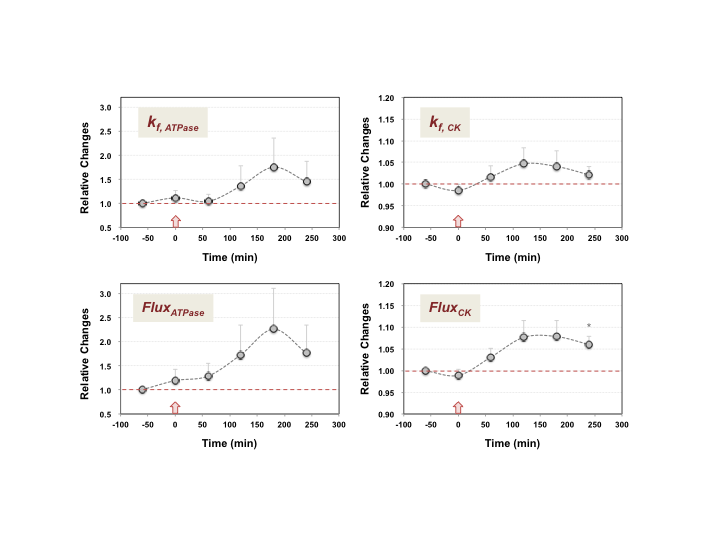
Eleven healthy rats were scanned under 2% isoflurane at 16.4 Tesla/26 cm scanner (Varian/VNMRJ) using a 1H/31P surface coil. Each rat received a 15-min intraperitoneal NAD+ infusion (Sigma-Aldrich, 400 mg/kg); 3D 31P chemical shift images (CSI, FOV=3×3×3 cm3, matrix=7×7×5, NT=112×Navg, FA≈90°) were obtained before, during and after the NAD+ infusion (Group A: n=7, 372±32 g, TR=1.2 s, Navg=2 or 4, without MT preparation; Group B: n=4, 357±26 g, TR=2.2 s, Navg=2, alternating with and without γ-ATP saturation). The 31P spectra of three identical voxels in each brain (see Figure 1a) were extracted from the CSI data and summed into blocks of Navg=20 or 12 for further analysis. The integrals of phosphorous metabolites were corrected for the saturation effects; and quantification used baseline ATP signals as internal standard ([ATP]=2.8 mM). The apparent forward rate constant of ATPase (kf,ATPase) and creatine kinase (CK, kf,CK) reactions were determined by kf = Mc/Ms -1, where Mc and Ms were the control and γ-ATP saturated magnetization for inorganic phosphate (Pi) or phosphocreatine (PCr). The apparent metabolic rate of ATP production via ATPase (FluxATPase) or CK (FluxCK) reactions was calculated by multiplying the kf with [Pi] or [PCr].RESULTS
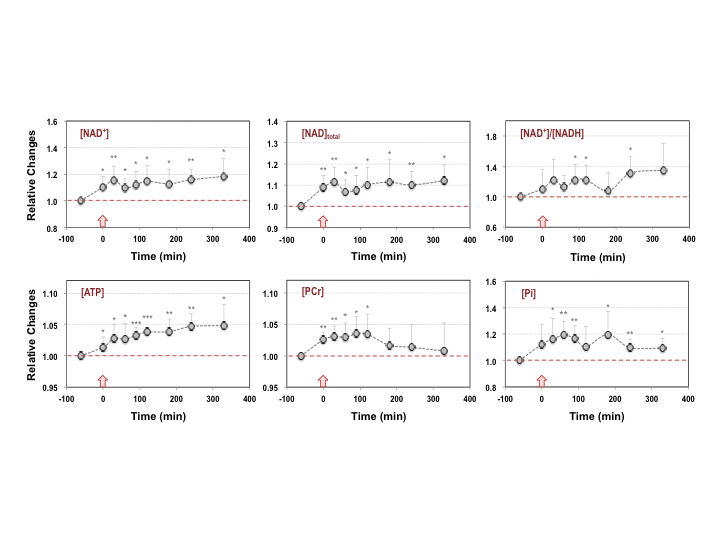
Figure 1 shows the baseline 31P-MT spectra of the central voxel with (b) and without (c) γ-ATP saturation from a representative rat brain; excellent 31P sensitivity and spectral quality were evident. Figure 2 displays the time courses of [NAD+], [NAD]total (=[NAD+]+[NADH]) and the NAD+/NADH redox ratio, and the intracellular [ATP], [PCr] and [Pi] in response to the NAD+ infusion. Clearly, the significant increases of the [NAD+] and [NAD]total in the healthy rat brain were accompanied by an increase in the NAD+/NADH redox state; and these changes were sustained for more than 5 hours after the NAD+ infusion ended. The initial build up of PCr and Pi were diminishing after 2-3 hours while the brain ATP was elevated all the time. Although the changes in the NAD, ATP and PCr were relatively small, the post-infusion brain contents of these metabolites were significantly higher than their baseline levels. To evaluate the effects of the NAD+ infusion on the kinetics of the ATP synthesis reactions, the dynamic changes of the apparent forward rate constants and fluxes of the ATPase and CK reactions were assessed (Figure 3), showing dramatic increases in enzyme activities and ATP production.DISCUSSION and CONCLUSION
Transient NAD+ infusion significantly elevated the intracellular NAD contents and NAD+/NADH redox state in normal brain tissue, which could last for many hours. The rapid rise in the brain NAD and redox state led to a gradual and significant brain ATP increase that sustained beyond the measurement window of the current study. Consistent with the higher NAD redox state, we also found that the ATP production via both ATPase and CK reactions were increased after the NAD+ infusion, suggesting both enzymatic activities promoted the energy enhancement, although the ATPase reaction played a dominating role.
The findings of this original work provide comprehensive and dynamic information regarding the energetic consequences of the transient NAD+ infusion on normal brain tissue. This is the first demonstration that a short infusion of NAD+ could significantly boost the neuroenergetics via increasing the NAD redox state and mitochondrial oxidative phosphorylation in live brains. The in vivo 31P MRS imaging methodology presented herein could be highly valuable for non-invasively evaluating the efficacy of various NAD+-repletion therapies in healthy and diseased brains.
Acknowledgements
NIH grants of R24 MH106049, R01 MH111447, NS057560, NS070839, MH111447; R24 MH106049, P41 EB015894, P30 NS076408, S10 RR025031 and Keck foundation.References
1. Houtkooper RH, Cantó C, Wanders RJ and Auwerx J. The secret life of NAD+: an old metabolite controlling new metabolic signaling pathways. Endocr Rev; 2010;31(2):194-223.
2. Mouchiroud L, Houtkooper RH, Auwerx J. NAD+ metabolism: a therapeutic target for age-related metabolic disease. Crit Rev Biochem Mol Biol. 2013;48(4):397-408.
3. Verdin E. NAD⁺ in aging, metabolism, and neurodegeneration. Science. 2015;350(6265):1208-13.
4. Gomes AP, Price NL, Ling AJ et al. Declining NAD+ induces a pseudohypoxic state disrupting nuclear-mitochondrial communication during aging. Cell. 2013 Dec 19;155(7):1624-38.
5. Zhang H, Ryu D, Wu Y et al. NAD⁺ repletion improves mitochondrial and stem cell function and enhances life span in mice. Science. 2016;352(6292):1436-43.
6. Lu M, Zhu XH, Zhang Y and Chen W. Intracellular redox state revealed by in vivo 31P MRS measurement of NAD+ and NADH contents in brains. Magn Reson Med. 2014;71(6):1959-72.
7. Zhu XH, Lu M, Lee BY et al. In vivo NAD assay reveals the intracellular NAD contents and redox state in healthy human brain and their age dependences. Proc Natl Acad Sci U S A. 2015;112(9):2876-81.
8. Lu M, Zhu XH, Zhang Y and Chen W. Exogenous NAD+ Enhances Energy Metabolism in Healthy Rat Brains. Proc Int Soc Magn Reson Med. 2017.
Figures