1148
31P NMRS-determined intramuscular Mg2+ and its relation to quantitative NMR imaging and spectroscopy outcome measures in Duchenne muscular dystrophy1NMR Laboratory, Institute of Myology, Paris, France, 2NMR Laboratory, CEA, DRF, IBFJ, MIRCen, Paris, France
Synopsis
Free [Mg2+] determination with 31P NMRS is highly dependent on a precise knowledge of intracellular pH. The pH of Duchenne muscular dystrophy patients as determined by the 31P NMRS chemical shift of inorganic phosphate is abnormally alkaline. We have recently shown that intracellular pH in skeletal muscle could be determined using 1H NMRS of carnosine and that intracellular pH was alkaline in a proportion but not in all the DMD patients with a 31P NMRS-based alkaline pH. We decided to take advantage of this 1H NMRS-based intracellular determination to determine whether free intramuscular [Mg2+] is, in fact, abnormally low in DMD patients and investigate its relation with water T2 and fat fraction.
Purpose
In very early studies, free intracellular [Mg2+] has been reported to be lower in skeletal muscle of Duchenne muscular dystrophy (DMD) patients1,2. This reduction in [Mg2+] is likely reflecting membrane leakiness and has potentially major consequences due to the Mg2+ regulatory role in many cellular processes3. Free [Mg2+] determination with 31P NMRS, based on the chemical shift between αATP and βATP (adenosine triphosphate), is highly dependent on a precise knowledge of intracellular pH because of a competition between H+ and Mg2+ ions for binding with ATP. The pH of DMD patients as determined by the 31P NMRS chemical shift of inorganic phosphate (Pi) is abnormally alkaline4. The origin of the alkaline Pi pool, whether it is arising from compromised dystrophic myocytes or from an expanded interstitial space, possibly in relation with fibrosis process, however, cannot be determined using 31P NMRS. In the second scenario, free [Mg2+] might be underestimated. We have recently shown that intracellular pH in skeletal muscle could be determined in DMD patients using 1H NMRS of carnosine and that intracellular pH was alkaline in a proportion but not in all the DMD patients with a 31P NMRS-based alkaline pH5. We decided to take advantage of this 1H NMRS-based intracellular determination to determine whether free intramuscular [Mg2+] is in fact abnormally low in DMD patients. Also, with the introduction of a range of novel therapies for DMD, the need for a rapidly responsive, predictive biomarker of disease activity has never been so great. While certainly useful, the muscle water T2 determination has shown its limits, particularly in steroid-treated patients. We wanted to investigate the relation between free [Mg2+], water T2 and fat fraction (FF) and determine whether free [Mg2+] might potentially be used as a biomarker independent of water T2.Methods
31P NMRS and quantitative NMRI data from 64 DMD patients (9.9 ± 3.1 years; 6-18 year age range) and 67 age-matched boys (12.7 ± 4.1 years; 6-20 year age range) were analyzed for comparisons with the intramuscular Mg2+ content. All NMR had been acquired on a 3T Siemens Prisma system using a body matrix coil for qNMRI and a dual-tuned 31P-1H surface coil for 31P NMRS. Non-localized 31P NMR spectra had been obtained in the flexor forearm, the leg extensor or the leg triceps surae muscle. 31P NMRS data were processed with the AMARES algorithm from jMRUI6. Intramuscular Mg2+ and pH were calculated as in Fig. 1. In a subset of DMD patients and controls, the [Mg2+] was also calculated with based on 1H NMRS5. FF and water T2 values were acquired at the level of the forearms or the leg muscles (leg extensor or triceps surae), with the 3pt-Dixon fat/water separation and multi-slice multi-echo (MSME) NMR sequences, respectively8. Statistical analysis was performed with significance level P < 0.05.Results
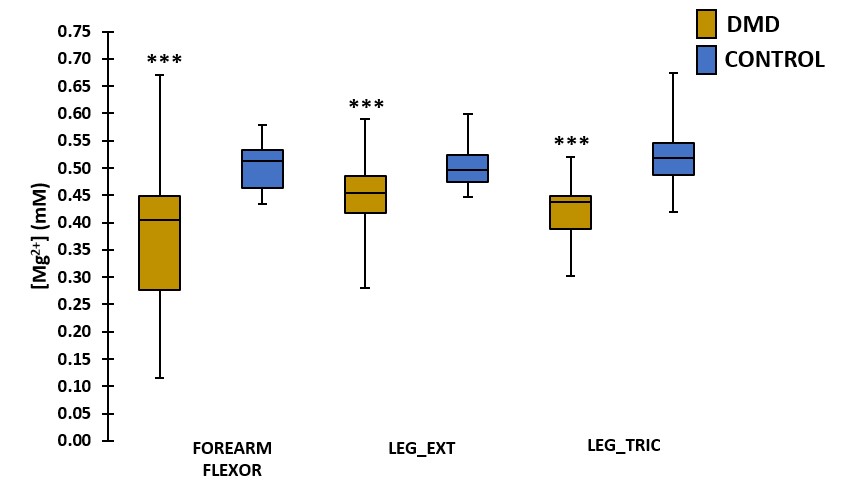
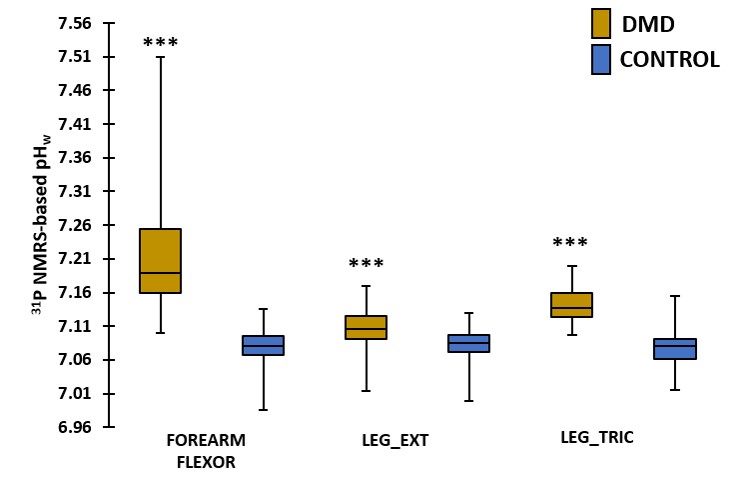
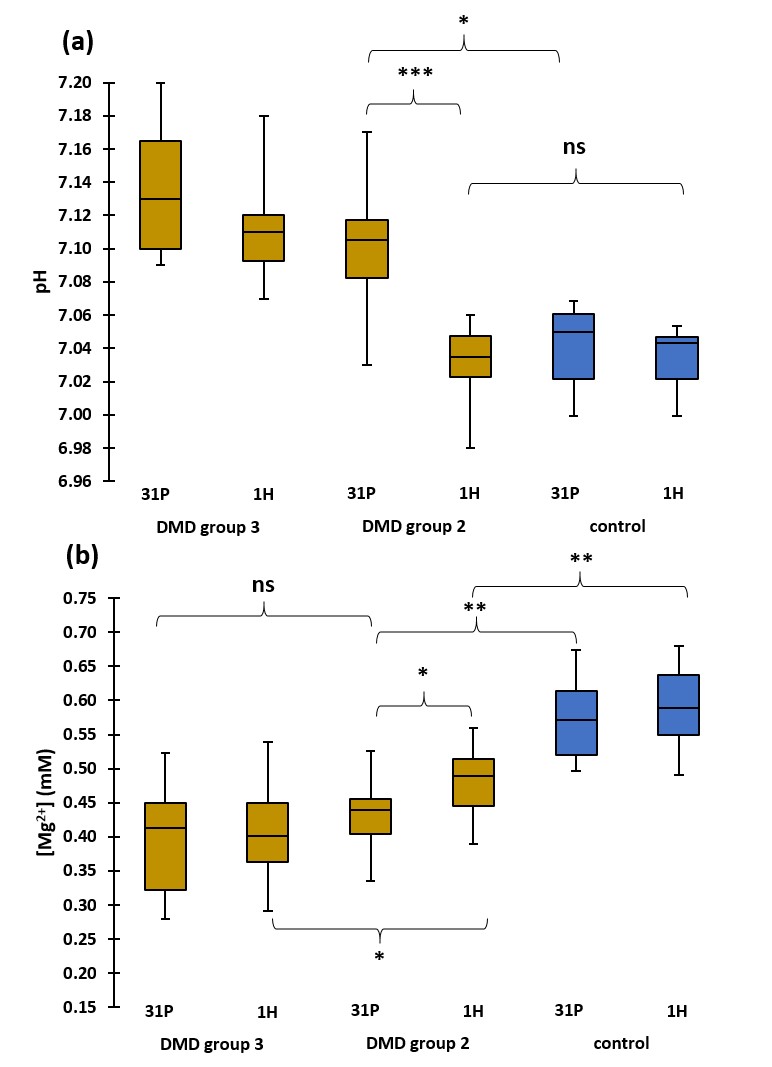
When performing a cross-sectional analysis, Mg2+ concentrations were found to be significantly lower in DMD patients as compared to controls in all investigated muscles (Fig. 2). In all muscles, pHw (as determined with 31P NMRS) was significantly increased in DMD patients (Fig. 3). Since [Mg2+] is highly dependent on the value of pH and therefore strongly biases Mg2+ values, [Mg2+] was recalculated with pH values based on 1H NMRS as this gives the real intracellular pH. As can be observed from Fig. 4a, the 1H NMRS-based pH in a subgroup of DMD patients (group 2) is normal, in contrast to the 31P NMRS-based pH5. Consequently, the corresponding [Mg2+] values were also significantly different between both methods (Fig. 4b). However, the significant difference in [Mg2+] between DMD patients (group 2) and controls was preserved even when the intracellular pH was similar in both groups (Fig. 4b). An interesting additional finding was that [Mg2+] was significantly different between the two DMD subgroups when using 1H NMRS-derived pH but not with 31P NMRS-derived pH. As a measure of the disease progression, FF was assessed and was significantly higher in all muscles as compared to controls (Fig. 5a). FF was the highest in the forearm as this population was generally older with more than half of the patients being non-ambulant. There was a significant correlation between the [Mg2+] and FF (Fig. 5b), but not with water T2.Discussion/Conclusion
Low free [Mg2+] is real and a likely consequence of membrane leakiness in DMD patients. Based on the correlation with FF, free [Mg2+] might be a biomarker of disease severity, independent of water T2. Its response to dystrophin expression needs to be further investigated in order to determine whether it might be proposed as an indicator of therapeutic response.Acknowledgements
No acknowledgement found.References
1. Bertorini TE, Bhattacharya SK, Palmieri GM. Muscle calcium and magnesium content in Duchenne muscular dystrophy. Neurology. 1982;32(10):1088-1092.
2. Jackson MJ, Jones DA, Edwards RH. Measurements of calcium and other elements in muscle biopsy samples from patients with Duchenne muscular dystrophy. Clin Chim Acta. 1985;147(3):215-21.
3. de Baaij JH, Hoenderop JG, Bindels RJ. Magnesium in man: implications for health and disease. Physiol Rev. 2015;95(1):1-46.
4. Wary C, Azzabou N, Giraudeau C, et al. Quantitative NMRI and NMRS identify augmented disease progression after loss of ambulation in forearms of boys with Duchenne muscular dystrophy. NMR Biomed. 2015;28(9):1150–1162.
5. Reyngoudt H, Turk S, Carlier PG. 1H NMRS of carnosine combined with 31P NMRS to better characterize skeletal muscle pH dysregulation in Duchenne muscular dystrophy. NMR Biomed. 2017;e3839.
6. Vanhamme L, van den Boogaart A, Van Huffel S. Improved method for accurate and efficient quantification of MRS data with use of prior knowledge. Magn Reson Imaging. 1997;129(1):35-43.
7. Wary C, Brillaut-Salvat, Bloch G. Effect of chronic magnesium supplementation on magnesium distribution in healthy volunteers evaluated by 31P NMRS and ion selective electrodes. Br J Clin Pharmacol. 1999;48(5):655-662.
8. Azzabou N, Loureiro de Sousa P, Caldas E, et al. Validation of a generic approach to muscle water T2 determination at 3T in fat-infiltrated skeletal muscle. J Magn Reson Imaging. 2015;41(3):645-653.
Figures