1146
Increased pulsatility in cerebral perforating arteries in patients with lacunar infarction or deep intracerebral hemorrhage, an explorative 7T MRI study1Radiology, UMCU, Utrecht, Netherlands, 2Brain Center Rudolf Magnus, UMCU, Utrecht, Netherlands, 3Department of Neurology, Radboud University Medical Center, Nijmegen, Netherlands
Synopsis
Cerebral small vessel disease is a major cause of dementia and stroke with unknown pathophysiology. Increased blood flow pulsation is hypothesized to be an underlying pathology of small vessel disease, but has not been investigated in cerebral small vessels. Using 2D phase contrast MRI at 7T, we measured the pulsatility index in cerebral perforating arteries of patients with lacunar infarction or deep intracerebral haemorrhage and a group of healthy controls. We showed that both patient groups have a higher pulsatility index in small vessels than controls. This warrants further research into the possible role of pulsatility in small vessel disease.
Introduction
Cerebral small vessel disease is a major cause of dementia and stroke.1 Current human imaging techniques can at best depict end stage damage like infarctions and hemorrhages. Increased blood flow pulsation is hypothesized to be an underlying mechanism of several cerebrovascular pathologies related to small vessel disease, but has not been investigated in small cerebral vessels.2
The aim of this explorative study is to compare blood flow velocity and its pulsatility in perforating arteries between patients with small vessel disease and healthy controls. We investigated two patient groups (lacunar infarction and deep intracerebral haemorrhage patients) with stroke attributed to small vessel disease and a group of age and sex matched healthy controls.
Methods
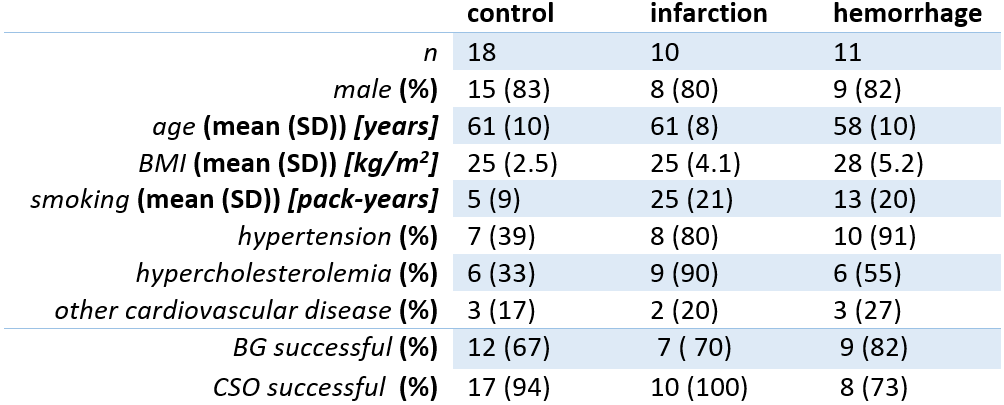
This study was approved by the medical ethical committee of our institution and all participants provided informed consent. A total of 12 infarction patients, 11 hemorrhage (compatible with hypertension) patients, and 20 controls were recruited. Controls were excluded when a study image (as a chance finding) showed confluent white matter hyperintensities (Fazekas scale ≥ 2) or any neurological disease.
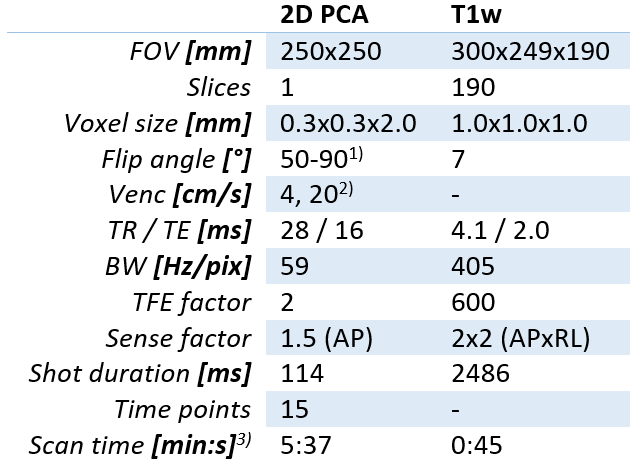
A previously published 2D phase contrast MRI (2D PCA) acquisition was performed at 7T (Philips Healthcare) to measure time resolved blood flow velocity in cerebral perforating arteries.3,4 The 2D PCA acquisition was performed in the semi-oval center (CSO), and in the basal ganglia (BG). A T1 weighted 3D turbo field echo (T1w) acquisition was performed for planning and segmentation purposes. The parameters for the MRI acquisitions are listed in Table 1.
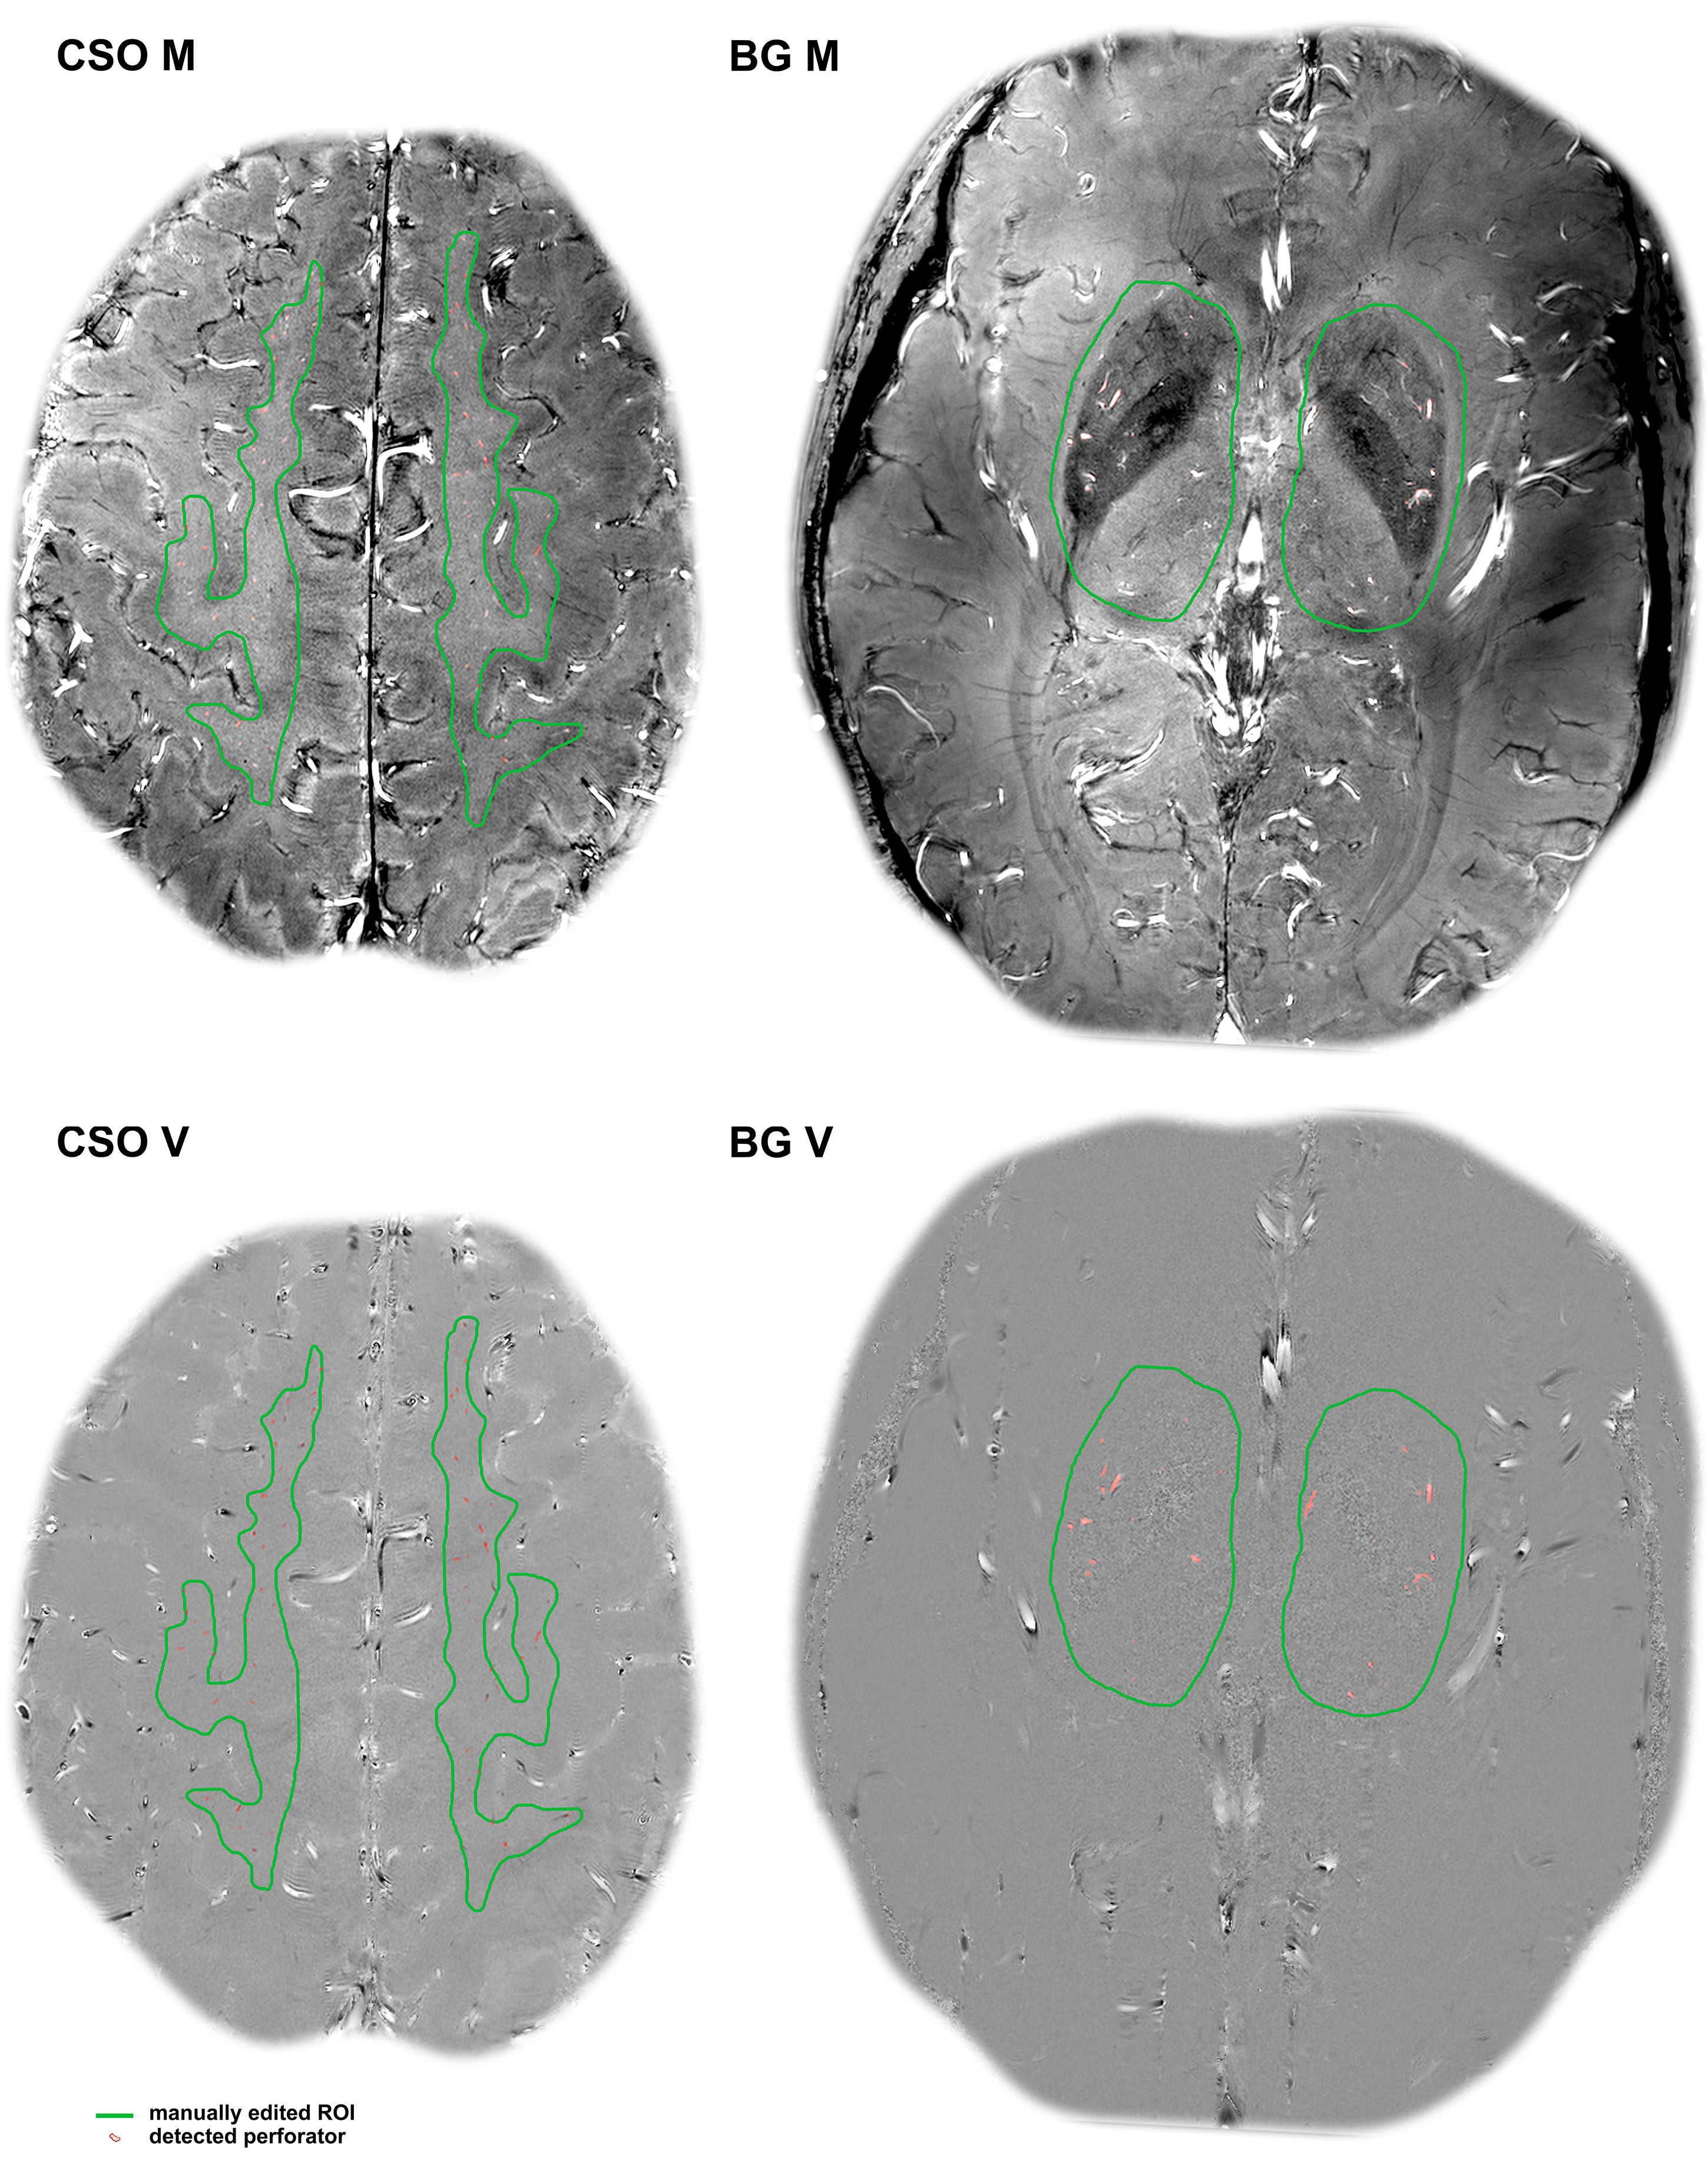
The 2D PCA images were processed and analyzed as previously published3, resulting in a number of detected perforators, their mean velocity (Vmean), and their pulsatility index ($PI = \abs{\frac{V_{max}-V_{min}}{V_{mean}}}$). Figure 1 shows the perforator detection in one subject. A linear mixed effects (LME) model5 was used to test group differences in velocity, because the velocity measurements of perforators within participants are not independent from each other.
Results
Two control participants were excluded from the study because of a chance finding of confluent white matter hyperintensities. Due to post stroke tremor, scanning errors and subject motion some acquisitions were excluded. Table 2 shows the characteristics of the included subjects.
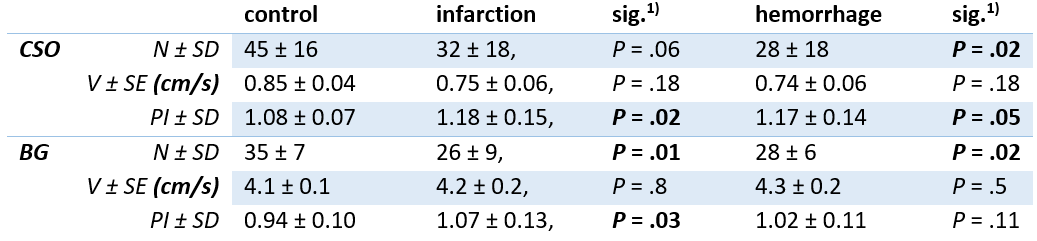
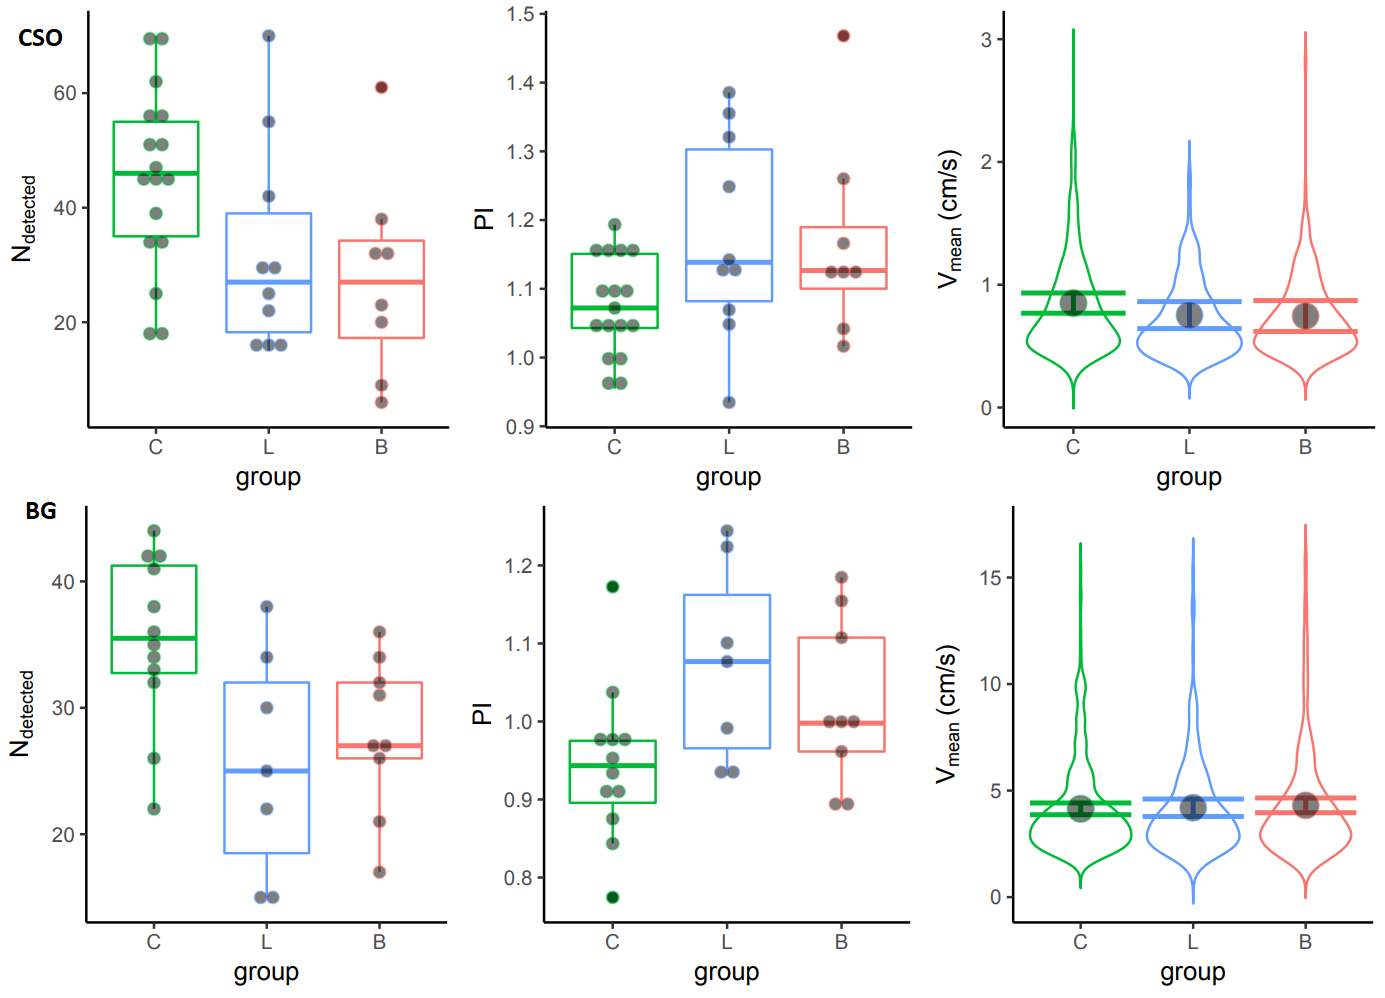
The number of detected perforators was lower in both the infarction group and the hemorrhage group, compared the control group in both the CSO and BG acquisitions. The pulsatility index was higher in both patient groups compared to the control group in both acquisitions. Most of these differences were significant. The blood flow velocity in the CSO perforators as fitted by the LME model was not different in the patient compared to the control group in either acquisition. For brevity, Table 3 shows the exact results and P values, which are visualized in Figure 2.
Discussion
The calculated pulsatility index was higher in both patient groups compared to healthy controls. In addition, less perforating arteries were detected during image processing in both patient groups compared to healthy controls. Although these differences were not significant in every acquisition, the magnitude and direction of the effects were consistent, suggesting that this could be a sample size issue. These results show that it is feasible to measure relevant hemodynamic markers in small cerebral perforating arteries. Besides that they show that there is a difference in the pulsatility index of perforating arteries between these patients and age and sex matched controls.
The consistently higher pulsatility index in the perforators of patients is in line with transcranial Doppler, which show a higher pulsatility index in the middle cerebral artery.2 An abnormal pulsatility index that persists into the microcirculation is a prerequisite for a hypothetical role of pulsatility in small vessel (dys-) function. The lower number of detected perforators in both patient groups corresponds well to the lower net cerebral blood flow found in other studies. A lower flow would cause a lower inflow enhancement effect, which means that blood spins saturate more while flowing through the imaged slice, lowering the blood signal and detectability. Counter-intuitively velocity did not differ between groups. Our measurement inherently has a detection threshold. Perforators with a blood flow velocity below the detection threshold are censored, which skews the measured velocity distribution and makes the true mean velocity unknown. Therefore, our results only compare perforators that have similar velocities.
Conclusion
This explorative study has shown that 2D phase contrast MRI at 7T is capable of measuring hemodynamic markers in two subgroups of patients with small vessel disease. In addition it has shown that there is a difference in the pulsatility index of perforating arteries between these patients and age and sex matched controls.Acknowledgements
This work was supported by the European Research Council, ERC grant agreement n° 337333 and the European Union’s Horizon 2020 research and innovation programme, grant agreement n° 666881.References
1. Wardlaw JM, Smith C, Dichgans M. Mechanisms of sporadic cerebral small vessel disease: Insights from neuroimaging. The Lancet Neurology. 2013;12(5):483–497.
2. Mitchell GF, Van Buchem MA, Sigurdsson S, Gotal JD, Jonsdottir MK, Kjartansson Ó, Garcia M, Aspelund T, Harris TB, Gudnason V, et al. Arterial stiffness, pressure and flow pulsatility and brain structure and function: The Age, Gene/Environment Susceptibility-Reykjavik Study. Brain. 2011;134(11):3398–3407.
3. Geurts L, Biessels GJ, Luijten P, Zwanenburg J. Better and Faster Velocity Pulsatility Assessment in Cerebral White Matter Perforating Arteries With 7T Quantitative Flow MRI Through Improved Slice Profile, Acquisition Scheme, and Postprocessing. Magnetic Resonance in Medicine. 2017.
4. Bouvy WH, Geurts LJ, Kuijf HJ, Luijten PR, Kappelle LJ, Biessels GJ, Zwanenburg JJM. Assessment of blood flow velocity and pulsatility in cerebral perforating arteries with 7-T quantitative flow MRI. NMR in Biomedicine. 2016;29(27 april):1295–1304.
5. Lindstrom MJ, Bates DM. Newton-Raphson and EM Algorithms for Linear Mixed-Effects Models for Repeated-Measures Data. Journal of the American Statistical Association. 1988;83(404 dec. 1988):1014–1022.
Figures