1144
Phase-contrast MRI for estimating global cerebral blood flow of mice at 11.7T: optimization and age-dependence1Department of Radiology and Radiological Science, Johns Hopkins University, Baltimore, MD, United States, 2F.M. Kirby Research Center for Functional Brain Imaging, Kennedy Krieger Research Institute, Baltimore, MD, United States, 3Department of Electronic Science, Xiamen University, Xiamen, Fujian, China, 4Department of Biomedical Engineering, Johns Hopkins University, Baltimore, MD, United States
Synopsis
Cerebral blood flow (CBF) is a crucial physiological parameter reflective of brain functioning and metabolism. In this study, our goal was to systematically optimize a phase-contrast (PC) quantitative flow technique for CBF assessment in mice. We also demonstrated the sensitivity of this technique to longitudinal CBF changes in aging. This optimized PC protocol may serve as a helpful non-invasive tool for CBF measurement in preclinical studies of brain physiology and pathophysiology with mouse disease models.
Purpose
Research studies on mouse models often require the alterations of mouse brain physiology, such as injection of novel “smart” contrast agents, administration of new pharmacological compounds, and introduction of specific brain diseases via genetic or surgical means. While structural MRI has been used extensively in such studies, surprisingly little attention has been directed toward physiological effects of these interventions and treatments. Cerebral blood flow (CBF) is one of the most fundamental physiological parameters of the brain. Since all contrast agents and drugs are delivered to the brain by blood, assessment of CBF is important in evaluating the efficacy of such agents. CBF may also provide an early index of toxicity in that it will inform us about the extent to which the agent has altered physiology. Additionally, CBF is a potential diagnostic marker in brain diseases. In this study, our goal was to systematically optimize a phase-contrast (PC) quantitative flow technique for CBF assessment in mice. We also demonstrated the sensitivity of this technique to longitudinal CBF changes in aging.Method
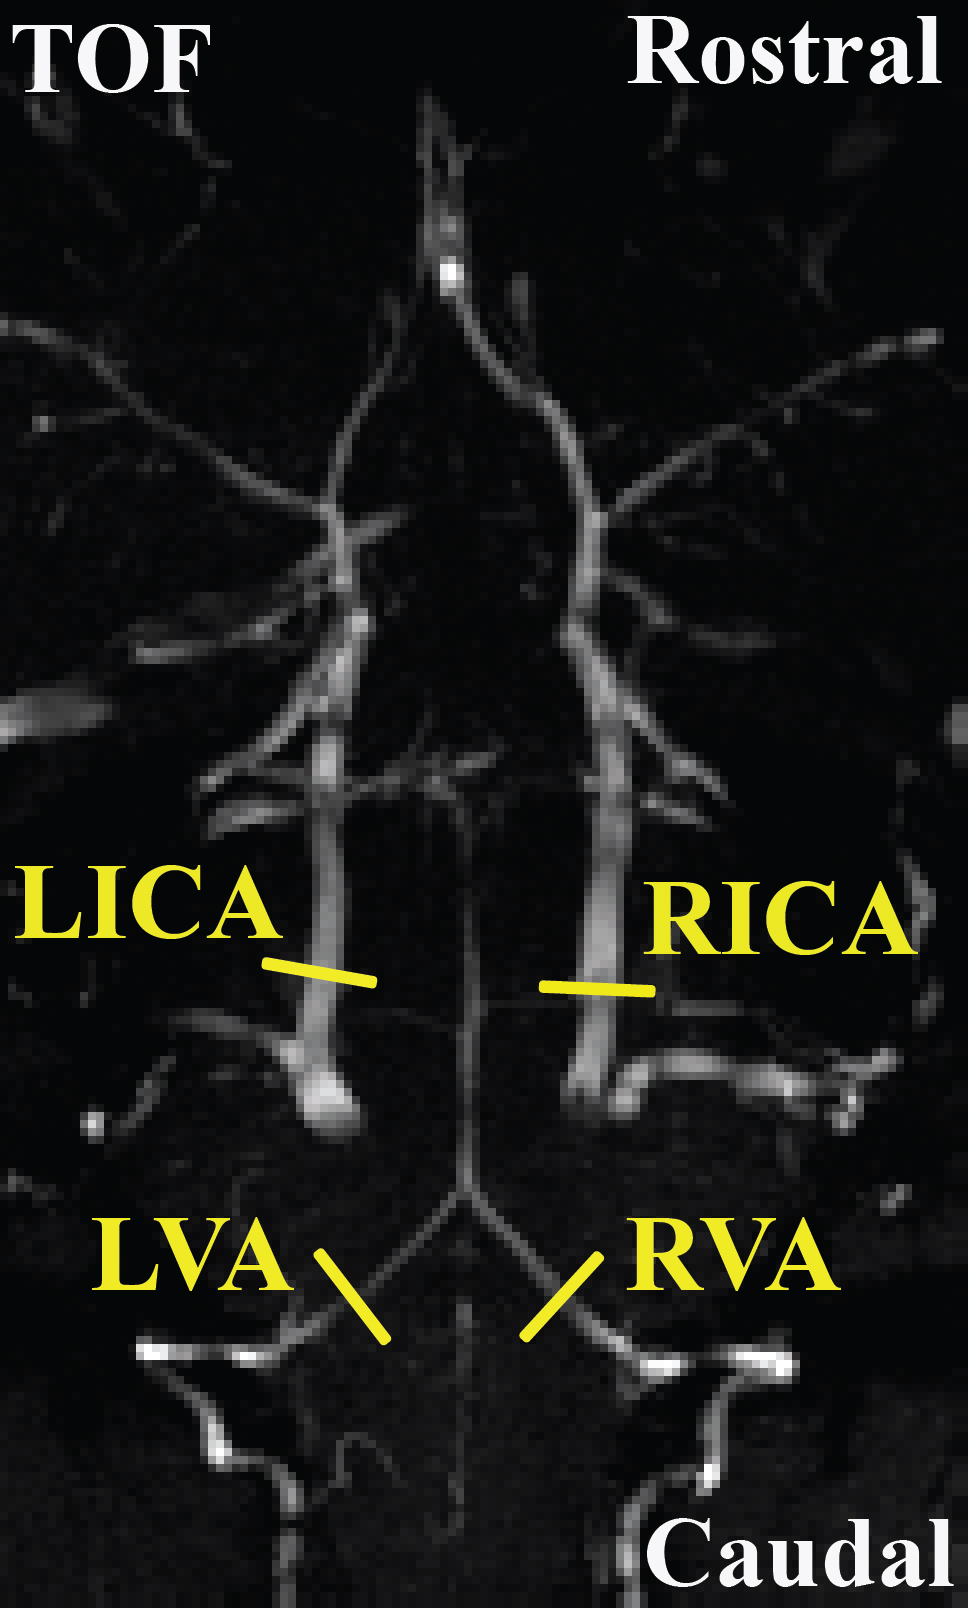
All experiments were performed on a Bruker 11.7T system with institutional animal committee approval. A time-of-flight (TOF) angiogram was first performed to visualize the feeding arteries of the brain, i.e. left and right internal carotid arteries (ICA) and vertebral arteries (VA) (Figure 1). PC MRI was then performed on each of these four arteries with slices placed perpendicular to the flow directions (Figure 1), the sum of which yields the whole-brain CBF. Three sub-studies were performed to identify the optimal parameters for PC MRI in mouse. An additional study was performed to demonstrate the sensitivity of the technique in a longitudinal study of aging. Study I conducted measurement of typical flow velocity in mouse ICA and VA in order to determine the optimal encoding velocity (Venc) in PC MRI (N=3). Study II performed optimization of in-plane spatial resolution by comparing PC MRI at spatial resolutions of 80, 60, 50, and 40 μm (N=5). To shorten scan time, Study III implemented a reduced FOV scheme to allow certain degree of fold-over along the phase-encoding direction while not affecting the vessel of interest. The sequence with reduced FOV (10×15 mm2) was compared with a full FOV of 15×15 mm2 (N=5). In Study IV, we conducted a longitudinal aging study in 5 mice (from 13 to 30 weeks old, 5 time points with an interval of 1 month) (N=5). Brain volume at each time point was also obtained using a T2w sequence, which allowed the calculation of unit-volume CBF. For all PC experiments, other imaging parameters were: TR/TE=60/3.1ms, slice thickness=0.5mm, average number=4, flip angle=25º.Results and Discussion
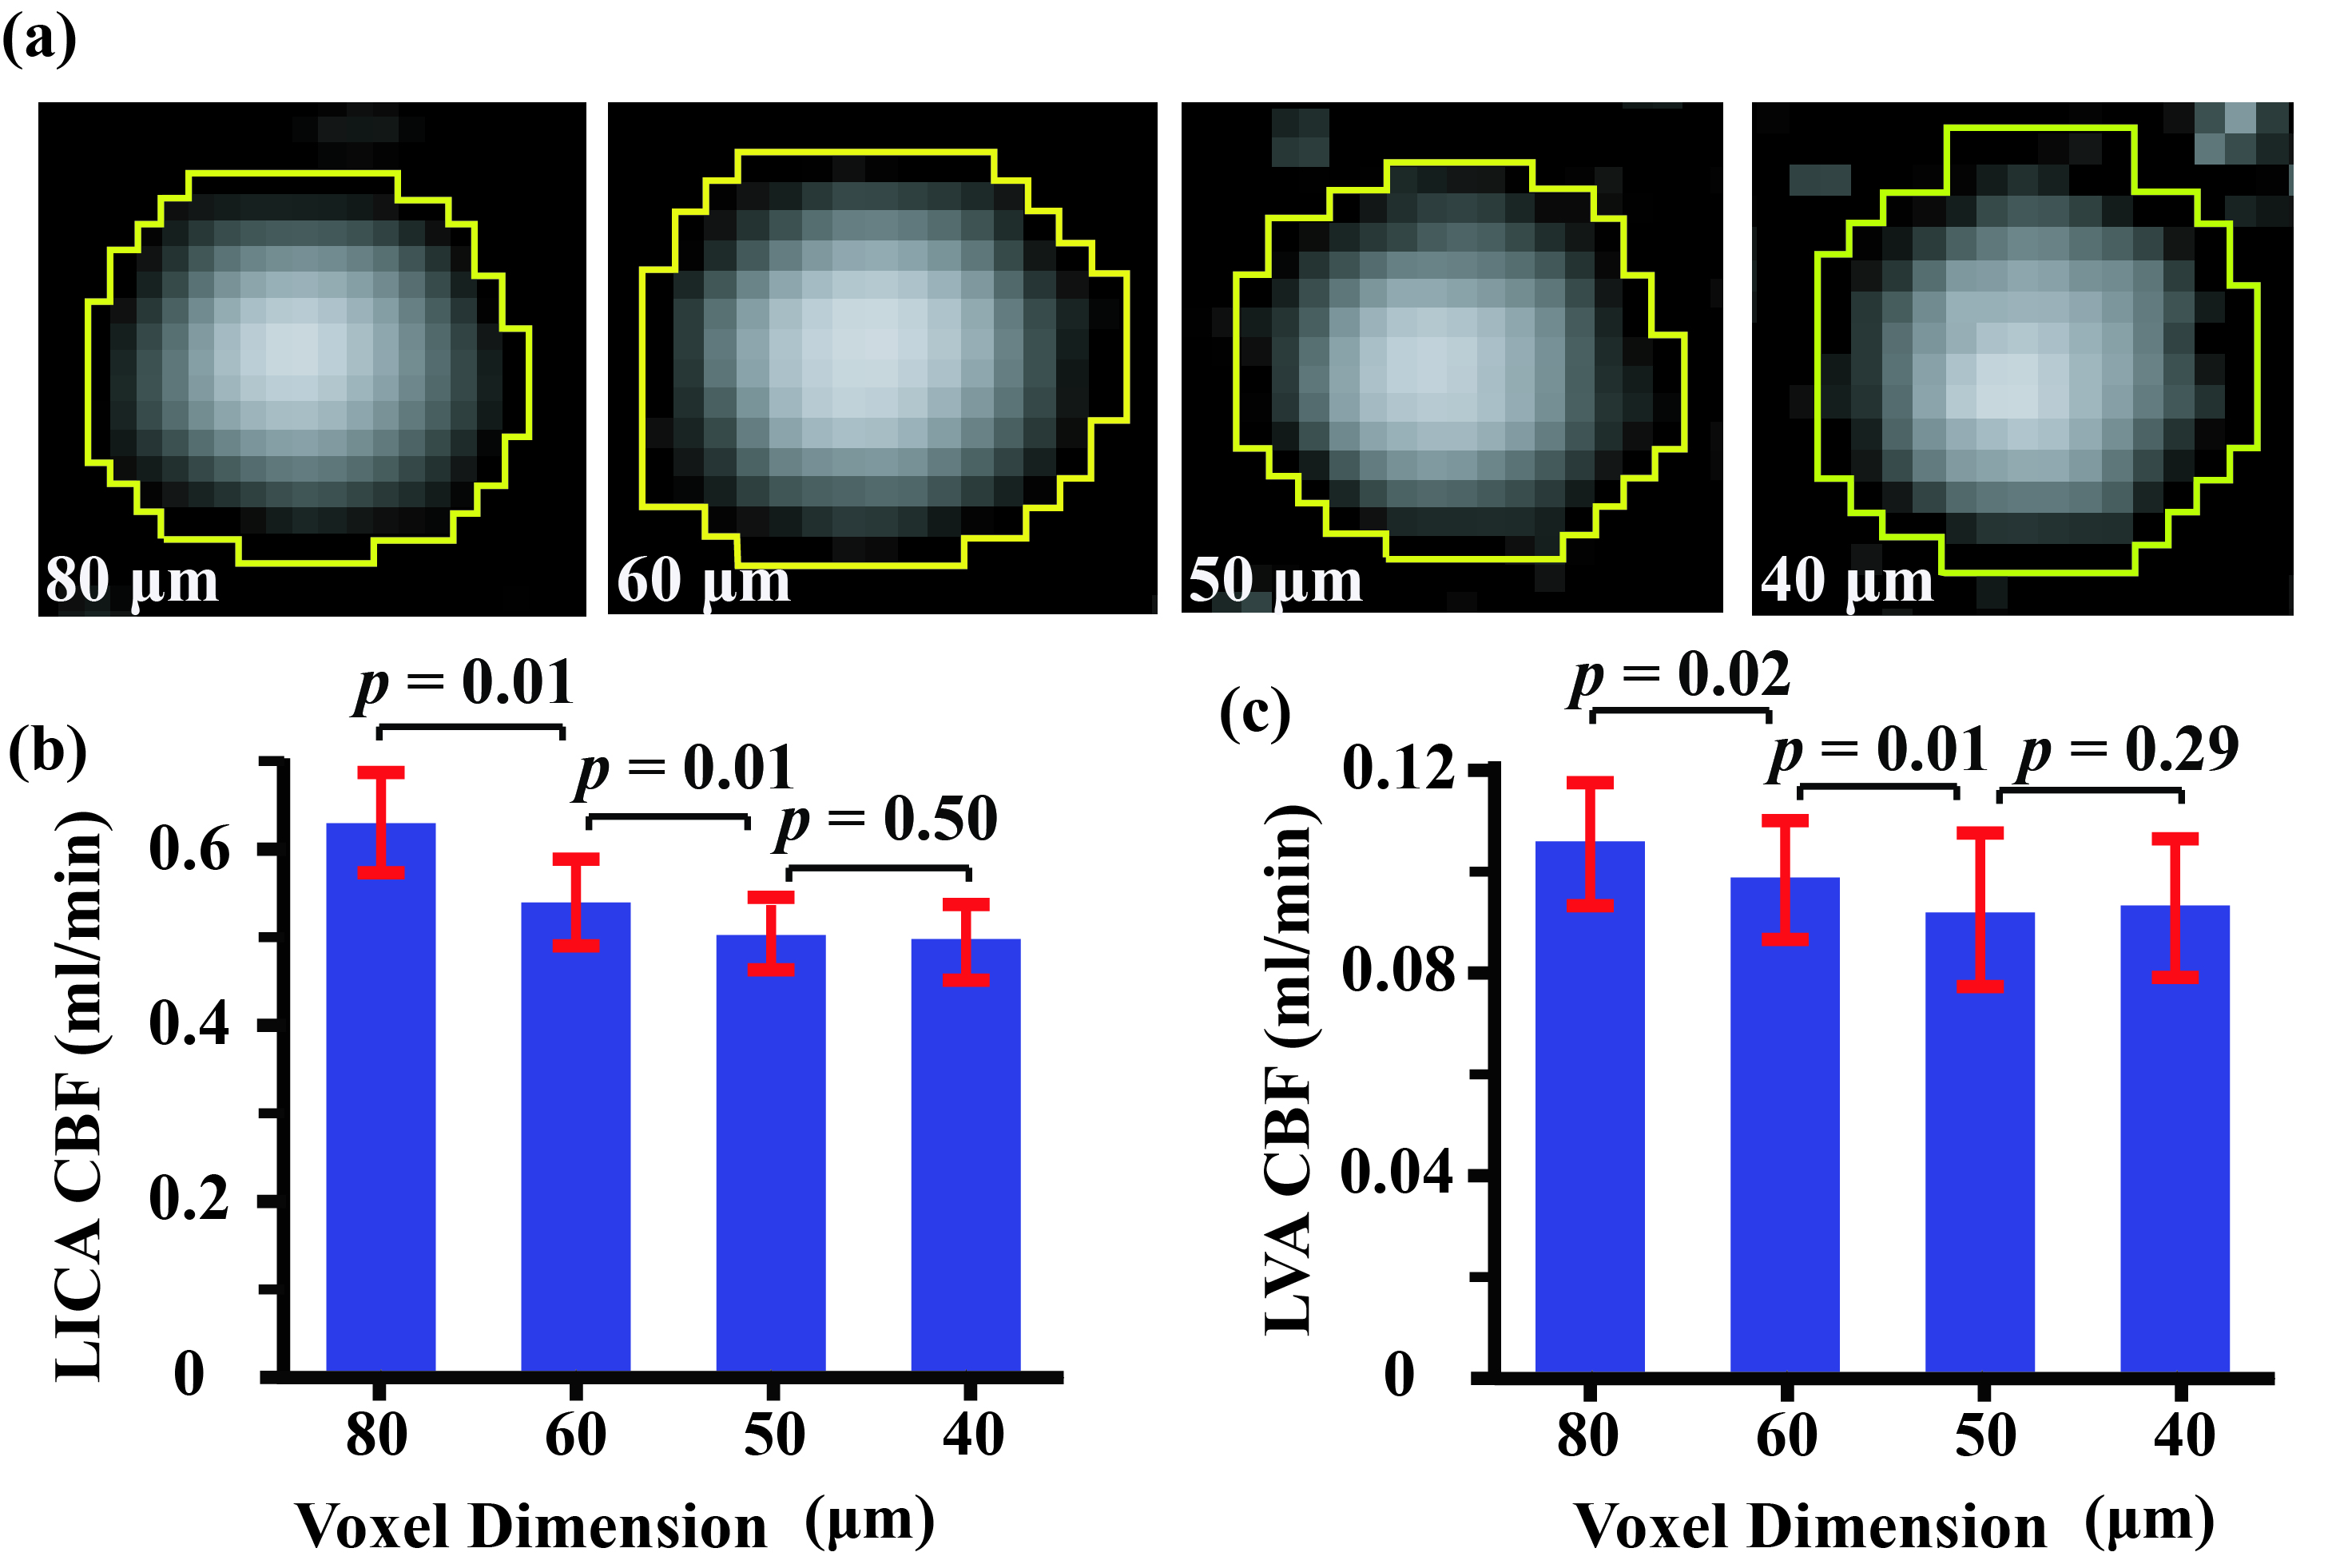
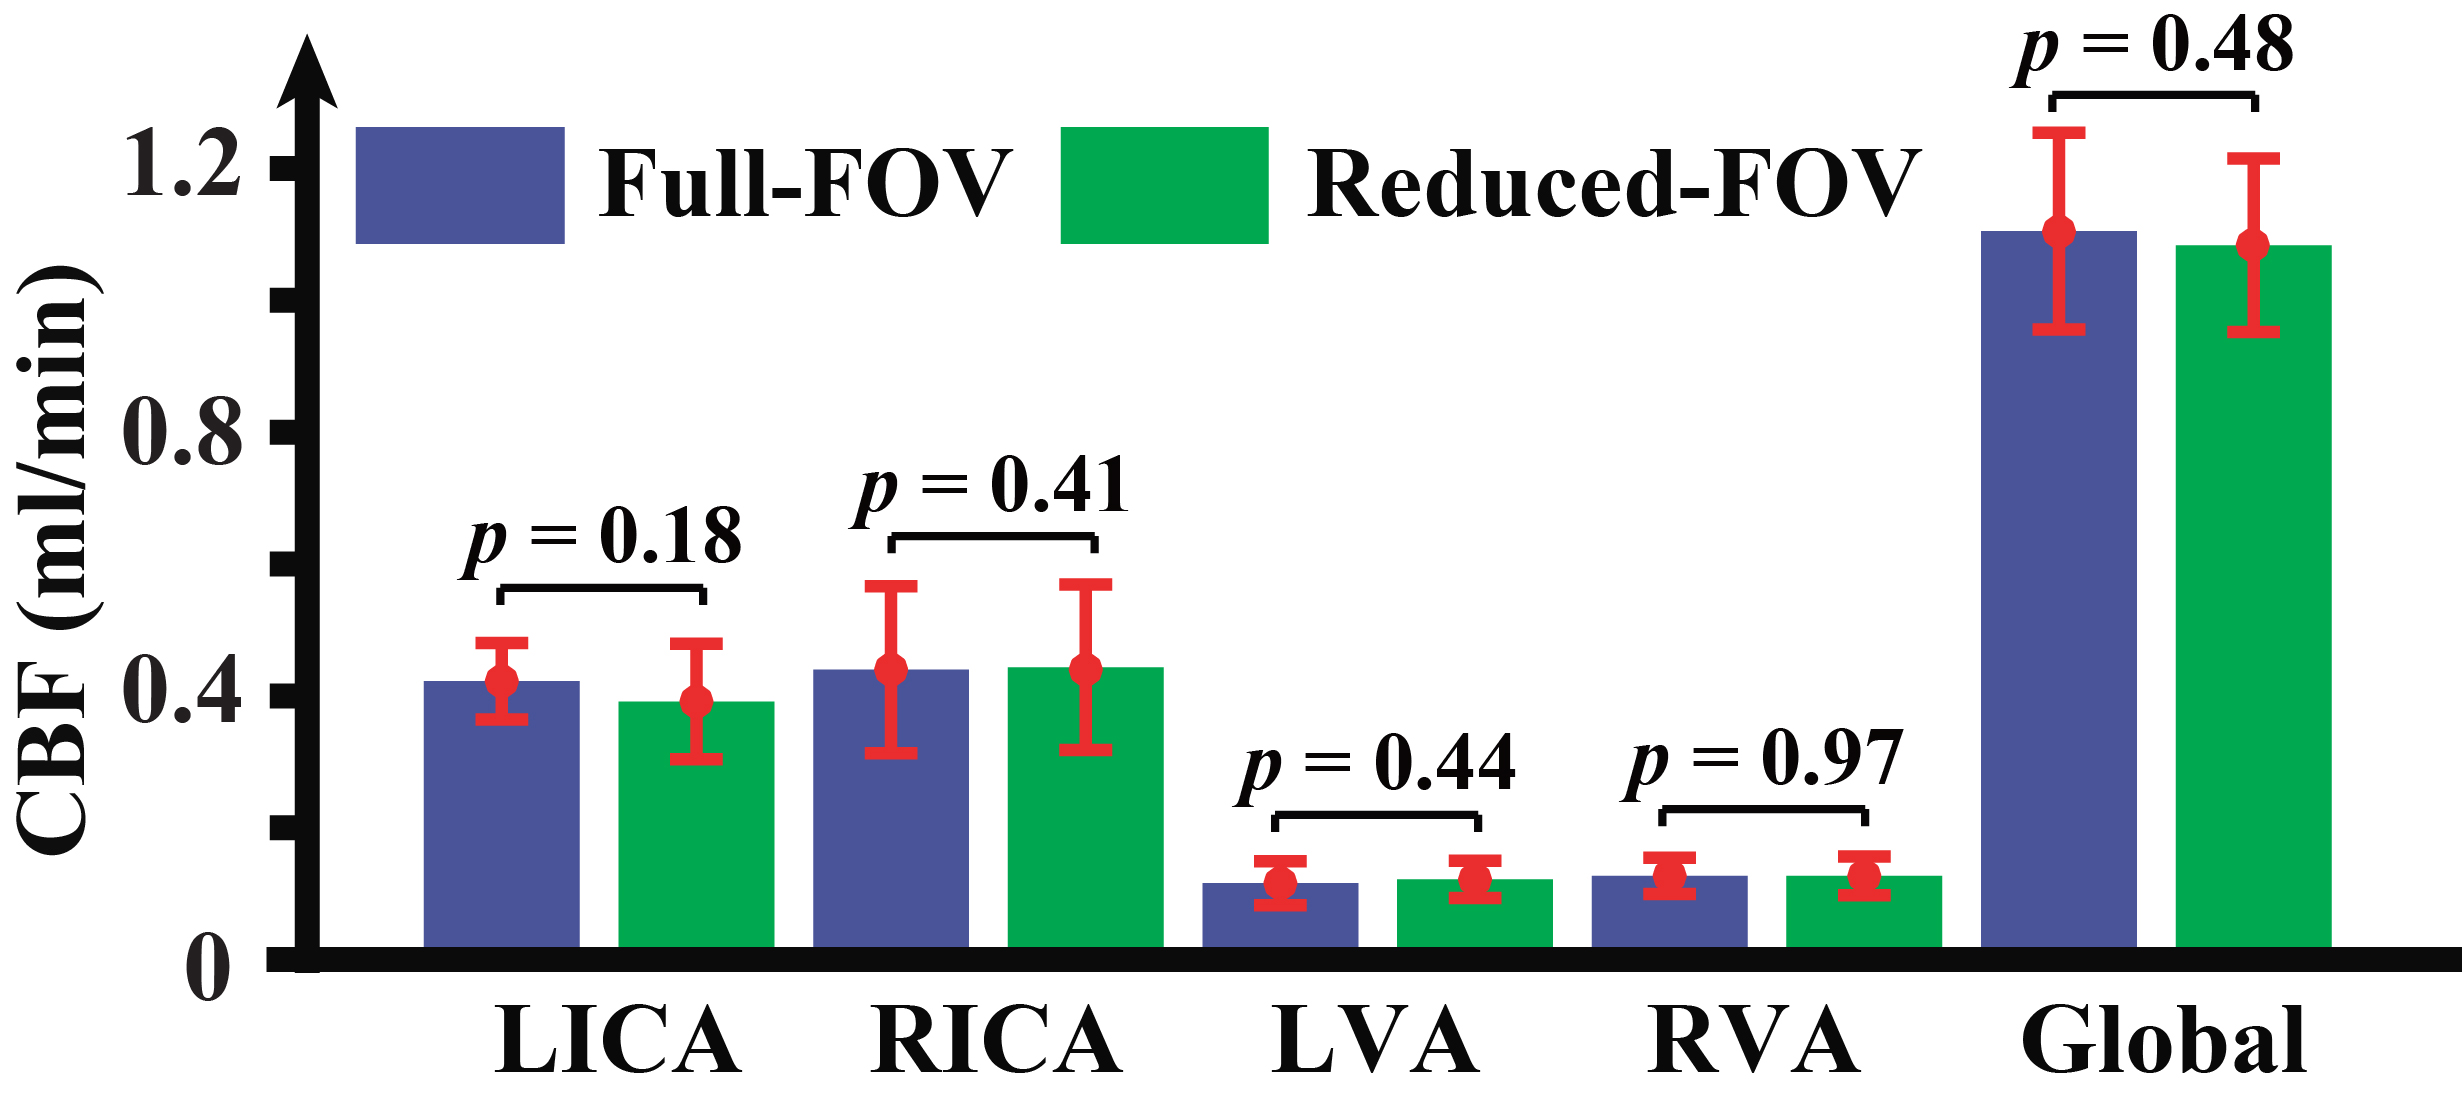
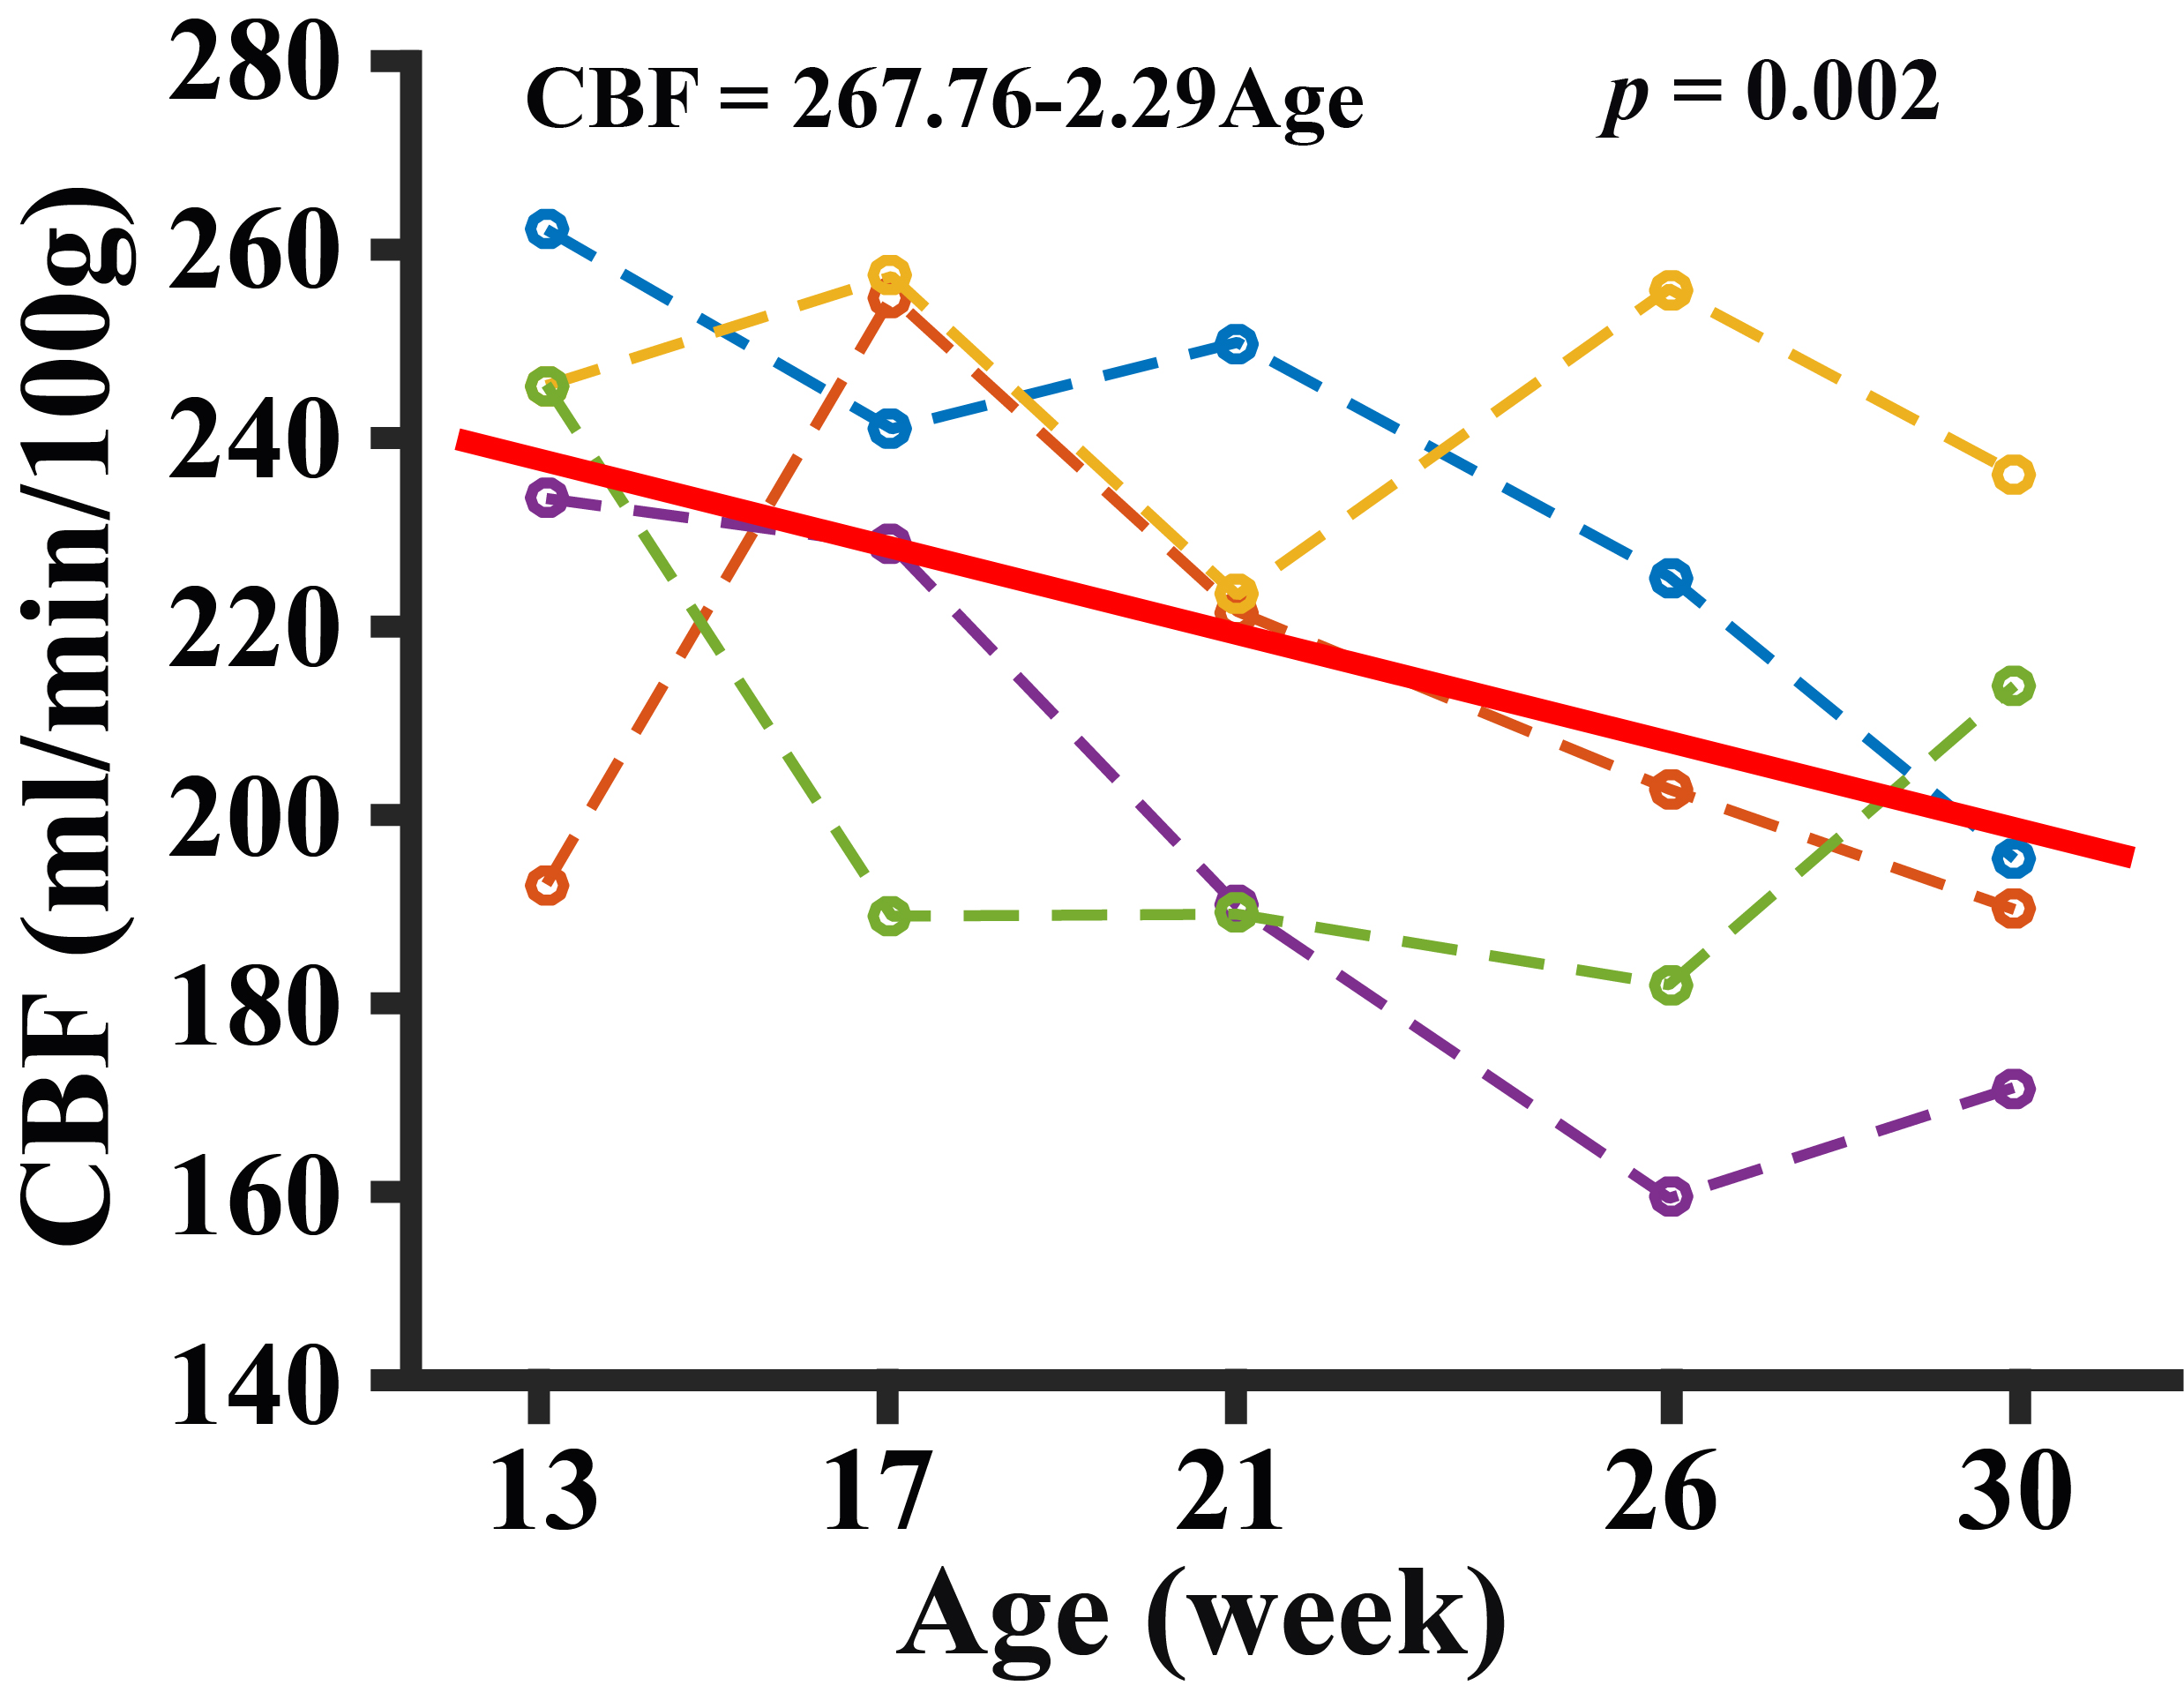
(Study I) Peak blood flow velocities in the four feeding arteries were 13.8±1.7, 14.4±0.6, 6.5±1.7, and 6.7±1.3 cm/s, respectively, with ICA showing a significantly higher (p=0.002) velocity than VA. Based on these observations, Venc of ICA and VA was chosen to be 20 and 10cm/s, respectively, for later studies. (Study II) Figure 2 shows PC MRI using different resolutions. Larger voxel-size results in over-estimation in CBF while smaller voxel-size is associated with long scan time. A voxel-size of 50 μm was considered optimal for both vessels. At this spatial resolution, test-retest reproducibility studies suggested that the coefficient-of-variation (CoV) of the ICA CBF was 3.5±1.8% and that of the VA was 2.6±1.9%. (Study III) Figure 3 shows CBF measured using the reduced-FOV and full-FOV schemes. Note that no significant difference in CBF was found, while the scan duration of the reduced-FOV scheme (1min52sec) is considerably shorter than that of the full-FOV scheme (2min48sec). (Study IV) Figure 4 shows longitudinal changes in global CBF over a 17 week period in each animal. Linear mixed-effect analysis revealed a significant decrease in CBF with age (p=0.002), consistent with human reports.1,2 Our results suggest that, within the age range of 13-30 weeks, mouse CBF decreases by 2.3 ml/100g/min per week, which is equivalent to 1% per week. For reference, human studies found that CBF decreases by 1.8-3% per decade on average over the lifespan.2Conclusion
We have conducted a systematic study to optimize the PC MRI technique for measuring mouse CBF at 11.7T, which may provide a useful tool for evaluating brain physiology in studies of animal models.Acknowledgements
No acknowledgement found.References
1. Lu H, Xu F, Rodrigue K, et al. Alterations in cerebral metabolic rate and blood supply across the adult lifespan. Cereb. Cortex 2011; 21:1426-1434.
2. Peng S, Dumas J, Park D, et al. Age-related increase of resting metabolic rate in the human brain. NeuroImage 2014; 98:176-183.
Figures