1141
Association between Gray Matter alterations and CSF biomarkers in amnestic MCI patients1Center for Mind/Brain Sciences-University of Trento, Trento, Italy, 2Department of Psychology and Cognitive Science-University of Trento, Trento, Italy, 3IRCCS Istituto Centro San Giovanni di Dio Fatebenefratelli, Brescia, Italy, 4Service of Statistics, IRCCS Fatebenefratelli, Brescia, Italy, 5IRCCS, Istituto di Ricerche Farmacologiche Mario Negri, Milano, Italy, 6Department of Physiology and Pharmacology, University of Rome, Rome, Italy, 7Sapienza University of Rome, Rome, Italy, 8Aix-Marseille Universitè, Marseille, France, 9Alzheimer’s Disease Unit and Other Cognitive Disorders Unit, Hospital Clinic de Barcelona, Barcelona, Spain, 10University of Genoa, Genoa, Italy, 11Lab of Clinical Neurochemistry, University of Perugia, Perugia, Italy, 12INSERM, Imagerie Cerebrale et Handicaps Neurologiques, Toulouse, France, 13Catholic University, Policlinico Gemelli, Rome, Italy, 14University of Leipzig, Leipzig, Germany, 15Fondazione SDN per la Ricerca e l’Alta Formazione in Diagnostica Nucleare, Naples, Italy, 16Aristotle University of Thessaloniki, Thessaloniki, Greece, 17Alzheimer Center, Amsterdam Neuroscience, VU University Medical Center, Amsterdam, Netherlands, 18VU University Medical Center, Amsterdam, Netherlands, 19University Medical Center, Goettingen, Georg-August-University, Goettingen, Germany, 20Service de Pharmacologie-Hôpital Huriez-CHRU, Lille, France, 21GSK, Neurosciences Therapeutic Area, Brentford, United Kingdom, 22Mediterranean Institute of Cognitive Neurosciences, Marseille, France, 23Memory Clinic and LANVIE - Laboratory of Neuroimaging of Aging, University Hospitals and University of Geneva, Geneva, Switzerland, 24Laboratory of Alzheimer’s Neuroimaging and Epidemiology - LANE, IRCCS Institute - The Saint John of God Clinical Research Centre, Brescia, Italy
Synopsis
In this study the association between CSF and structural imaging based early biomarker of Alzheimer Diasease (AD) was investigated in amnestic Mild Cognitive Impairment (aMCI) patients. Voxel based morphometry and partial least square correlation were used to analyze differences in local and whole brain GM profiles (covariance) between two groups of aMCI patients divided in two groups based on CSF amyloid (Aβ42) levels. Both voxel-wise and structural covariance GM differentiated Aβ positive (prodromal AD) from Aβ negative patients. These results indicate that GM measures may provide a sensitive metric for tracking AD progression.
Introduction
The identification of biomarkers for early diagnosis of Alzheimer Disease (AD) is of considerable research interest1. In order to investigate the relationship between Cerebro-Spinal Fluid (CSF) and structural imaging biomarkers of early AD in this multisite study we compared local and distributed gray matter (GM) differences between two groups of anamnestic mild cognitive impairment (aMCI) divided into two groups based on baseline CSF amyloid (Aβ 42) levels.Methods
Participants: 144 aMCI patients enrolled in 13 European clinical sites in
the IMI WP5 PharmaCog (also referred to as the European ADNI study). They
were classified (high risk, n=81) or not (low risk, n=63) as Prodromal AD depending
on whether their Aβ42 CSF level were low (Aβ positive) or high (Aβ negative)2 .The two groups were age and gender matched3.
Image acquisition: T1-weighted images were acquired on 3.0 T scanners of different MRI system vendors and models using either a MPRAGE (Siemens and Philips) or a IR-SPGR (GE) sequence with the following acquisition parameters: 3D sagittal acquisition, square FOV=256 mm, 1 × 1 × 1 mm3, TR/TI=2300/900 ms, flip angle = 9°, no fat suppression, full k-space, no averages4.
Image preprocessing: The CAT tool in SPM 12 was used for segmentation/normalization. Images were first segmented into GM, white matter, and cerebrospinal fluid. Quality control procedures were conducted prior to subsequent steps to check for inhomogeneities and general quality of the segmentation and no images were discarded. Subsequently GM maps were aligned to a standard DARTEL template in MNI space, modulated and smoothed to 8 mm FWHM.
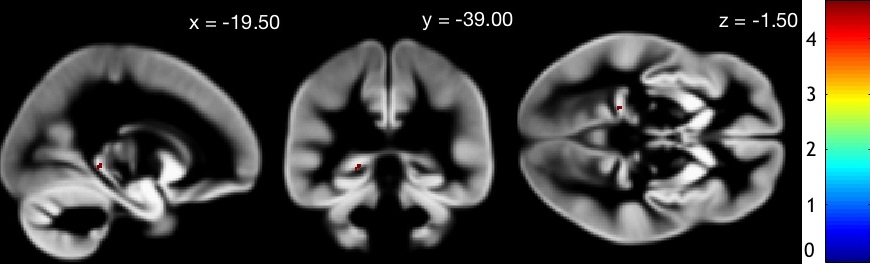
Voxel based morphometry (VBM): A two independent samples T-test was run to assess voxel-wise differences in GM between the two groups of amnestic MCI patients (high risk and low risk). Age and total intracranial volume were included as covariates. Only voxels with absolute value above 0.2 were selected to be included in the analysis. A voxel-level threshold of p<0.05 family-wise error corrected (FWE) was considered for statistical significance.
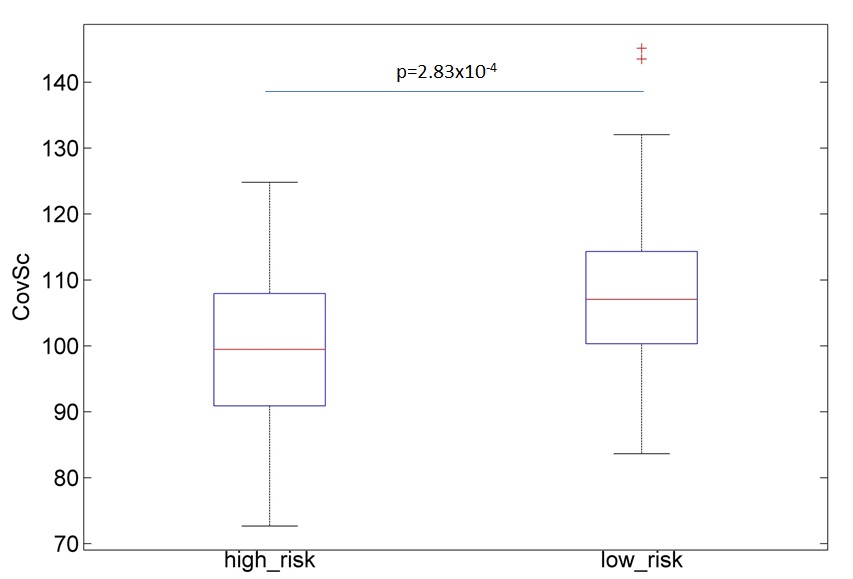
Structural Covariance Analysis: In order to detect whole brain structural covariance differences between high and low risk patients a mean centered partial least square correlation (PLS) was performed (PLSgui version 6.13 on MATLAB, 2013): this methods allows to first construct the structural covariance matrix of GM for the whole dataset and then to derive individual participant’s score (CovSc) reflecting how much of the covariance pattern is present in each brain image. Therefore we calculated and compared using a two sample independent test the CovSc between our two groups of aMCI patients. Being a multivariate methods PLS offers the advantage of testing all brain voxels together and does not require multiple comparison correction.
Results
High risk patients had lower GM in comparison with low risk patient in a region identified as left paraHippocampal gyrus in the Automatic Anatomical Labeling Atlas (Figure 1). The CovSc derived running the PLS correlation were statistically significantly different (t=3.72, p=2.83x10⁻⁴) between the low risk (107.4±13.2) and the high risk (99.7±11.7) group thus indicating that these two populations are characterized by different whole brain GM covariance patterns (Figure 2).Discussion and Conclusions
The results of this study demonstrated both local and whole brain distributed GM differences between MCI patients with different amyloid β peptide profiles. In particular, the whole brain GM covariance signature of the prodromal AD group indicates that, in agreement with findings of different neuroimaging studies5,6, whole brain network metrics may provide sensitive markers to track progression of AD.Acknowledgements
The research leading to these results was conducted as part of the PharmaCog consortium funded by the European Community's Seventh Framework Programme for the Innovative Medicine Initiative under Grant Agreement n°115009 (www.alzheimer-europe.org).References
- http://www.imi.europa.eu/content/pharma-cog
- Morizzoni M, Ferrari C, Galluzzi S et al. CSF Biomarkers and Effect of Apolipoprotein, Genotype, Age and Sex on Cut-off Derivation in Mild Cognitive Impairment. Alzheimer's & Dementia, 13:7, Supp. July 2017, P1319
- Galluzzi S, Marizzoni M, Babiloni C et al. Clinical and biomarker profiling of prodromal Alzheimer’sdisease in workpackage 5 of the Innovative MedicinesInitiative PharmaCog project: a ‘European ADNI study. J Intern Med. 2016 Jun;279(6):576-91
-
Jovicich J, Marizzoni
M, Sala-Llonch R et al. Brain morphometry reproducibility in
multi-center 3T MRI studies: a comparison of cross-sectional and longitudinal segmentations. Neuroimage. 2013 Dec;83:472-84
- Weiner MW, Veitch DP, Aisen PS et al. Recent publications from the Alzheimer's Disease Neuroimaging Initiative: Reviewing progress toward improved AD clinical trials. Alzheimers Dement. 2017 Apr;13(4):e1-e85
- Yu M, Gouw AA, Hillebrand A et al. Different functional connectivity and network topology in behavioral variant of frontotemporal dementia and Alzheimer's disease: an EEG study. Neurobiol Aging. 2016 Jun;42:150-62.
Figures