1140
Optic Nerve Sheath Volume Changes Acutely in Response to Intracranial Pressure Change after Lumbar Puncture and CSF Drainage1Radiology and Imaging Sciences, Emory University, Atlanta, GA, United States
Synopsis
This study used 3D, T2W imaging of the brain to evaluate the optic nerve sheath (ONS) in 10 patients with idiopathic intracranial hypertension (IIH). Patients were imaged pre- and immediately post-lumbar puncture/CSF drainage. Images were reformatted to be perpendicular to the optic nerve and the volume of the ONS pre- and post-lumbar puncture was calculated. The study found that ONS volume decreased significantly within an 82 minute window in response to a reduction in CSF pressure, and this change can be quantitatively evaluated using MRI.
Introduction
Idiopathic Intracranial Hypertension (IIH) is a condition whose symptoms include headaches and blurry vision. Abnormally high cerebrospinal fluid (CSF) pressure in the intracranial space of these patients causes morphological changes in the optic nerve and optic nerve sheath (ONS). A previous study found that humans subjected to varying pressure environments showed similar vision problems as those with IIH [1]. For example, astronauts who have been exposed to extended microgravity show morphological changes that are similar to those seen in IIH patients, including increased ONS diameter, posterior globe flattening, and optic nerve protrusion. Current treatment for IIH involves drainage of the CSF through lumbar puncture to reduce intracranial pressure and medication to decrease CSF production. A previous retrospective study showed a correlation between ONS diameter and CSF pressure; as CSF pressure increased, ONS diameter increased [2]. The goal of the current study was to conduct a prospective MRI study where the brain and ONS were imaged immediately pre- and post-lumbar puncture/CSF drainage and evaluate the acute change in ONS volume due to the reduction in pressure. We hypothesized that the decrease in intracranial pressure post lumbar puncture/CSF drainage would result in a decrease in ONS volume.Methods
The imaging protocol included a 3D, T2-weighted image stack acquired over the entire brain on a 3 Tesla MRI scanner (Siemens Trio, Erlangen Germany). Ten (10) patients diagnosed with IIH (age 28.1+/- 5.5) were imaged prior to and after CSF drainage. Image resolution was 0.8 x 0.8 x 1.1 mm. Images were acquired using the exact same protocol before and after lumbar puncture/CSF drainage, and the average time between the lumbar puncture/CSF drainage and post-lumbar puncture scans was 63 minutes. Opening and closing CSF pressure and the volume of CSF removed was recorded. The 3D image set was sliced to create multi-planar reformatted image slices aligned along the optic nerve of each eye starting from the vitreoretinal interface going posteriorly at least 4 mm (Medixant, Poznan, Poland). These images allowed creation of cross-sectional slices perpendicular to the optic nerve sheath for subsequent measurements, figure 1. Images were created at 0.8 mm intervals. Five image slices along each optic nerve (left and right) were obtained, and images were imported into ImageJ software (NIH, Bethesda, Maryland). . A region of interest (ROI) was traced in around the optic nerve sheath area (ONSA) for each of the 5 images along each optic nerve. The ONSA over the five slices was summed and multiplied by slice thickness to create an optic nerve sheath volume (ONSV) for each eye in each patient, before and after lumbar puncture/CSF drainage. The ONSV were compared before and after lumbar puncture/CSF drainage using a paired t-test.Results
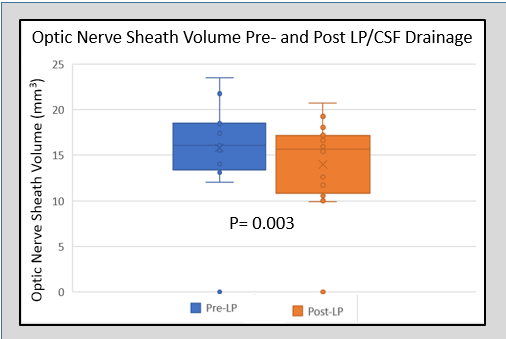
In 15/20 reformatted optic nerve datasets image quality was adequate for analysis. Motion artifacts corrupted five datasets. Pressure before the lumbar puncture was 36 +/- 5 mmHg, and pressure after lumbar puncture/CSF drainage was 17 +/- 2 mmHg, and the volume of CSF removed was 15 +/- 2 cc. In 14 of 15 datasets, ONSV volume decreased after lumbar puncture/CSF drainage. Average decrease in ONSV was -11.3% +/- 1.9% across the subjects (16.9 +/- 3.5 mm3 vs. 14.9 +/- 3.0 mm3, respectively, p=0.003), figure 2.Discussion
The major finding in this study was that ONSV decreases acutely (within a 62 minute window) in response to a reduction in CSF pressure, and this change can be quantitatively evaluated using MRI. This is the first study using a specific patient group with elevated CSF pressure that has shown that changes in pressure can influence morphological changes in optic nerve sheath properties over a short time frame. The finding that changes occur acutely has two important repercussions. First, it shows that changes in CSF pressure (such as those induced by gravitational or posture changes) will acutely change ONSV. Therefore, maneuvers such as the 15-degree head-down tilt test used to simulate microgravity can have rapid effects on ONSV. Second, if the pressure changes due to CSF removal are known and the geometry change is quantified, one can use inverse methods to estimate patient-specific material properties of the ONS. This is important in biomechanics modelling and has never been previously evaluated in-vivo.Conclusion
This study showed that changes in the optic nerve sheath resulting from a reduction in CSF pressure after lumbar puncture/CSF drainage can be quantified by MRI, and the decrease in CSF pressure results in a significant, acute decrease in the volume of the optic nerve sheath.Acknowledgements
No acknowledgement found.References
[1] Kramer, L. A., Sargsyan, A. E., Hasan, K. M., Polk, J. D., & Hamilton, D. R. (2012). Orbital and Intracranial effects of Microgravity: Findings at 3-T MR imaging. Radiology, 263(3), 819–827. doi:10.1148/radiol.12111986
[2] Shofty, B., Ben-Sira, L., Constantini, S., Freedman, S., & Kesler, A. (2011). Optic nerve sheath diameter on MR imaging: Establishment of norms and comparison of pediatric patients with Idiopathic Intracranial hypertension with healthy controls. American Journal of Neuroradiology, 33(2), 366–369. doi:10.3174/ajnr.a2779
Figures