1139
Cine MRI assessment of carotid artery pulse wave velocity and reflected wave amplitude in children with sickle cell disease1SickKids Hospital, Toronto, ON, Canada, 2University of Toronto, Toronto, ON, Canada
Synopsis
The mechanical and morphological properties of the cerebral vasculature can be studied by measuring blood flow dynamics of the feeding arteries. In this study, we used high resolution phase contrast MRI to measure the blood flow and vessel area of the common carotid arteries of children with and without sickle cell disease (SCD). Preliminary results show that pulse wave velocity and wave reflection is significantly higher in patients with SCD, suggesting increased vessel stiffness and downstream abnormalities in the vasculature. This method is clinically feasible and may provide useful insight into the vascular properties of children with cerebrovascular disease.
Introduction
The cerebral microvasculature has the vital role of changing cerebral blood flow (CBF) in response to alterations in metabolic demand. In cerebrovascular diseases such as sickle cell disease (SCD), this function is impaired, resulting in an increased risk of hypoxic injury in the brain [1]. A potentially valuable approach to assess the microvasculature involves measuring the flow properties within larger feeding arteries. By quantifying the time-varying blood flow and cross-sectional area of the common carotid artery (CCA) across a cardiac cycle, parameters such as pulse-wave velocity (PWV) and wave reflection coefficient (Γ) can be derived [2,3]. PWV describes the propagation speed of pressure waves and is related to the mechanical characteristics of the vessel walls. When these waves encounter a downstream change in vessel morphology, a partial reflection is generated, which can be characterized as Γ. In this study, we used cine MRI to characterize the vessel and flow properties of the CCA in children with SCD and healthy controls. We hypothesize that the PWV and Γ in patients with SCD will be higher than in controls due to reduced vessel compliance and abnormalities in the microvasculature.Methods
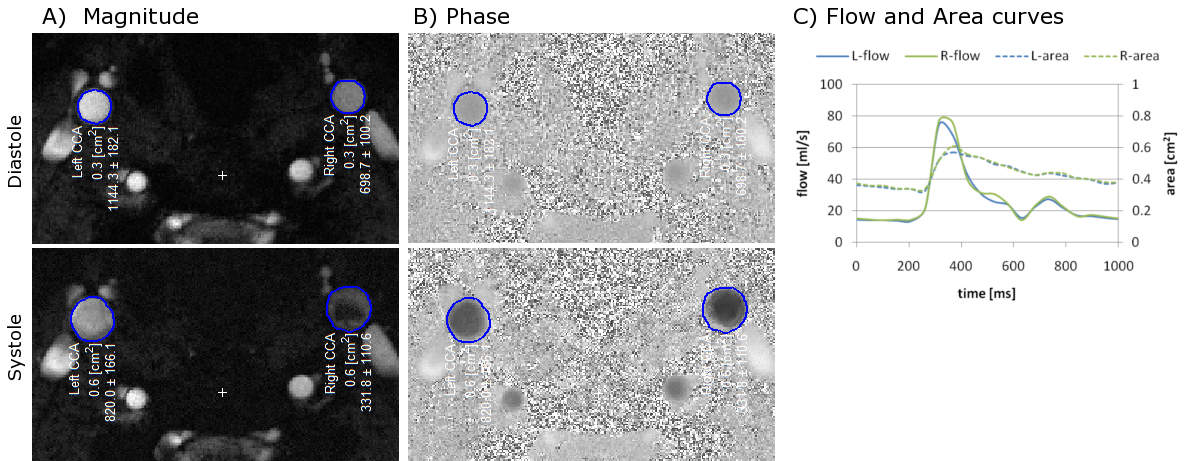
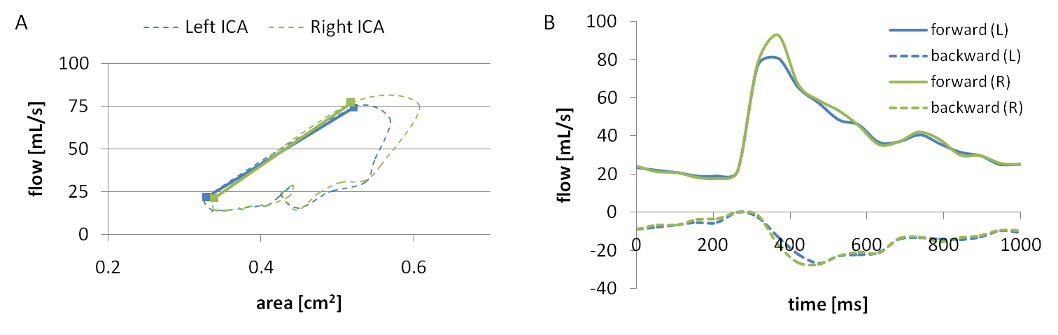
Six pediatric patients with SCD (14.5±2.3 years; 4 females, 2 males) and 3 age-matched healthy volunteers underwent imaging on a 3T clinical MRI system (Siemens Healthcare, Germany). The protocol included a high resolution phase contrast MRI (PCMRI) sequence to quantify intravascular flow and vessel size, in addition to standard structural imaging (T1, T2, diffusion). The PCMRI scan consisted of a single slice radial acquisition perpendicular to the CCA with the following parameters: TR/TE = 24.3/8.1 ms, voxel = 0.29×0.29 mm, FOV = 130×130 mm, slice = 5 mm, FA = 30°, phases = 20, Venc = 100cm/s, spokes=16000, time = 6.5 min. The acquisition strategy was adapted from real-time cardiac imaging to obtain high spatial and temporal resolution images with an ECG-free retrospective gating approach [4,5]. The raw data was transferred for offline reconstruction using in-house Matlab scripts. Analysis of the PCMRI data was performed using a freely available Matlab software package (Segment v2.0 R5557; http://segment.heiberg.se). A region of interest (ROI) of the cross section for both the left and right CCA was defined on the first phase of the magnitude image using a region growing tool. The ROIs were then automatically propagated across the remaining phases, accounting for the change in vessel caliber (see Figure 1), and associated pulsatile flow volumes computed from the phase data. PWV was calculated as the slope between area vs. flow during the systolic phase, and Γ was calculated as the ratio of backward to forward wave amplitude at the first harmonic (Figure 2) [2]. Group averages of PWV and Γ were compared using Student's t-test, with statistical significance defined as p<0.05.Results
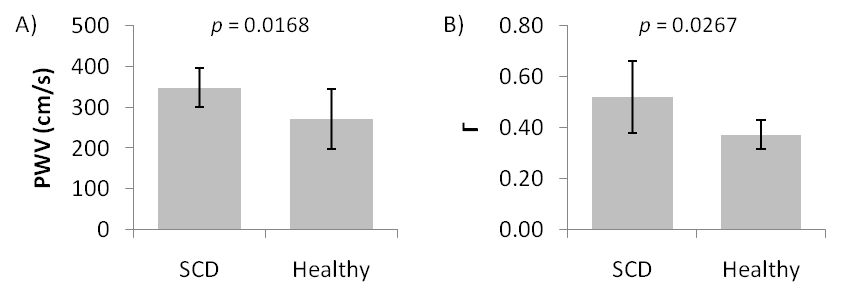
Mean PWV was found to be significantly greater in the SCD group compared to controls (348±47cm/s vs. 272±73cm/s; p=0.017). Furthermore, mean Γ was also shown to be higher in SCD patients (0.52±0.14cm/s vs. 0.37±0.06cm/s; p=0.027). The results are graphed in Figure 3.Discussion
Using PCMRI, we could characterize the flow and reflection properties within the CCA and show significant differences between pediatric SCD patients and healthy controls. Increased PWV and Γ in SCD suggests that the CCAs in SCD are less compliant and blood delivery into the microvasculature is less efficient. Future work will involve incorporating compressed sensing reconstruction to further increase temporal resolution, and correlating these measures with clinical outcomes.Conclusion
The parameters derived from this scan can provide useful information on the mechanical properties and vascular morphology of the cerebrovasculature in SCD patients that could potentially aid in the clinical evaluation of children with cerebrovascular disorders.Acknowledgements
No acknowledgement found.References
1. Kosinski PD, et al. The severity of anaemia depletes cerebrovascular dilatory reserve in children with sickle cell disease: a quantitative magnetic resonance imaging study. Br J Haematol. 2016; 176(2):280-7.
2. Macgowan CK, et al. Evaluation of cereborvascular impedance and wave reflection in mouse by ultrasound. J Cereb Blood Flow & Metab. 2015; 35:521-6.
3. Vulliemoz S, et al. Estimation of local aortic elastic properties with MRI. Magn Reson Med. 2002; 47(4):649-54.
4. Roy CW, et al. Motion compensated cine CMR of the fetal heart using radial undersampling and compressed sensing. J Cardiovasc Magn Reson. 2017; 19(1):29.
5. Roy CW, et al. Accelerated MRI of the fetal heart using compressed sensing and metric optimized gating. Magn Reson Med. 2016; 0:1-11.
Figures