1138
PC-MRI measurements of net CSF flow through the cerebral aqueduct strongly depend on respiration1Department of Radiology, University Medical Center Utrecht, Utrecht, Netherlands, 2Spinoza Center for Neuroimaging, Amsterdam, Netherlands
Synopsis
In this work the influence of respiration on net CSF flow measurements was investigated.
In 12 volunteers net CSF flow was measured in the cerebral aqueduct using PC-MRI at 7T, with respiratory gating on expiration and on inspiration, and without respiratory gating. Repeated measurements were performed. Net flow over the cardiac cycle was determined.
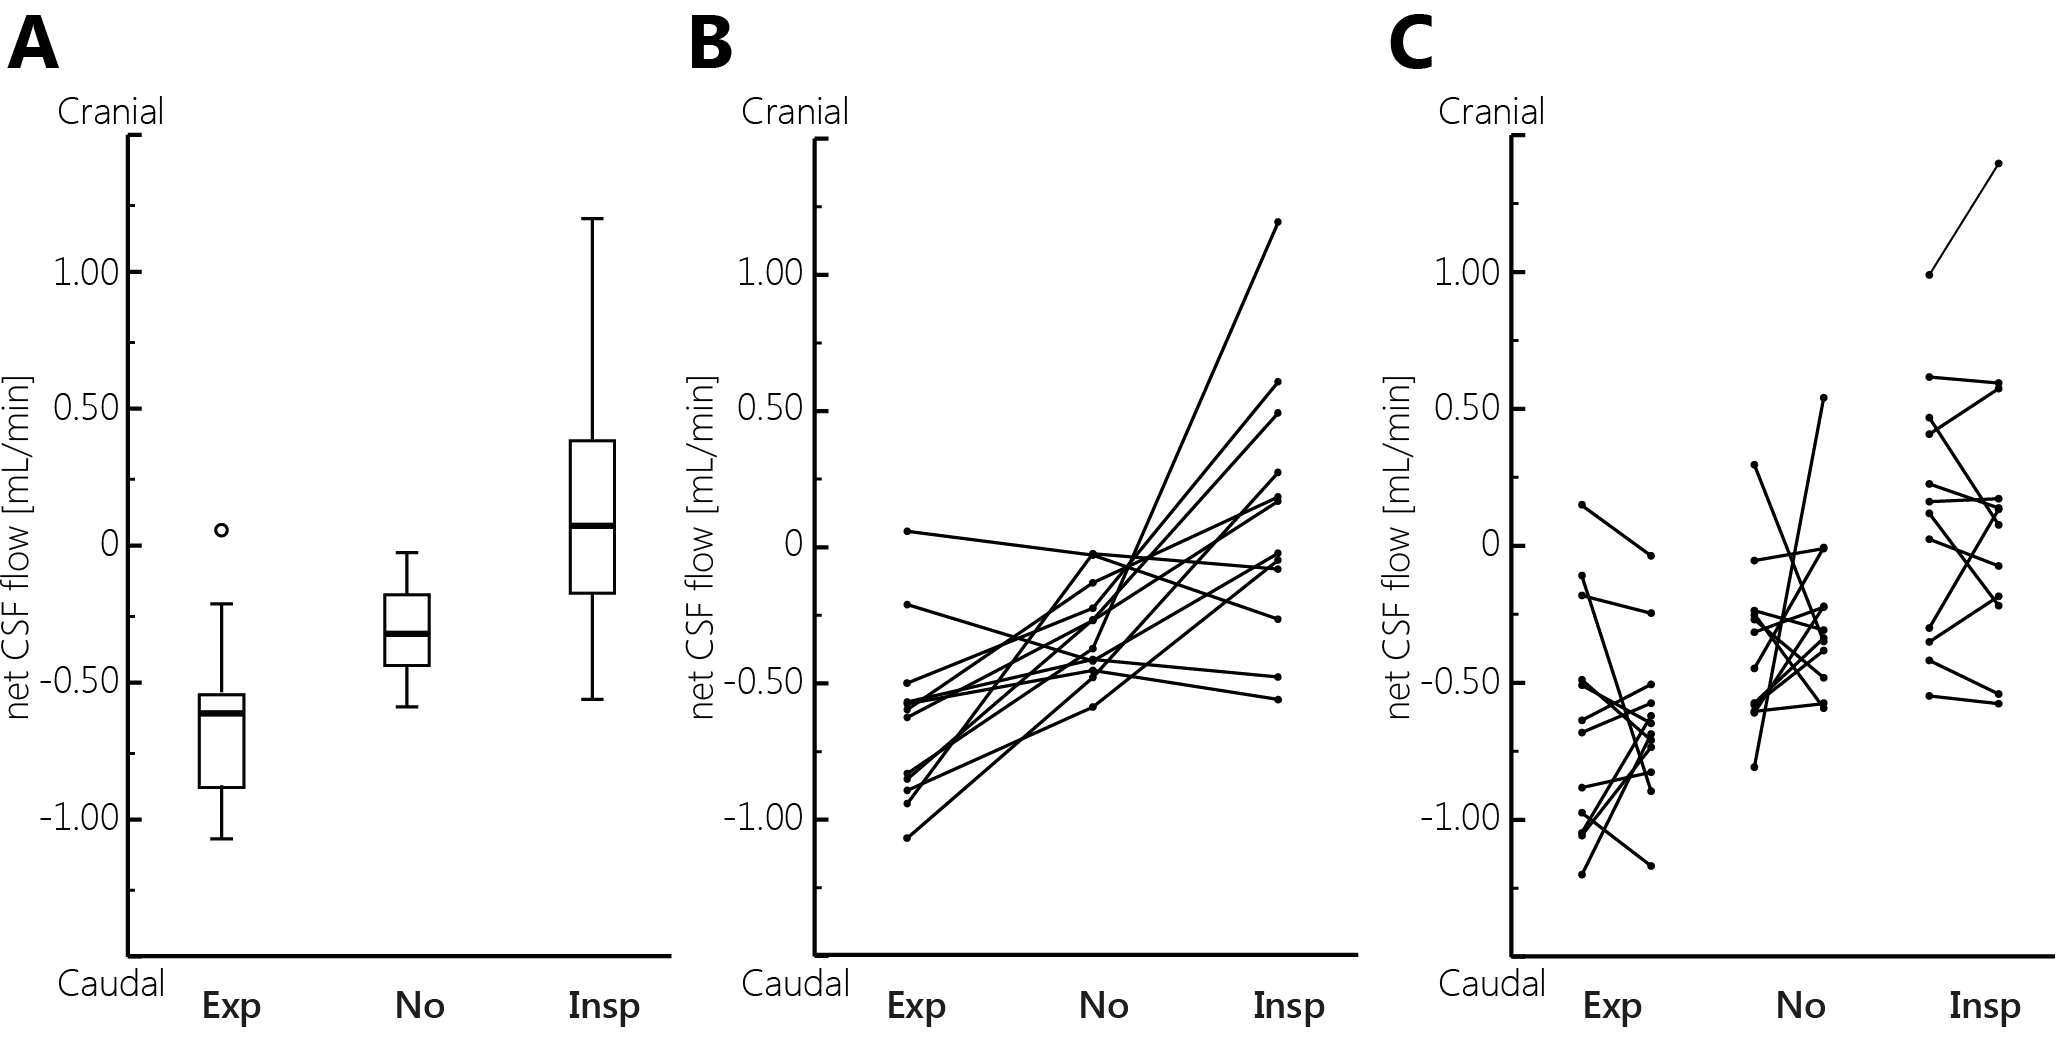
Net CSF flow (mean±sd) was -0.64±0.32 mL/min (caudal) during expiration, +0.12±0.49 mL/min (cranial) during inspiration, and -0.31±0.18 mL/min without respiratory gating. Two outliers, with reversed (cranial) net CSF flow, were observed when no respiratory gating was performed. Repeatability was best for gating on inspiration.
Introduction
Cerebrospinal fluid (CSF) plays an important role in maintaining homeostasis and in the clearance system of the brain1,2. With aging and in disease CSF dynamics are altered3–5. Net CSF flow over the cardiac cycle through the cerebral aqueduct may serve as a measure for CSF production in the lateral ventricles, and can be measured using PC-MRI6,7. It has been shown that CSF flow dynamics depend also on respiration8–12. In this work the influence of respiration on net CSF flow measurements was investigated.Methods
Twelve volunteers (7 male, age 19-39 years) were scanned at 7T (Philips Healthcare) with a 32ch receive head coil and volume transmit coil (Nova Medical).
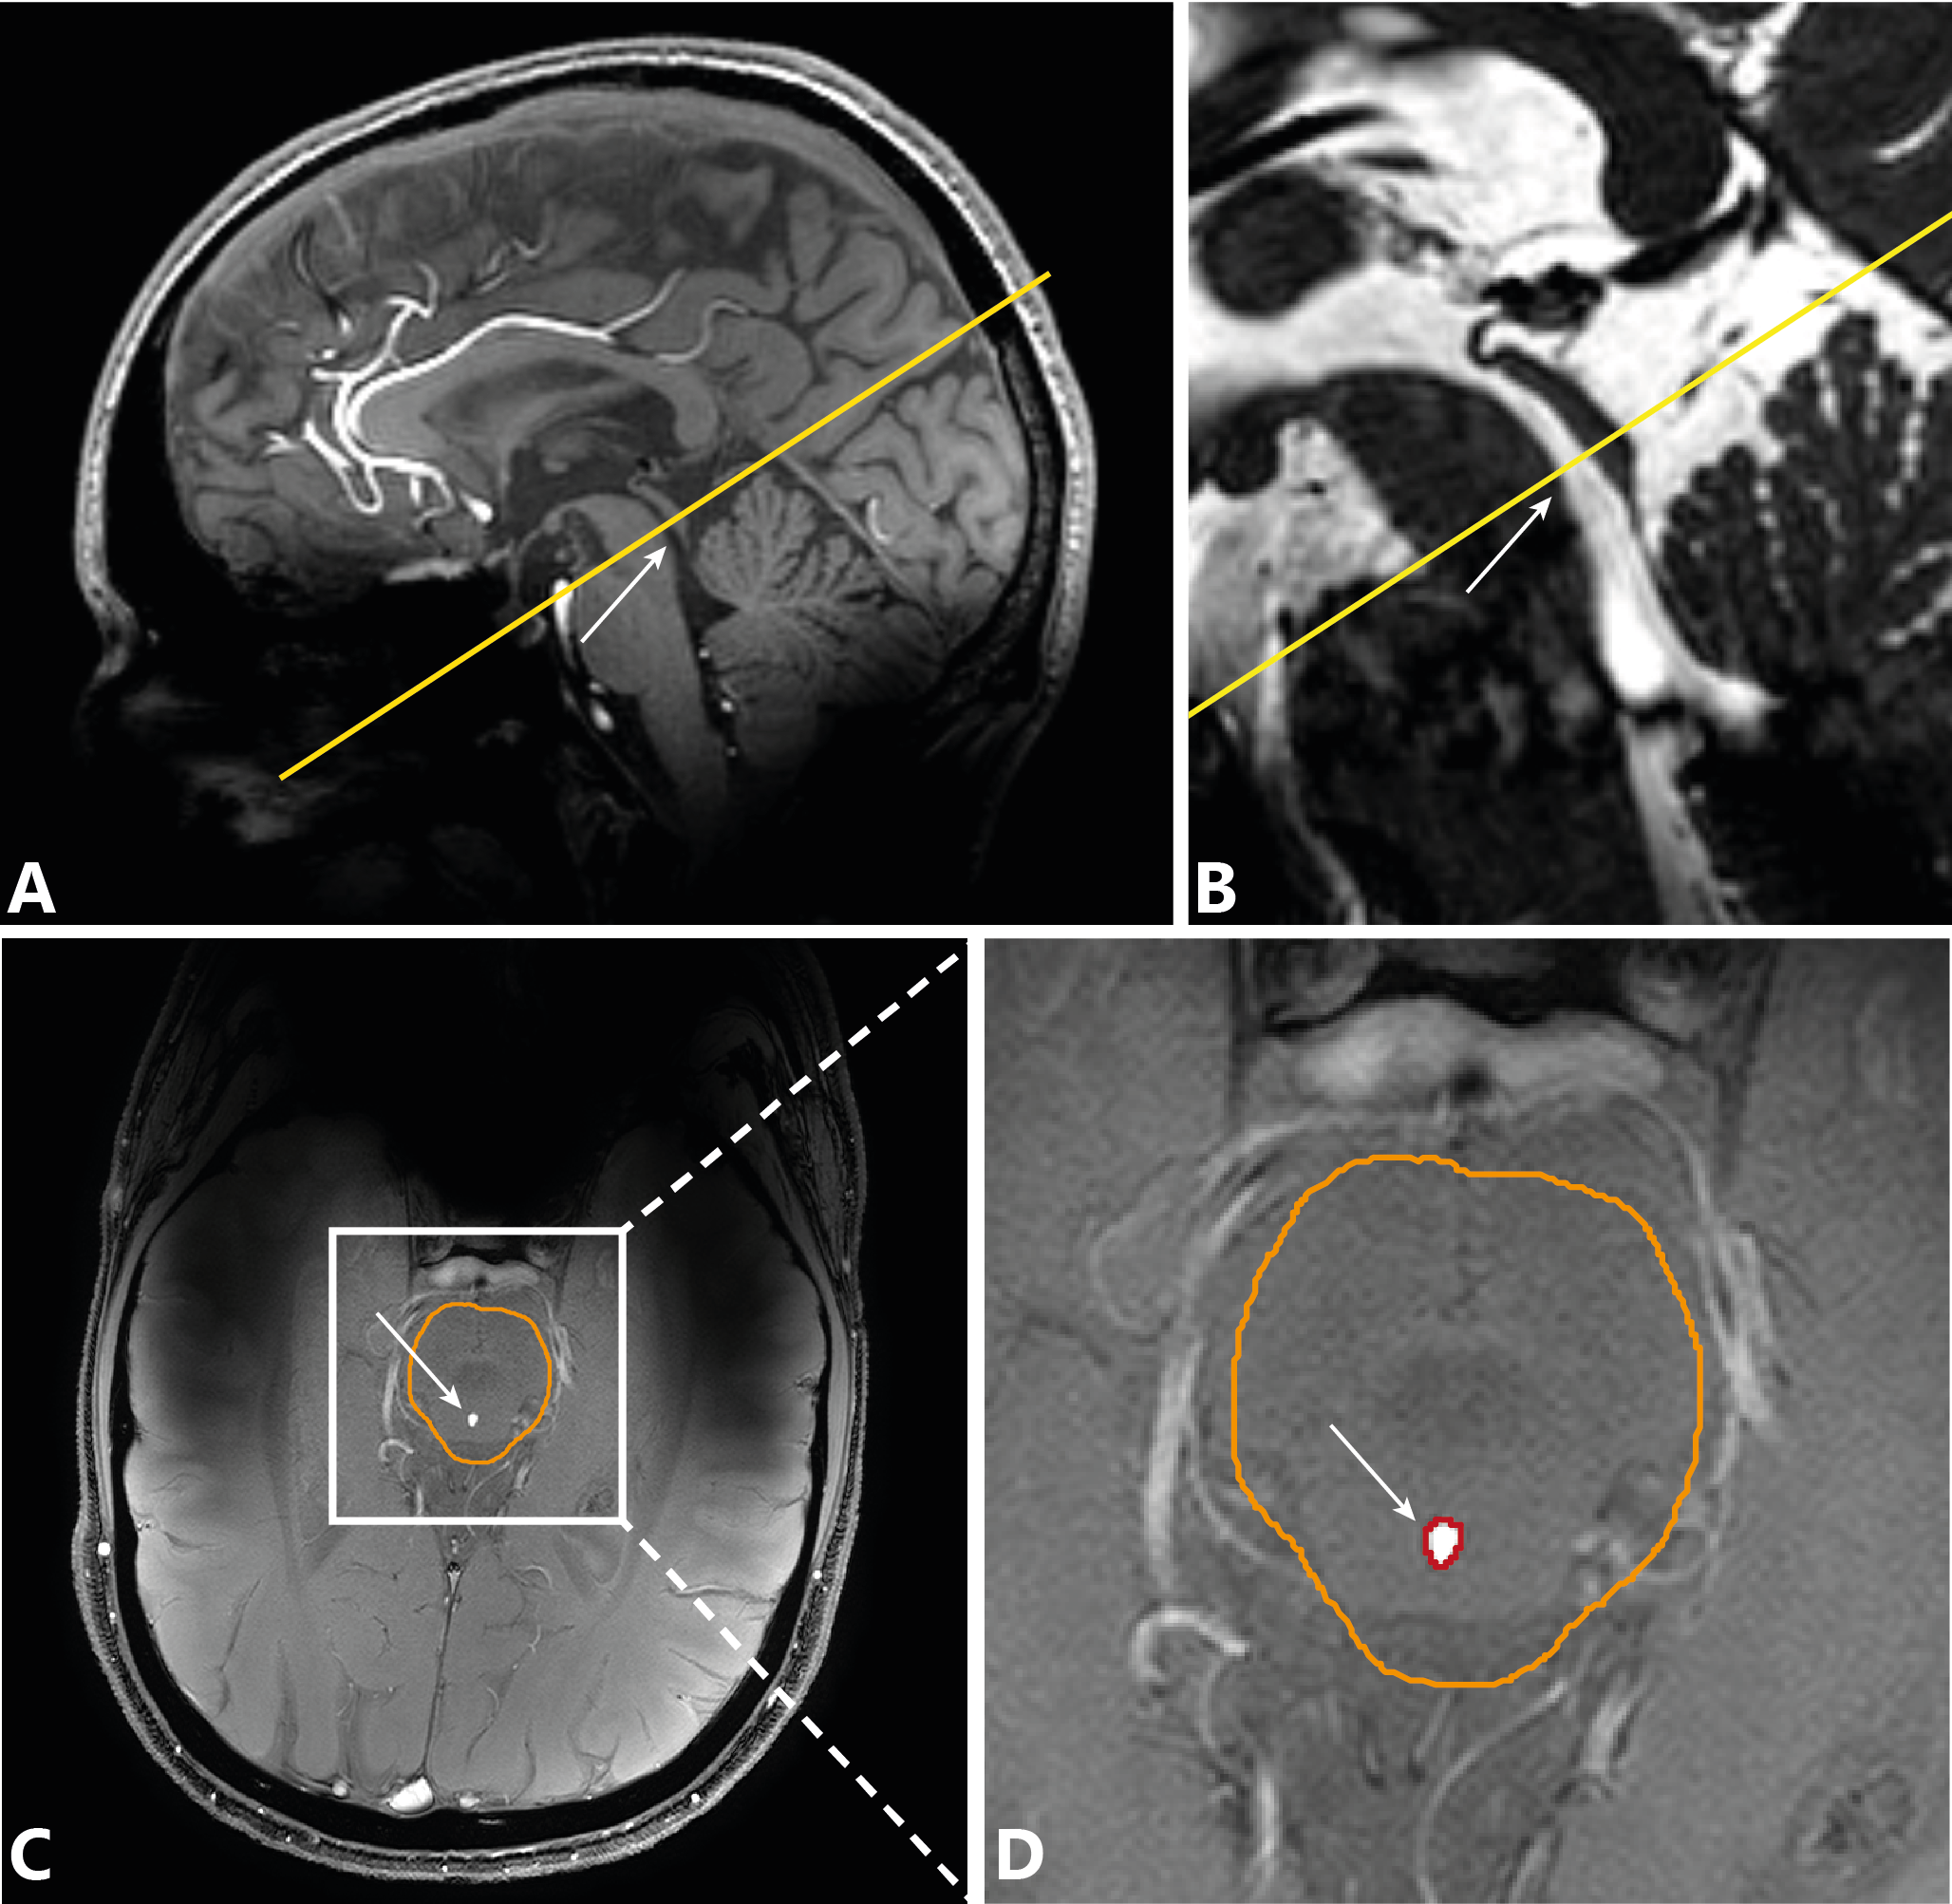
Single-slice PC-MRI measurements were performed in the cerebral aqueduct (Figure 1) with encoding velocity (venc) 15 cm/s, acquired resolution 0.45×0.45×3 mm3, TR/TE 12/5.9 ms, 36-45 frames per cardiac cycle, depending on cardiac rate, scan time 1:28-1:52 min /4:26-5:38 min without/with respiratory gating, depending on cardiac rate. Measurements were performed with respiratory gating on (1) expiration and (2) inspiration, and compared to no gating. All measurements were repeated.
Background correction was performed13, and phase unwrapping was performed if necessary14. The cerebral aqueduct was determined automatically within a manually drawn brain stem region-of-interest (Figure 1). Net CSF flow through the aqueduct was obtained. Stroke volumes were determined by averaging the systolic (caudal) and diastolic (cranial) flow volumes.
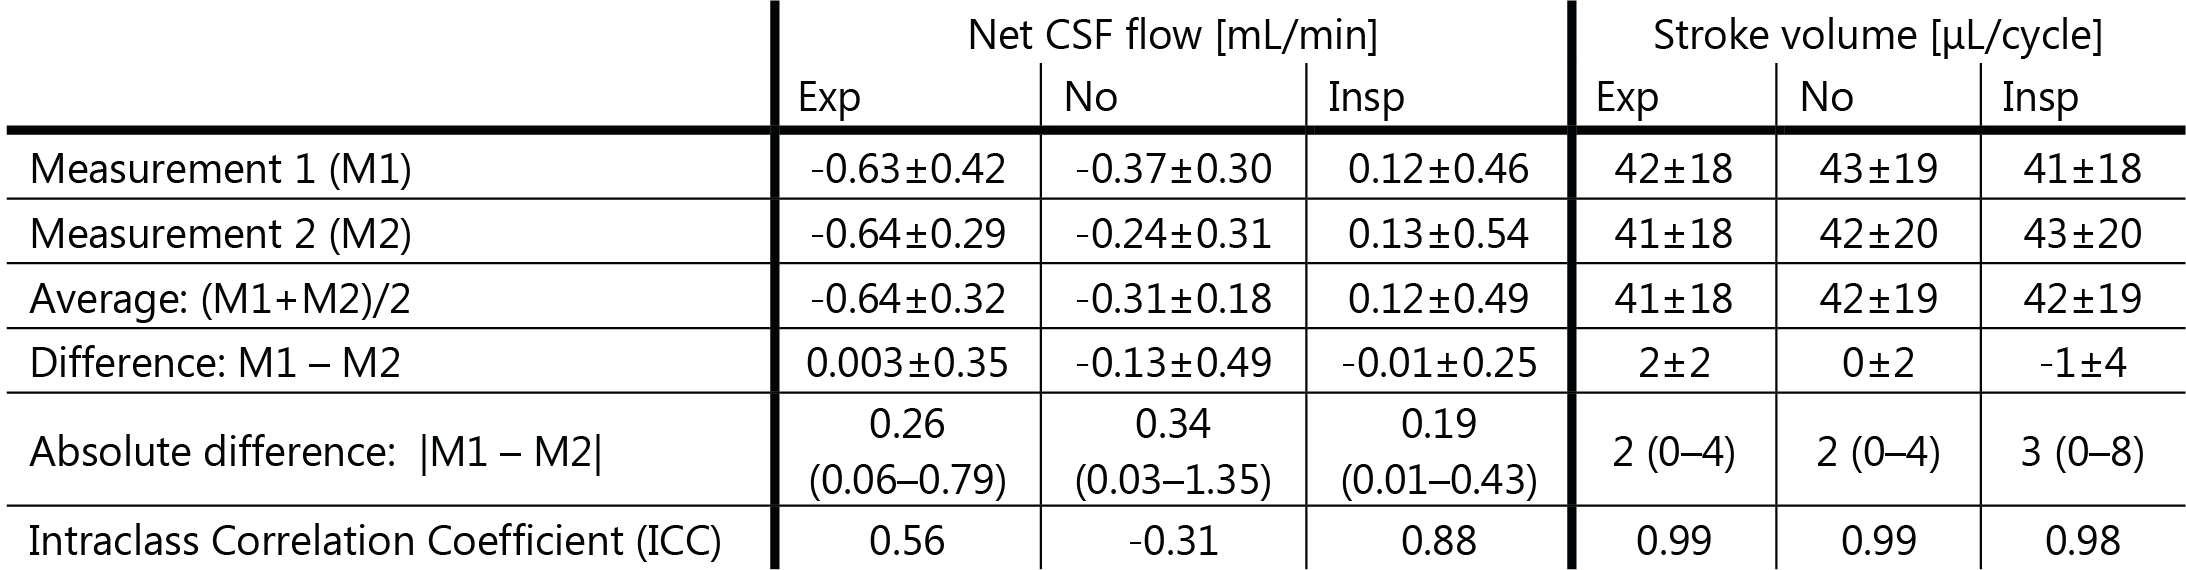
To assess repeatability, the difference, absolute difference, and the Intraclass Correlation Coefficient (ICC) of net CSF flow and stroke volume between the repeated measurements were determined.
Repeated-measures ANOVA was performed to compare net CSF flows during gating on inspiration, expiration, and no respiratory gating, for both measurements separately. Significance level was p<0.05, Bonferroni correction was applied for the pairwise comparisons (3 tests).
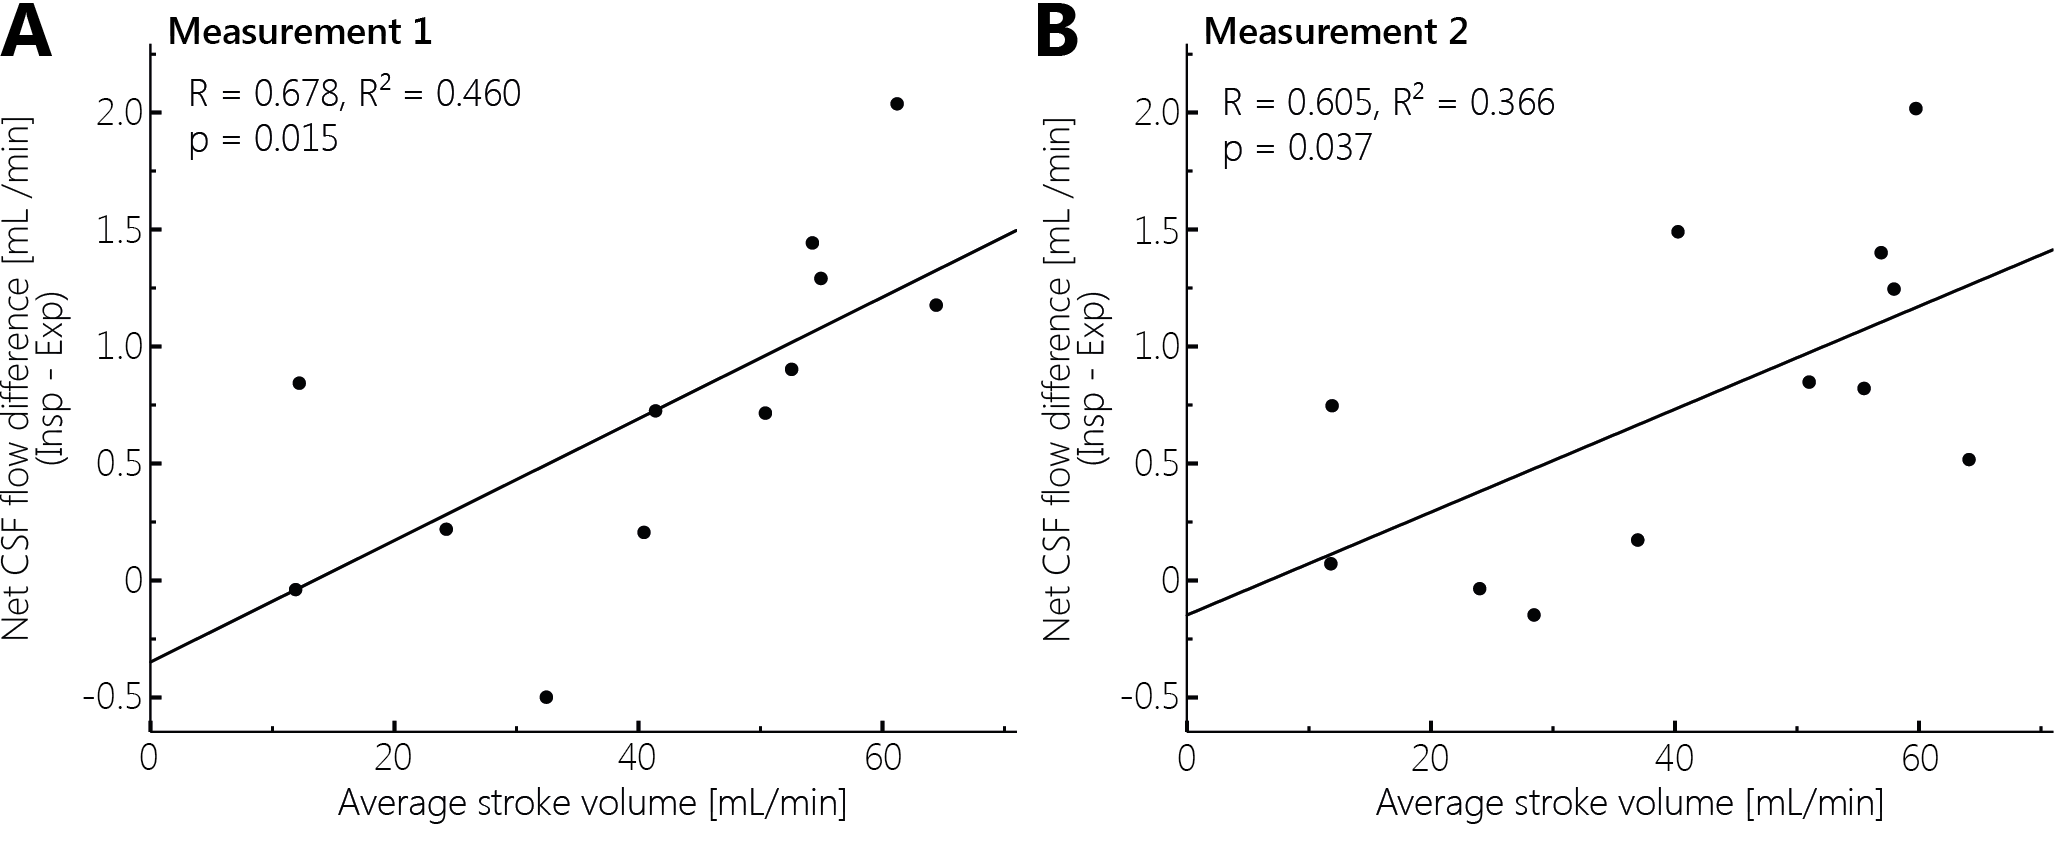
The relation between respiration-induced net CSF flow variation and cardiac-induced CSF pulsatility, was explored by linear regression analysis between the net flow difference (inspiration minus expiration) (dependent variable) and the average stroke volume of inspiration and expiration (independent variable), for both measurements separately.
Results
During expiration relatively large caudal net CSF flow was found, while the median net CSF flow was reversed (flow in cranial direction) during inspiration (Figure 2).
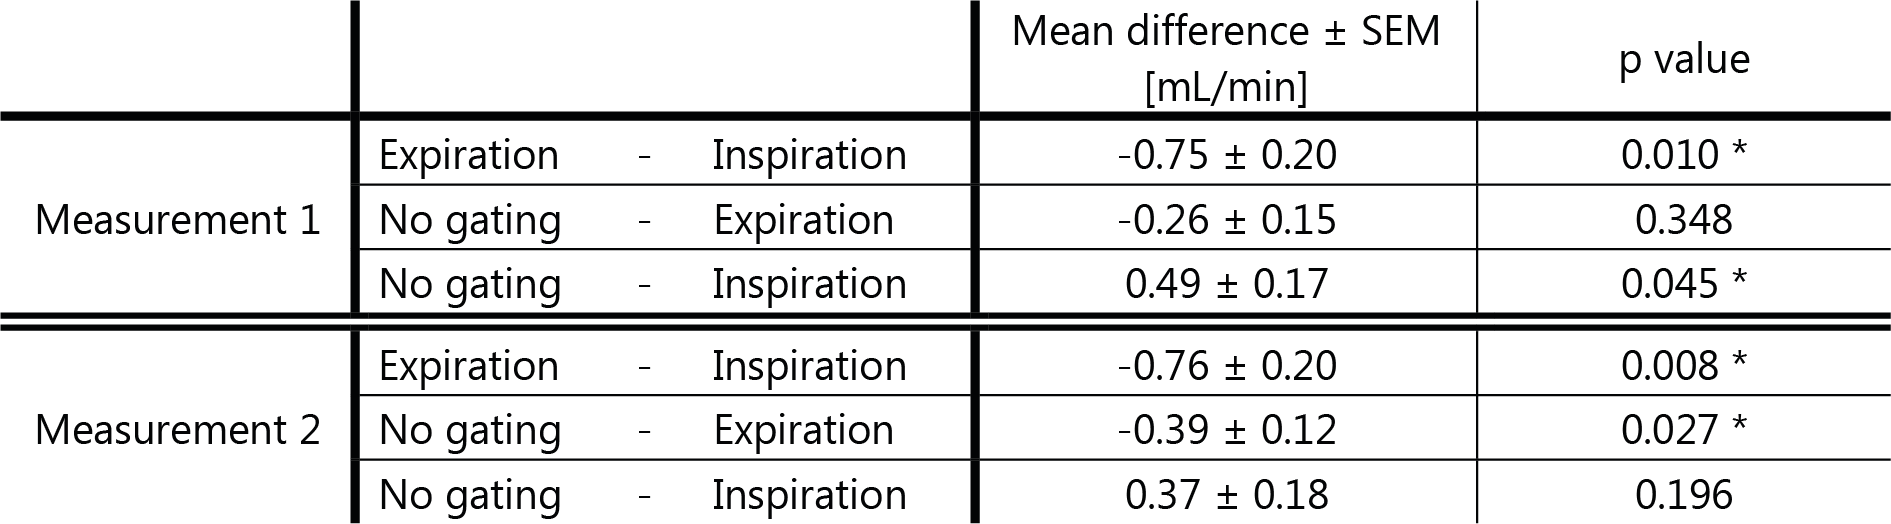
The difference in net CSF flow between respiratory conditions (expiration, inspiration, no gating) was significant (p=0.001 for both measurements). The difference in net CSF flow between expiration and inspiration is very similar between the repeated measurements (pairwise comparisons, Table 1).
For net CSF flow ICC is smallest during gating on inspiration (Table 2). Stroke volumes were similar for all respiratory conditions.
Linear regression analysis revealed a significant association between net CSF flow difference and average stroke volume (Figure 3).
Discussion
The observed net CSF flow difference between inspiration and expiration is in line with literature, which showed cranial CSF motion during inspiration, and caudal motion during expiration for real-time measurements8–12. The influence of respiration on net CSF flow may be explained by changes in thoracic and intracranial pressure over the respiratory cycle, affecting the intracranial blood volume11. Furthermore, a larger CSF pulsatility over the cardiac cycle was associated with larger respiratory-induced variation in net CSF flow. Thus, these distinct parameters of the CSF flow dynamics may reflect the compliance of the intracranium (brain, blood vessels and CSF) to pressure changes, in a similar way.
It is perhaps illustrative that the results without respiratory gating were significantly different from inspiration (but not expiration) gating in the first measurement, while this was opposite in the second measurement. This suggests that, without respiratory gating, net CSF flow may be closer to either inspiration or expiration, and respiration effects may not average out over the acquisition.
The average net CSF flow acquired without respiratory gating is in line with values found in literature, ranging between 0.26–0.74 mL/min6,15–20. Our results are on the lower end of this range. The use of high spatial and temporal resolutions together with the high SNR (7T) may have reduced the influence of partial volume and noise and, thus, the overestimation of the net flow.
Repeatability of net flow measurements was best for respiratory gating on inspiration. The low repeatability without respiratory gating is in line with literature19.
Stroke volumes are in line with values found in literature (30–50 μL/cycle)4,21–23.
The main limitation of this study is the limited number of subjects.
Conclusion
Net CSF flow was increased during expiration, and reversed (cranial) during inspiration. Net CSF flow difference between inspiration and expiration correlated significantly to stroke volume. Care should be taken in linking net CSF flow measurements to CSF production.Acknowledgements
This work was supported by the European Research Council, ERC grant agreement n°337333.References
1. Jessen NA, Munk ASF, Lundgaard I, Nedergaard M. The Glymphatic System: A Beginner’s Guide. Neurochem Res. Springer US; 2015;40:2583–2599.
2. Spector R, Robert Snodgrass S, Johanson CE. A balanced view of the cerebrospinal fluid composition and functions: Focus on adult humans. Exp Neurol. Elsevier B.V.; 2015;273:57–68.
3. May C, Kaye J a, Atack JR, Schapiro MB, Friedland RP, Rapoport SI. Cerebrospinal fluid production is reduced in healthy aging. Neurology. 1990;40:500–503.
4. Stoquart-ElSankari S, Balédent O, Gondry-Jouet C, Makki M, Godefroy O, Meyer M-E. Aging Effects on Cerebral Blood and Cerebrospinal Fluid Flows. J Cereb Blood Flow Metab. 2007;27:1563–1572.
5. Bradley WG. CSF Flow in the Brain in the Context of Normal Pressure Hydrocephalus. AJNR Am J Neuroradiol. 2015;36:831–838.
6. Feinberg DA, Mark AS. Human brain motion and cerebrospinal fluid circulation demonstrated with MR velocity imaging. Radiology. 1987;163:793–799.
7. Ståhlberg F, Mogelvang J, Thomsen C, et al. A method for MR quantification of flow velocities in blood and CSF using interleaved gradient-echo pulse sequences. Magn Reson Imaging. 1989;7:655–667.
8. Klose U, Strik C, Kiefer C, Grodd W. Detection of a relation between respiration and CSF pulsation with an echoplanar technique. J Magn Reson Imaging. 2000;11:438–444.
9. Yamada S, Miyazaki M, Yamashita Y, et al. Influence of respiration on cerebrospinal fluid movement using magnetic resonance spin labeling. Fluids Barriers CNS. 2013;10.
10. Dreha-Kulaczewski S, Joseph AA, Merboldt K-D, Ludwig H-C, Gärtner J, Frahm J. Inspiration Is the Major Regulator of Human CSF Flow and X Jens Frahm. J Neurosci. 2015;35:2485–2491.
11. Dreha-Kulaczewski S, Joseph AA, Merboldt K-D, Ludwig H-C, Gärtner J, Frahm J. Identification of the upward movement of human CSF in vivo and its relation to the brain venous system. J Neurosci. 2017;37:2395–2402.
12. Chen L, Beckett A, Verma A, Feinberg DA. Dynamics of respiratory and cardiac CSF motion revealed with real-time simultaneous multi-slice EPI velocity phase contrast imaging. Neuroimage. Elsevier Inc.; 2015;122:281–287.
13. Bouvy WH, Geurts LJ, Kuijf HJ, et al. Assessment of blood flow velocity and pulsatility in cerebral perforating arteries with 7-T quantitative flow MRI. NMR Biomed. 2016;29:1295–1304.
14. Goldstein RM, Zebker HA, Werner CL. Satellite Radar Interferometry: Two-dimensional Phase Unwrapping. Radio Sci. 1988. p. 713–720.
15. Balédent O, Gondry-Jouet C, Meyer ME, et al. Relationship between cerebrospinal fluid and blood dynamics in healthy volunteers and patients with communicating hydrocephalus. Invest Radiol. 2004;39:45–55.
16. Enzmann DR, Pelc NJ. Cerebrospinal fluid flow measured by phase-contrast cine MR. AJNR Am J Neuroradiol. 1993;14:1301–1307.
17. Huang T-Y, Chung H, Chen M, et al. Supratentorial Cerebrospinal Fluid Production Rate in Healthy Adults: Quantification with Two-dimensional Cine Phase-Contrast MR Imaging with High Temporal and Spatial Resolution. Radiology. 2004;233:603–608.
18. Piechnik SK, Summers PE, Jezzard P, Byrne J V. Magnetic resonance measurement of blood and CSF flow rates with phase contrast - Normal values, repeatability and CO2 reactivity. Acta Neurochir Suppl. Epub 2008.:263–270.
19. Wåhlin A, Ambarki K, Hauksson J, Birgander R, Malm J, Eklund A. Phase contrast MRI Quantification of pulsatile volumes of brain arteries, veins, and cerebrospinal fluids compartments: Repeatability and physiological interactions. J Magn Reson Imaging. 2012;35:1055–1062.
20. Yoshida K, Takahashi H, Saijo M, et al. Phase-contrast MR studies of CSF flow rate in the cerebral aqueduct and cervical subarachnoid space with correlation-based segmentation. Magn Reson Med Sci. 2009;8:91–100.
21. Bateman GA, Brown KM. The measurement of CSF flow through the aqueduct in normal and hydrocephalic children: From where does it come, to where does it go? Child’s Nerv Syst. 2012;28:55–63.
22. Kim DS, Choi JU, Huh R, Yun PH, Kim DI. Quantitative assessment of cerebrospinal fluid hydrodynamics using a phase-contrast cine MR image in hydrocephalus. Child’s Nerv Syst. 1999;15:461–467.
23. Kelly EJ, Yamada S. Cerebrospinal Fluid Flow Studies and Recent Advancements. Semin Ultrasound, CT MRI. Elsevier; 2016;37:92–99.
Figures