1135
Cortical T1 mapping with 3D MR Fingerprinting at 7T using a single transmit channel1Human Brain Research Center, Kyoto University Graduate School of Medicine, Kyoto, Japan, 2Department of Radiology, New York University School of Medicine, Center for Advanced Imaging Innovation and Research (CAI2R) and Bernard and Irene Schwartz Center for Biomedical Imaging, New York, NY, United States, 3Siemens Healthcare K.K., Tokyo, Japan
Synopsis
A prototype 3D MRF sequence was evaluated for cortical T1 mapping at 7T in the context of the Human Connectome Project (HCP). Phantom results showed that the 3D MRF T1 map of a liquid was in good agreement with gold standard IR-SE measurements. The synthetic MPRAGE and synthetic T2-SPACE created from the 3D MRF data performed well in HCP pipeline. The cortical thickness estimation was fairly stable across different imaging resolutions. The R1 of the cortex showed higher value than expected, which may indicate that more advanced signal models may be necessary to accurately describe the spin dynamics in-vivo.
Introduction
The increased SNR at 7T opens the door to high-resolution quantitative
measurements of the human cerebral cortex. One popular sequence for
acquiring such data is the MP2RAGE, which rapidly collects two different contrast
weighted images (1). A sophisticated combination of these two images is used to
reduce the B1+ bias and extract quantitative T1 maps.
However, some residual B1+ bias may remain. MR
Fingerprinting is another approach for quantitative imaging (2). In addition to
measuring tissue properties (PD,T1,T2), MRF sequences can be designed to
simultaneously quantify the B1+ field produced by one or
more transmit configurations (3,4). Thus, providing a natural avenue to circumvent
B1+ bias effects. Here we investigate the potential of a
prototype 3D MRF sequence for cortical T1 mapping at 7T in the context of the
Human Connectome Project (HCP).
Methods: Sequence-design
The 3D MRF sequence used here was originally developed for free-breathing abdominal imaging using two complementary transmit configurations. The design was derived from the 2D sequence published by Cloos et al. 2016, by removing the motion sensitive FISP segments (5) and switching to a 3D stack-of-stars readout (6) to create a volumetric PD/T1/B1+ mapping sequence (3D Plug-and-Play MRF, PNP3D). However, many 7T systems are equipped with only one transmit channel. To investigate the limits of the PNP3D framework in the context of a single transmit system, a non-selective adiabatic inversion was added at the start of each RF train.
Methods: Experiments
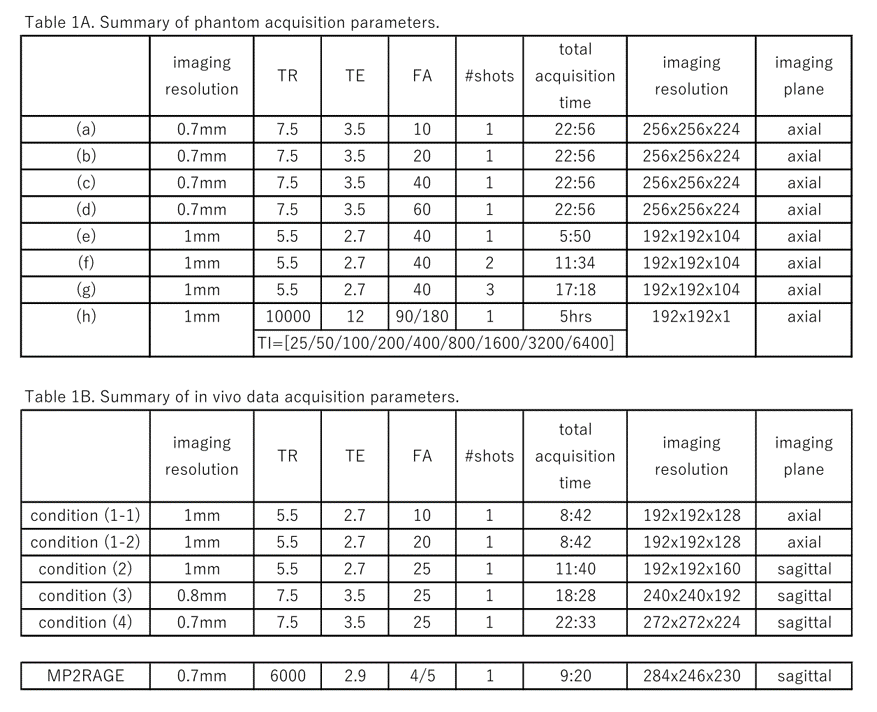
A custom-made liquid phantom was used to validate the quantitative maps. The reference T1 values were obtained from a series of single slice IR-SE measurements and compared to the proposed sequence. The acquisition parameters are summarized in Table 1A. Three healthy volunteers (male, 36,42,44 years) were scanned with the proposed MRF sequence (1mm-ISO) using a FA(peak)=10 and 20. For one subject, 0.8mm-ISO and 0.7mm-ISO data sets were acquired also. The acquisition parameters are summarized in Table 1B. All experiments were performed on an investigational whole-body 7T (MAGNETOM 7T, Siemens Healthcare, Erlangen, Germany) using a 1TX 32RX head coil (Nova Medical, Wilmington, MA, USA). The study was approved by our institutional review board.Methods: Post-processing
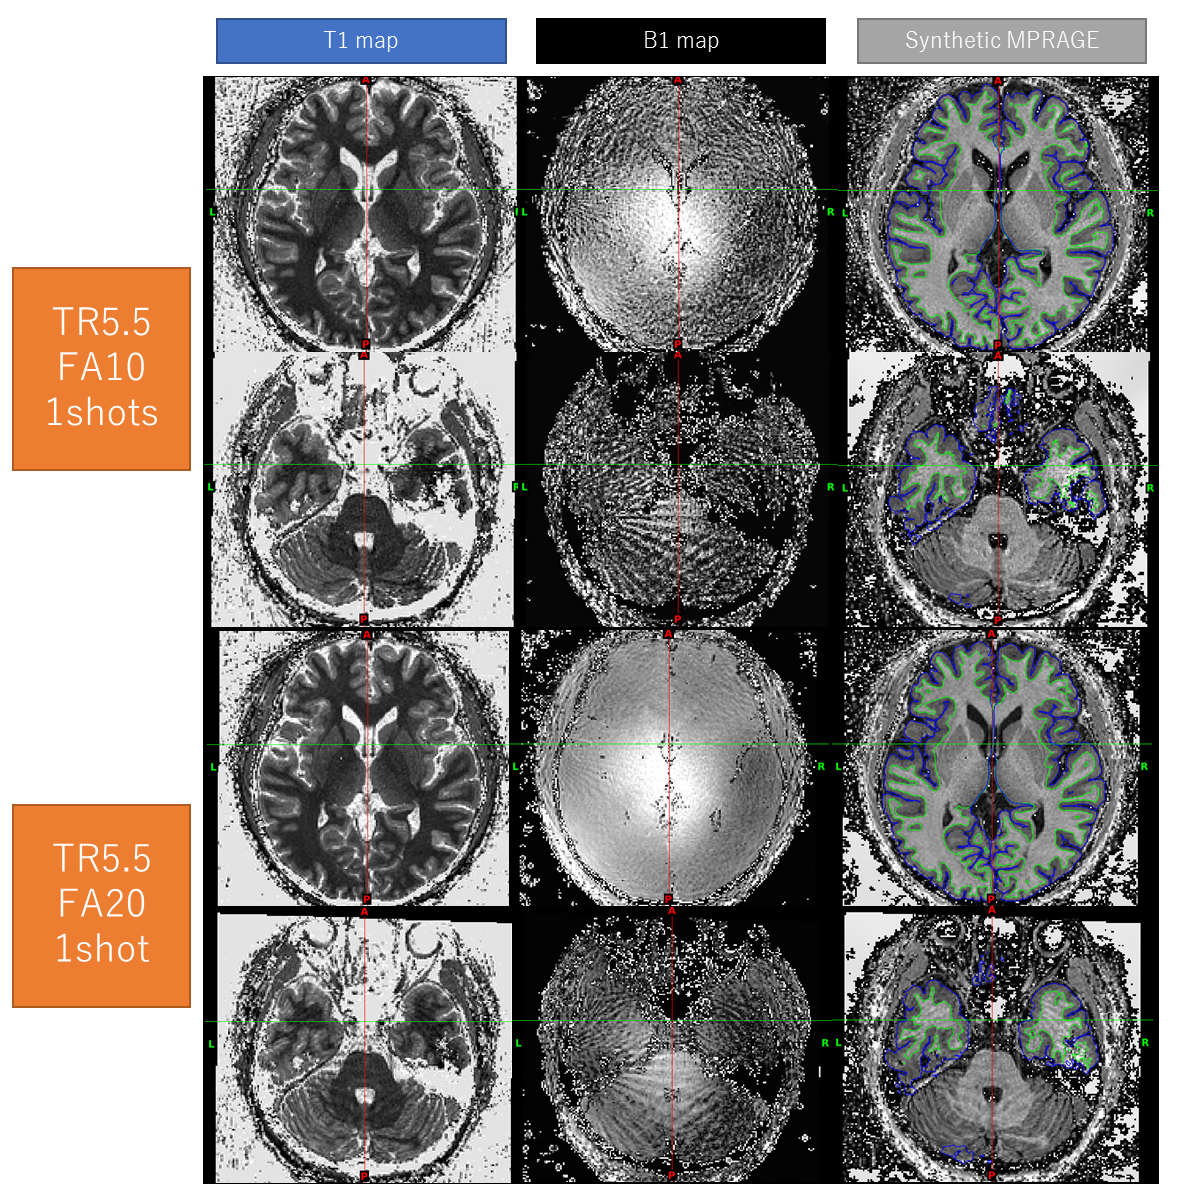
Images were reconstructed using Matlab (Mathworks, Natick, MA, USA). SVD compression was used prior to the dictionary matching (7). The T1 maps were used to create a synthetic MPRAGE (8) assuming 160 partitions and a TI1/TD/FA=1000/3700/6. In addition, we noticed that the T1-map looks reasonably similar to the T2-SPACE used to aid the segmentation in the HPC pipeline and decided to use it as “synthetic T2-SPACE”. The synthetic MPRAGE and synthetic T2-SPACE were fed into the HCP pipeline to obtain a cortical T1 map. Data processing with the HCP pipeline took approximately 8 hours.Results & Discussion
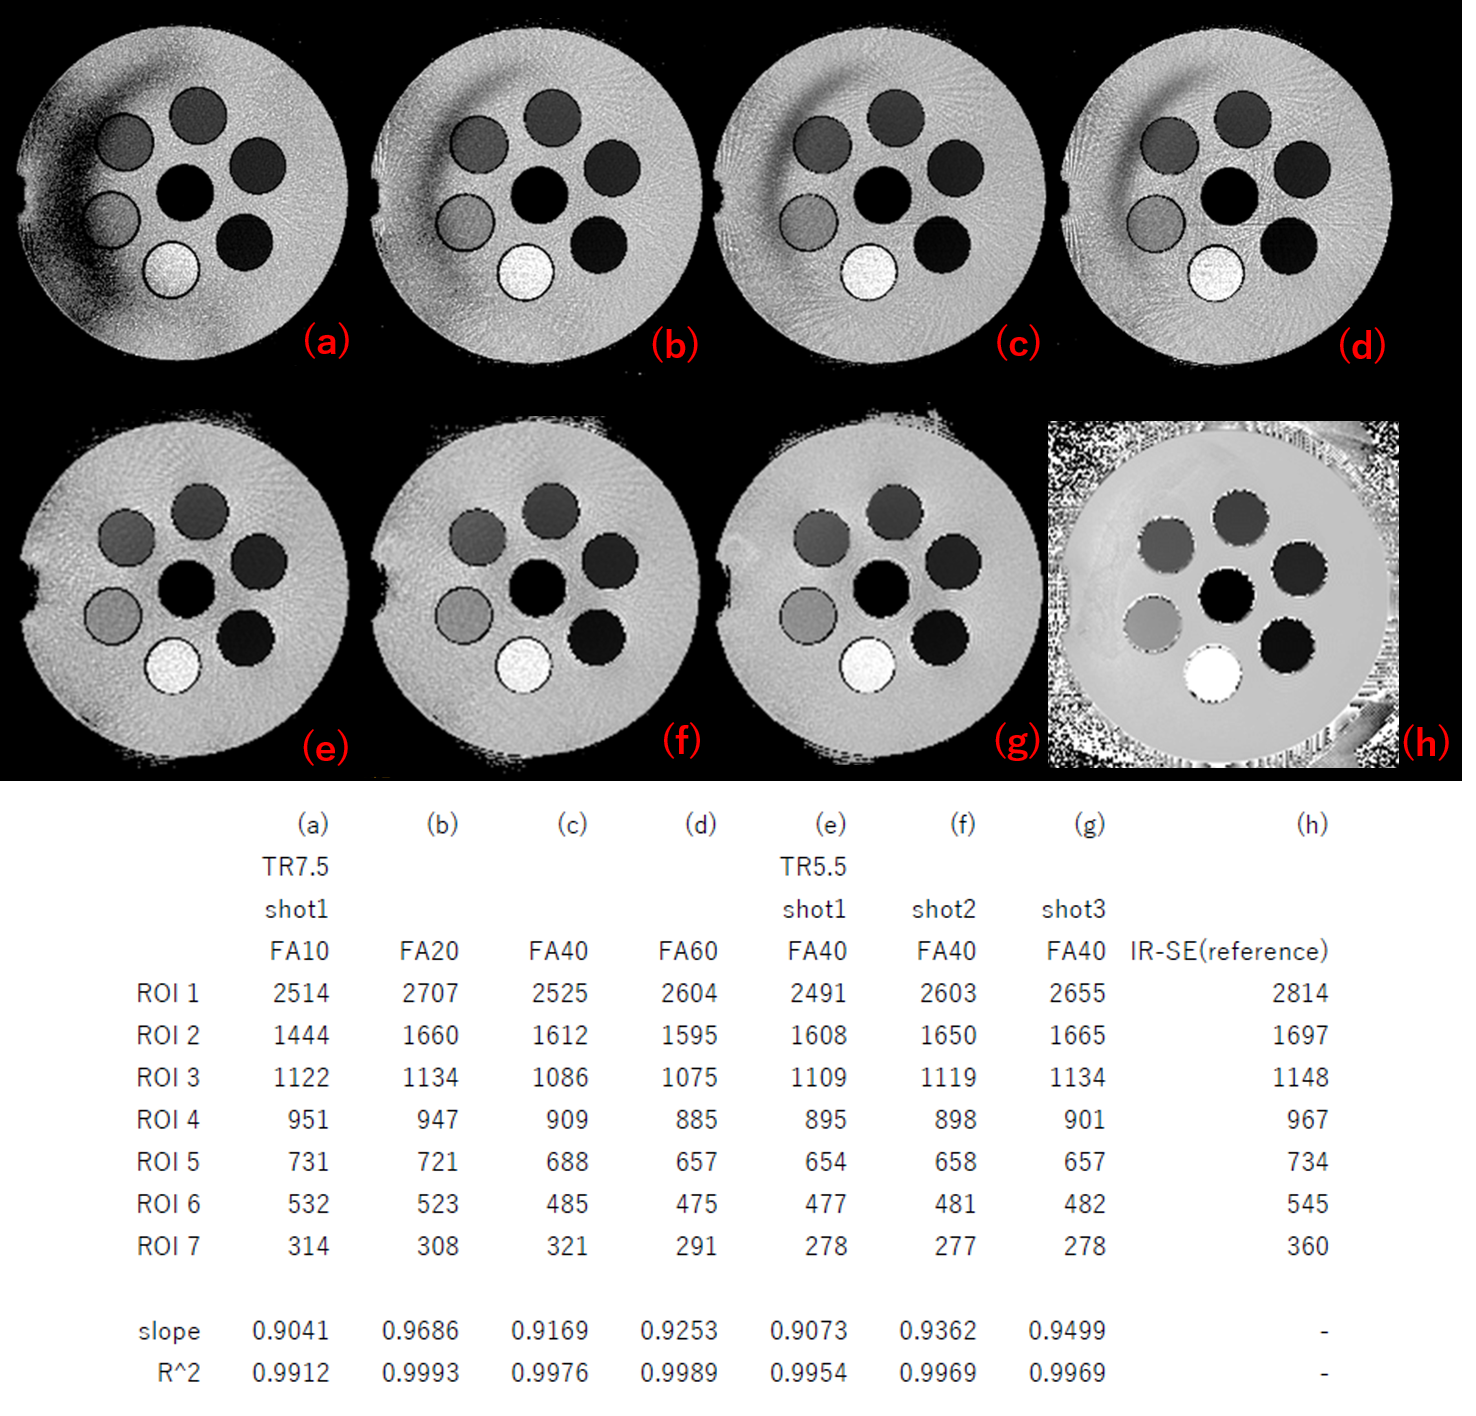
The T1 maps measurement in the 7 compartments of the phantom (Fig. 1) are in excellent agreement with the reference measurement (R^2=0.9912-0.9993). Nevertheless, residual artifacts can be seen in the background when using a FA(peak) of less than 40 degrees. In-vivo however, the B1+ may be expected to be more uniform than the phantom.
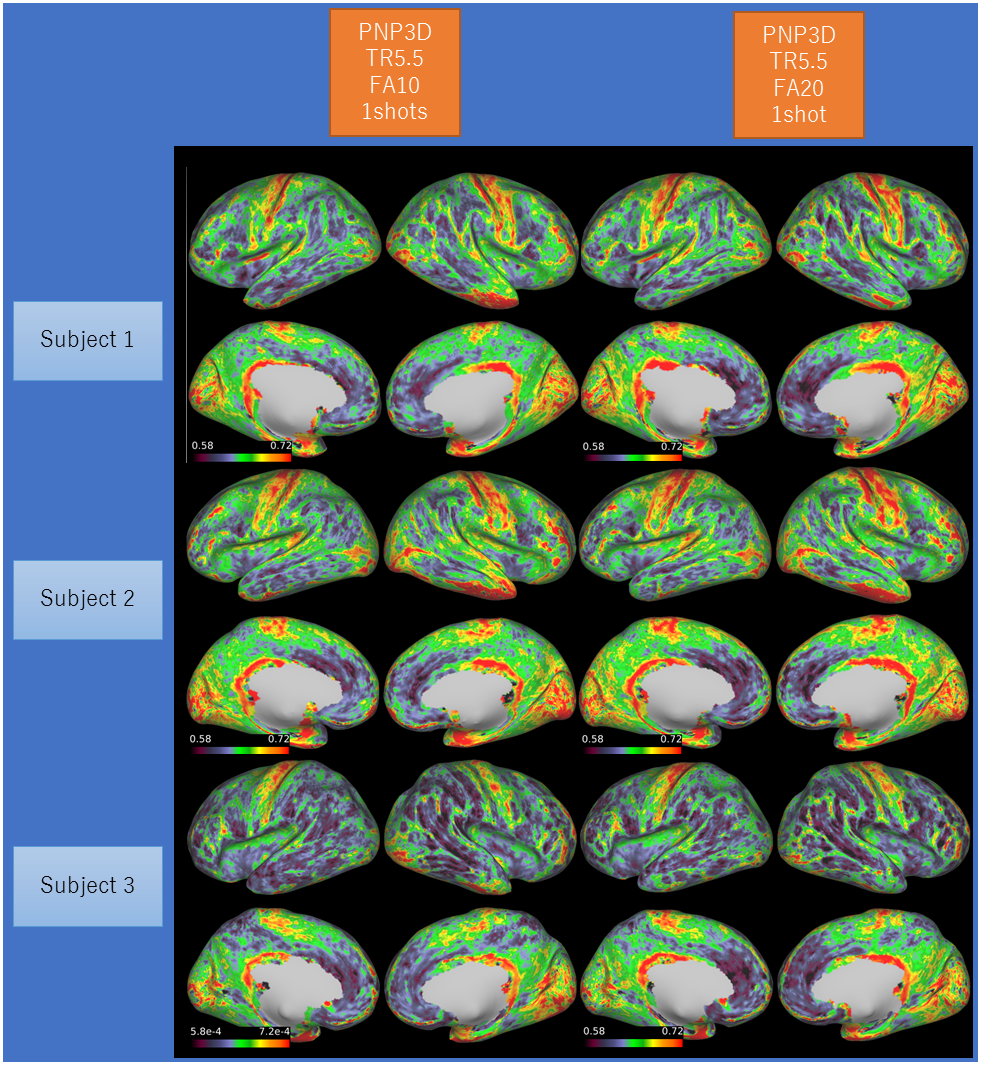
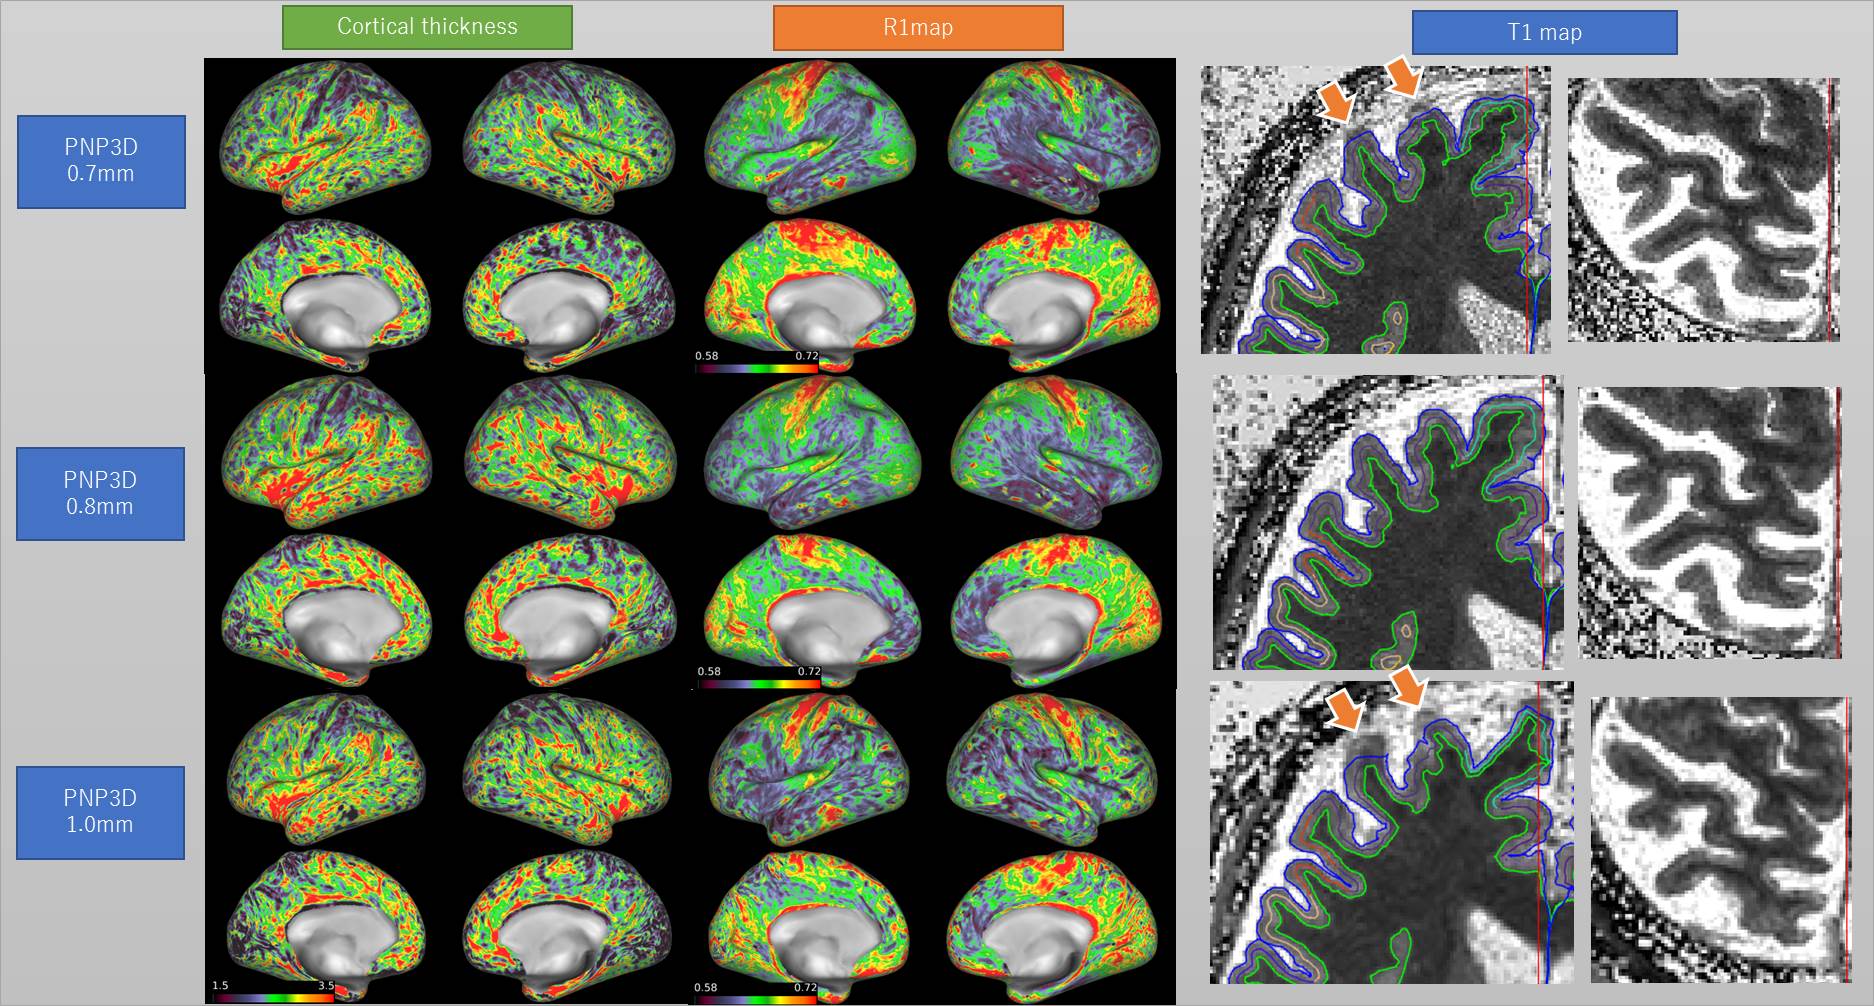
The combination of synthetic MPRAGE and SPACE images performed well in HCP pipeline (Fig. 2-4). The cortical thickness estimation was fairly stable across different imaging resolutions (Fig. 4). The cortical R1 (=1/T1) map showed minimal difference between FA10 and FA20, and similar contrast across different subjects (Fig. 3). Some regional variation in R1 is observed within the same subject with different image resolutions (Fig. 4). R1 values obtained with our proposed sequence are systematically higher than expected (about 15%). One possible explanation is magnetization transfer effects (9). Currently our dictionary assumes that the signal can be described by the single pool model. Although this works well for phantoms, it cannot accurately describe the in-vivo spin-dynamics(10).
The acquisition time of the prototype 3D MRF sequence tested here is more than double that of MP2RAGE. However, unlike the MP2RAGE, the current prototype PNP3D implementation does not yet utilize parallel imaging (in any direction), or in-coherent under sampling along the partition direction. In addition, SNR and encoding power of the sequence may be improved by optimizing the RF pulse train (11) and more sophisticated image reconstruction techniques (12).
Conclusion
Our work showed that it may be possible to develop a single 3D MRF solution for 7T that could serve as an alternative for the combination of MPRAGE and T2-SPACE sequences currently used in the HCP pipeline for 3T. However, more work is needed to improve the robustness and validate the accuracy in-vivo.Acknowledgements
References
1) Marques JP, Kober T, Krueger G, et al. MP2RAGE, a self bias-field corrected sequence for improved segmentation and T1-mapping at high field, Neuroimage. 2010: 49(2):1271-81.
2) Ma D, Gulani V, Seiberlich N, et al. Magnetic resonance fingerprinting, Nature. 2013 14;495(7440):187-92.
3) Cloos MA, Knoll F, Zhao T, et al. Multiparametric imaging with heterogeneous radiofrequency fields, Nat Commun. 2016 16;7:12445.
4) Buonincontr et al., Spiral MR fingerprinting at 7 T with simultaneous B1 estimation, MRI. 2017;41:1-6.
5) Yu et al., Exploring the Sensitivity of Magnetic Resonance Fingerprinting to Different Types of Motion and Possible Correction Mechanisms. ISMRM 2017 # 3938.
6) Block et al., Towards routine clinical use of radial stack-of-stars 3D gradient-echo sequences for reducing motion sensitivity. JKAMRM 2014;18:87-106
7) McGivney et al., SVD compression for magnetic resonance fingerprinting in the time domain. IEEE Trans. Bio. Med. Imag. 2014;33: 2311-2322.
8) Wang et al, Optimizing the Magnetization-Prepared Rapid Gradient-Echo (MP-RAGE) Sequence. PLOS ONE, https://doi.org/10.1371/journal.pone.0096899
9) Dortch RD et al., Quantitative magnetization transfer imaging of human brain at 7 T. Neuroimage. 2013 Jan 1;64:640-9.
10) Hilbert et al., Mitigating the Effect of Magnetization Transfer in Magnetic Resonance Fingerprinting. ISMRM 2017 #0074.
11) Asslander et al., Relaxation in Spherical Coordinates: Analysis and Optimization of pseudo-SSFP based MR-Fingerprinting. arXiv:1703.00481
12) Asslander et al., Low rank alternating direction method of multipliers reconstruction for MR fingerprinting. MRM Early view.
Figures