1134
In vivo Simultaneous Measurement of δf, T1, T2, and T2* by Magnetic Resonance Fingerprinting with Quadratic RF Phase1Biomedical Engineering, Case Western Reserve University, Cleveland, OH, United States, 2Radiology, Case Western Reserve University, Cleveland, OH, United States
Synopsis
We propose a novel Magnetic Resonance Fingerprinting pulse sequence with quadratic RF excitation phase (qRF-MRF) for the purpose of simultaneous measurement of T2* in addition to previously established spin parameters δf, T1, and T2. The original bSSFP based MRF pulse sequence1 was modified to incorporate excitation segments with quadratic RF phase to sensitize signal evolutions to T2*. Measurements using qRF-MRF were performed in both phantom and in vivo. Maps from qRF-MRF were validated against bSSFP based MRF and Multi-GRE.
Purpose
In vivo T2* relaxation time is sensitive to many physiological properties, including blood oxygenation level and parenchymal iron deposition level. Diagnosis and monitoring of conditions known to effect distribution of iron content, such as increased age, Huntington’s disease, and Alzheimer’s disease, may be aided by a rapid and quantitative MR method capable of measuring T2* simultaneously with other tissue parameters. In this work, we compare the accuracy of the simultaneous quantification of tissue properties off-resonance (δf), T1, T2, and T2* obtained by the Magnetic Resonance Fingerprinting with quadratic RF phase (qRF-MRF) method in in vivo volunteers against measurements obtained by bSSFP-MRF1 and multi-GRE methods.Methods
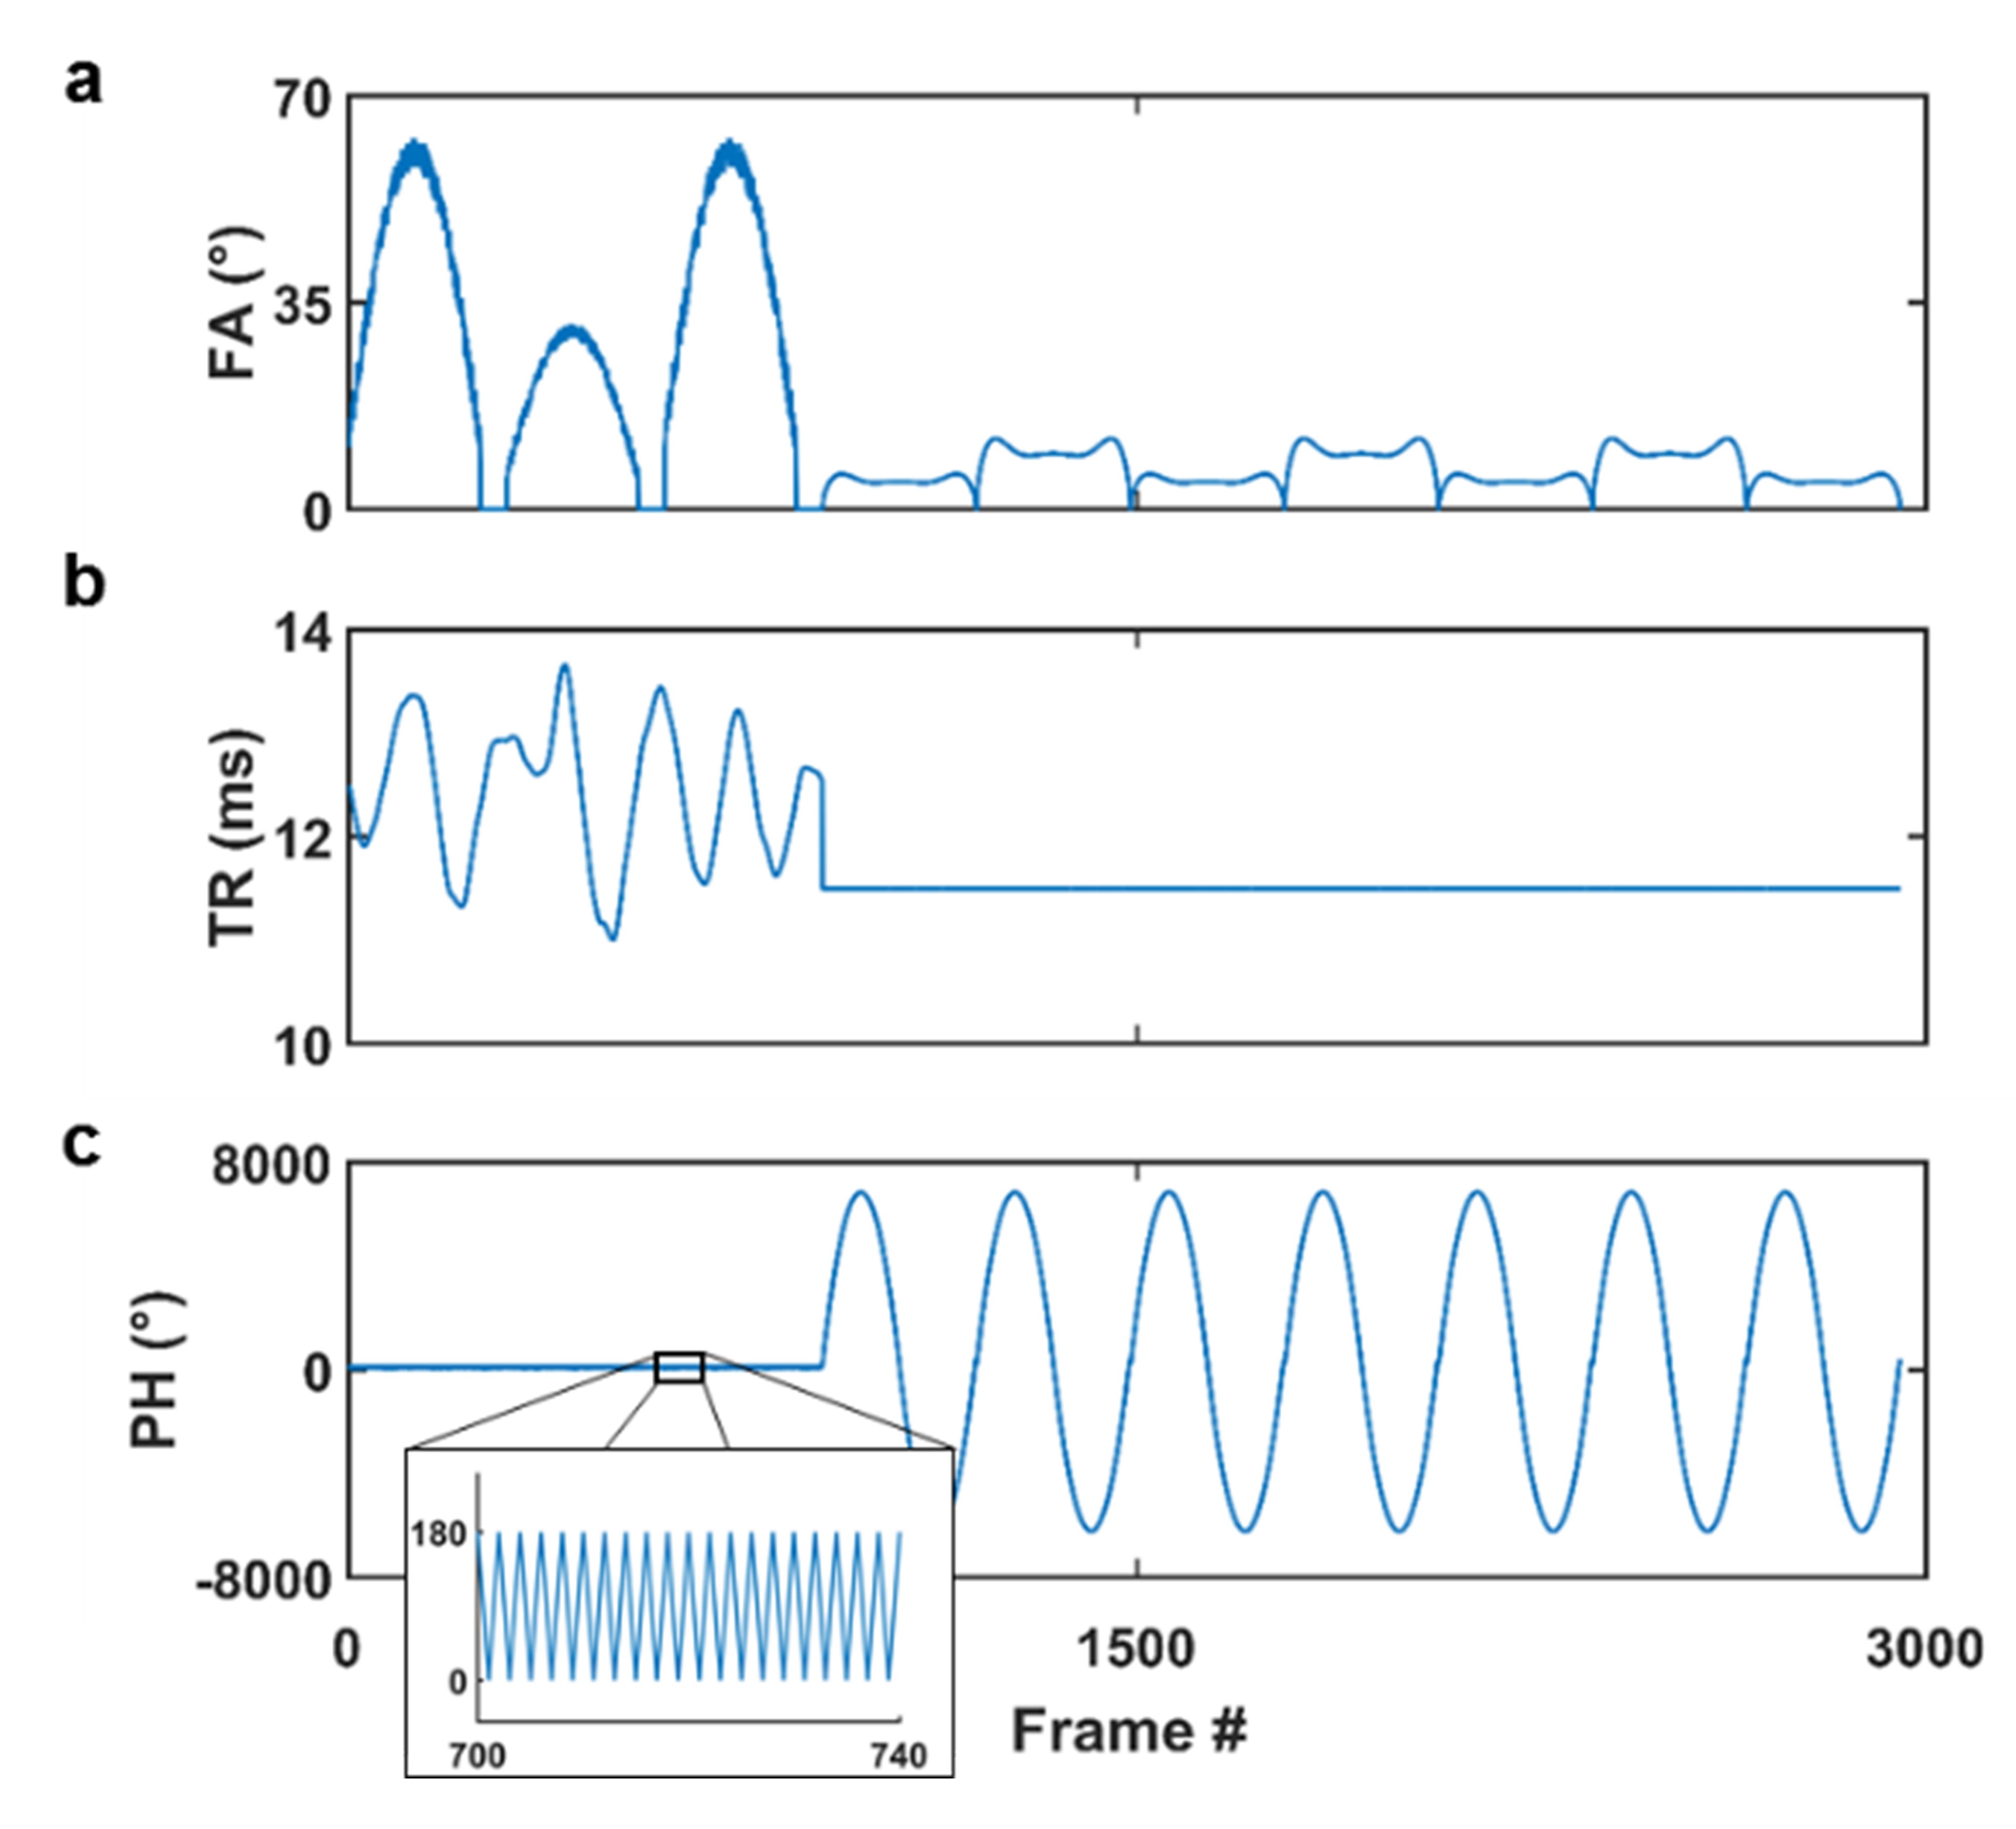
The qRF-MRF method used in this work was modified from the method presented previously2. The first 900 frames of the proposed qRF-MRF pulse sequence used the same flip angle (FA), repetition time (TR), and RF excitation phase (PH) as the bSSFP-MRF pulse sequence (Fig. 1). Starting from the 901st frame, a quadratically evolving PH was combined with a low FA (0-12°) and constant 11.5 ms TR pattern to generate signal time courses sensitive to T2* in addition to other tissue properties. Single-shot spirals3 were used to acquire a highly undersampled 256x256 image during each frame with 1.2 x 1.2 mm2 in-plane resolution and 5 mm slice thickness. A total of 3000 frames were acquired in 36.4 s per imaging slice.
The template matching method used to extract tissue property measurements from undersampled time frame data has been described previously2. Briefly, a dictionary of signal time courses was generated using different permutations of T1, T2, and δf values. The effect of T2* dictionary entry signal courses was accounted for by convolving Lorentzian lineshapes of varying fullwidth-at-halfmax (FWHM) values along the δf dimension of the dictionary. The T2* value associated with each dictionary entry was then calculated as $$$\frac{1}{{T_{2}}^{*}} = \frac{1}{{T_{2}}}+\pi FWHM$$$. Quantified parameter values were extracted from the dictionary entry with the highest computed l2-normalized inner product with each measured signal course.
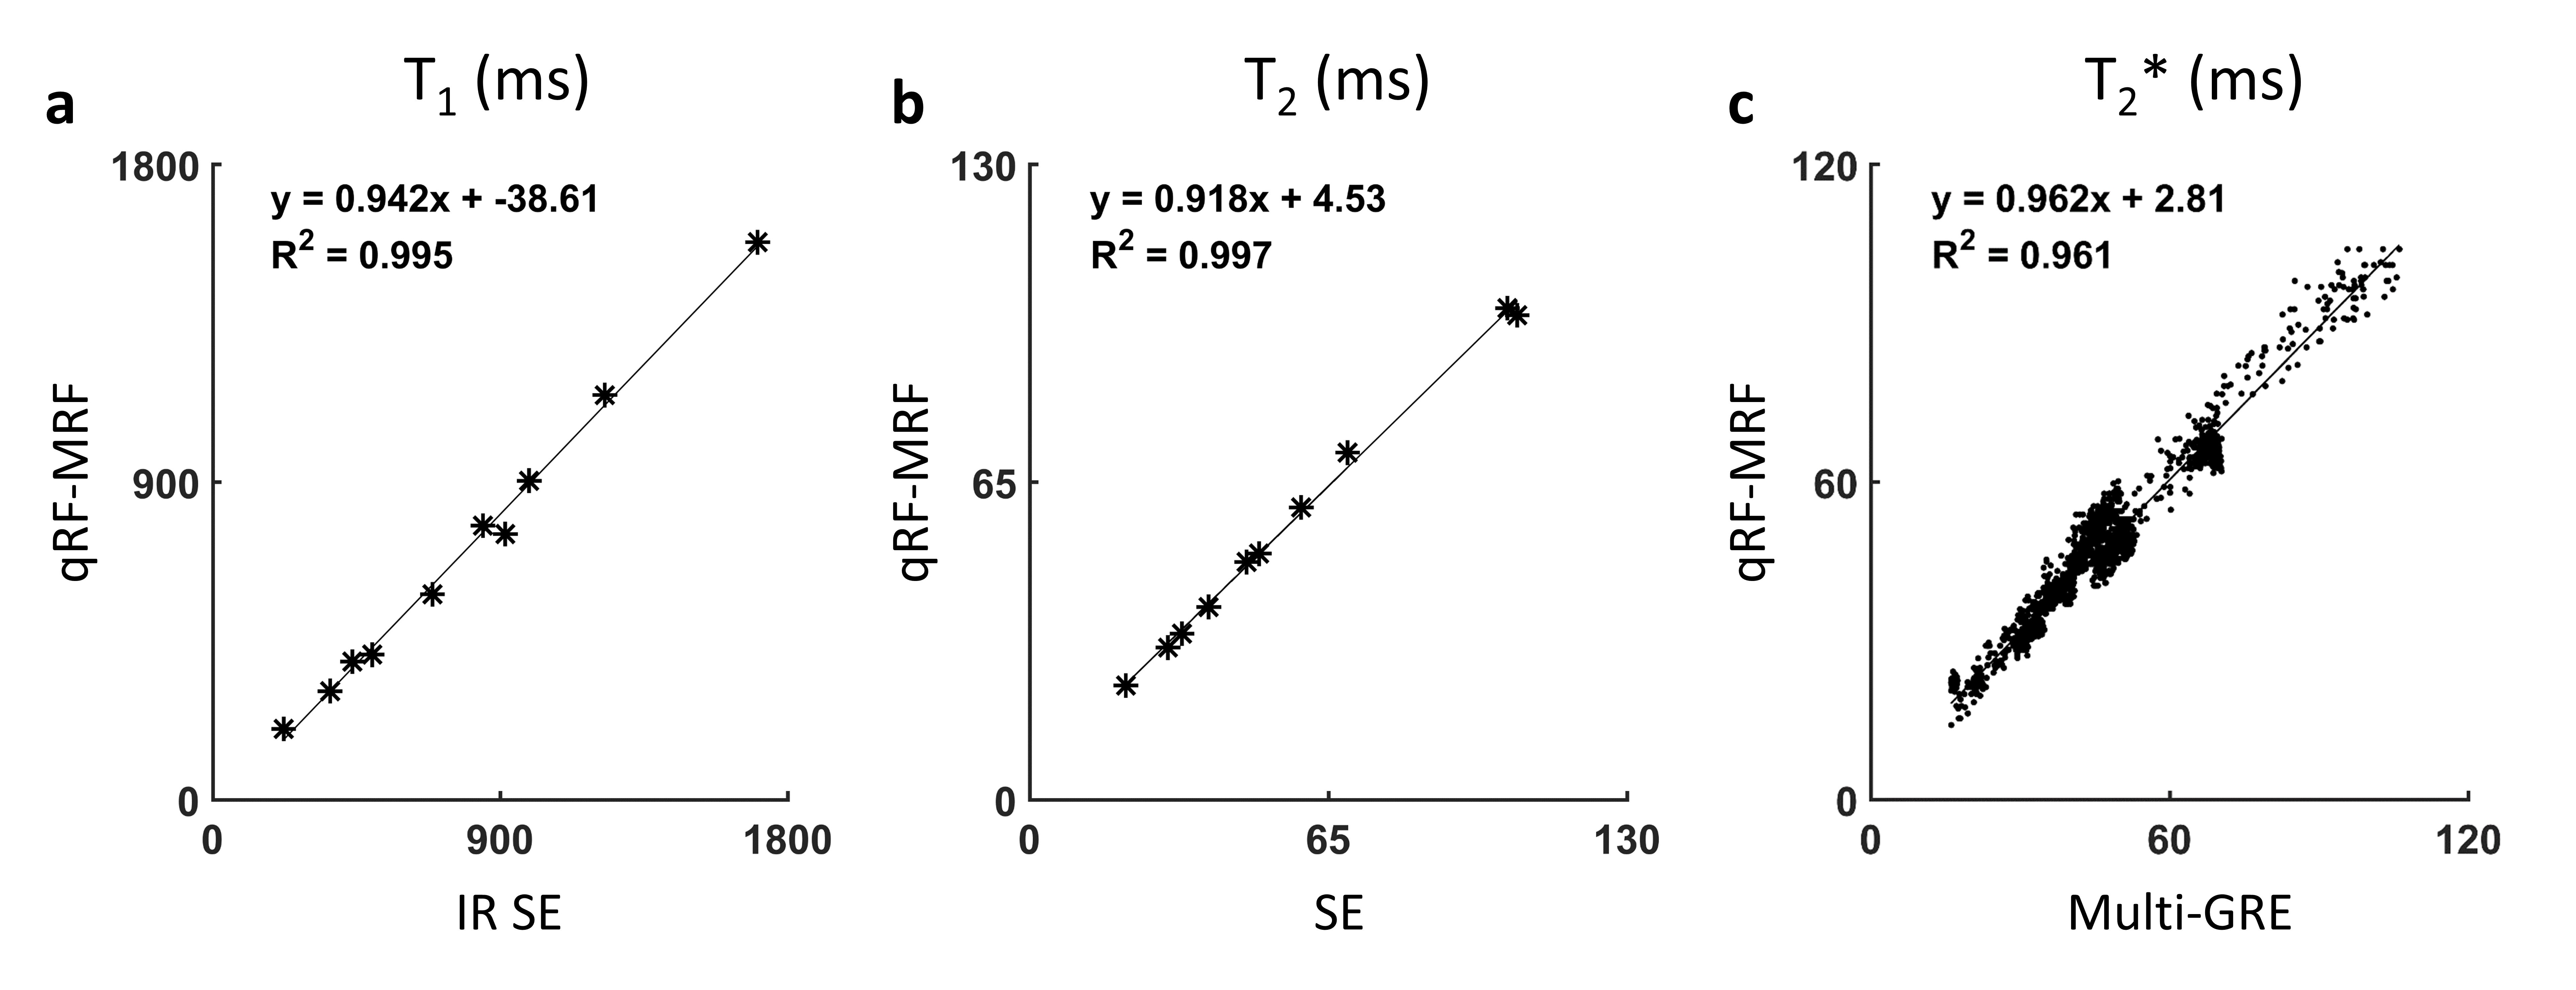
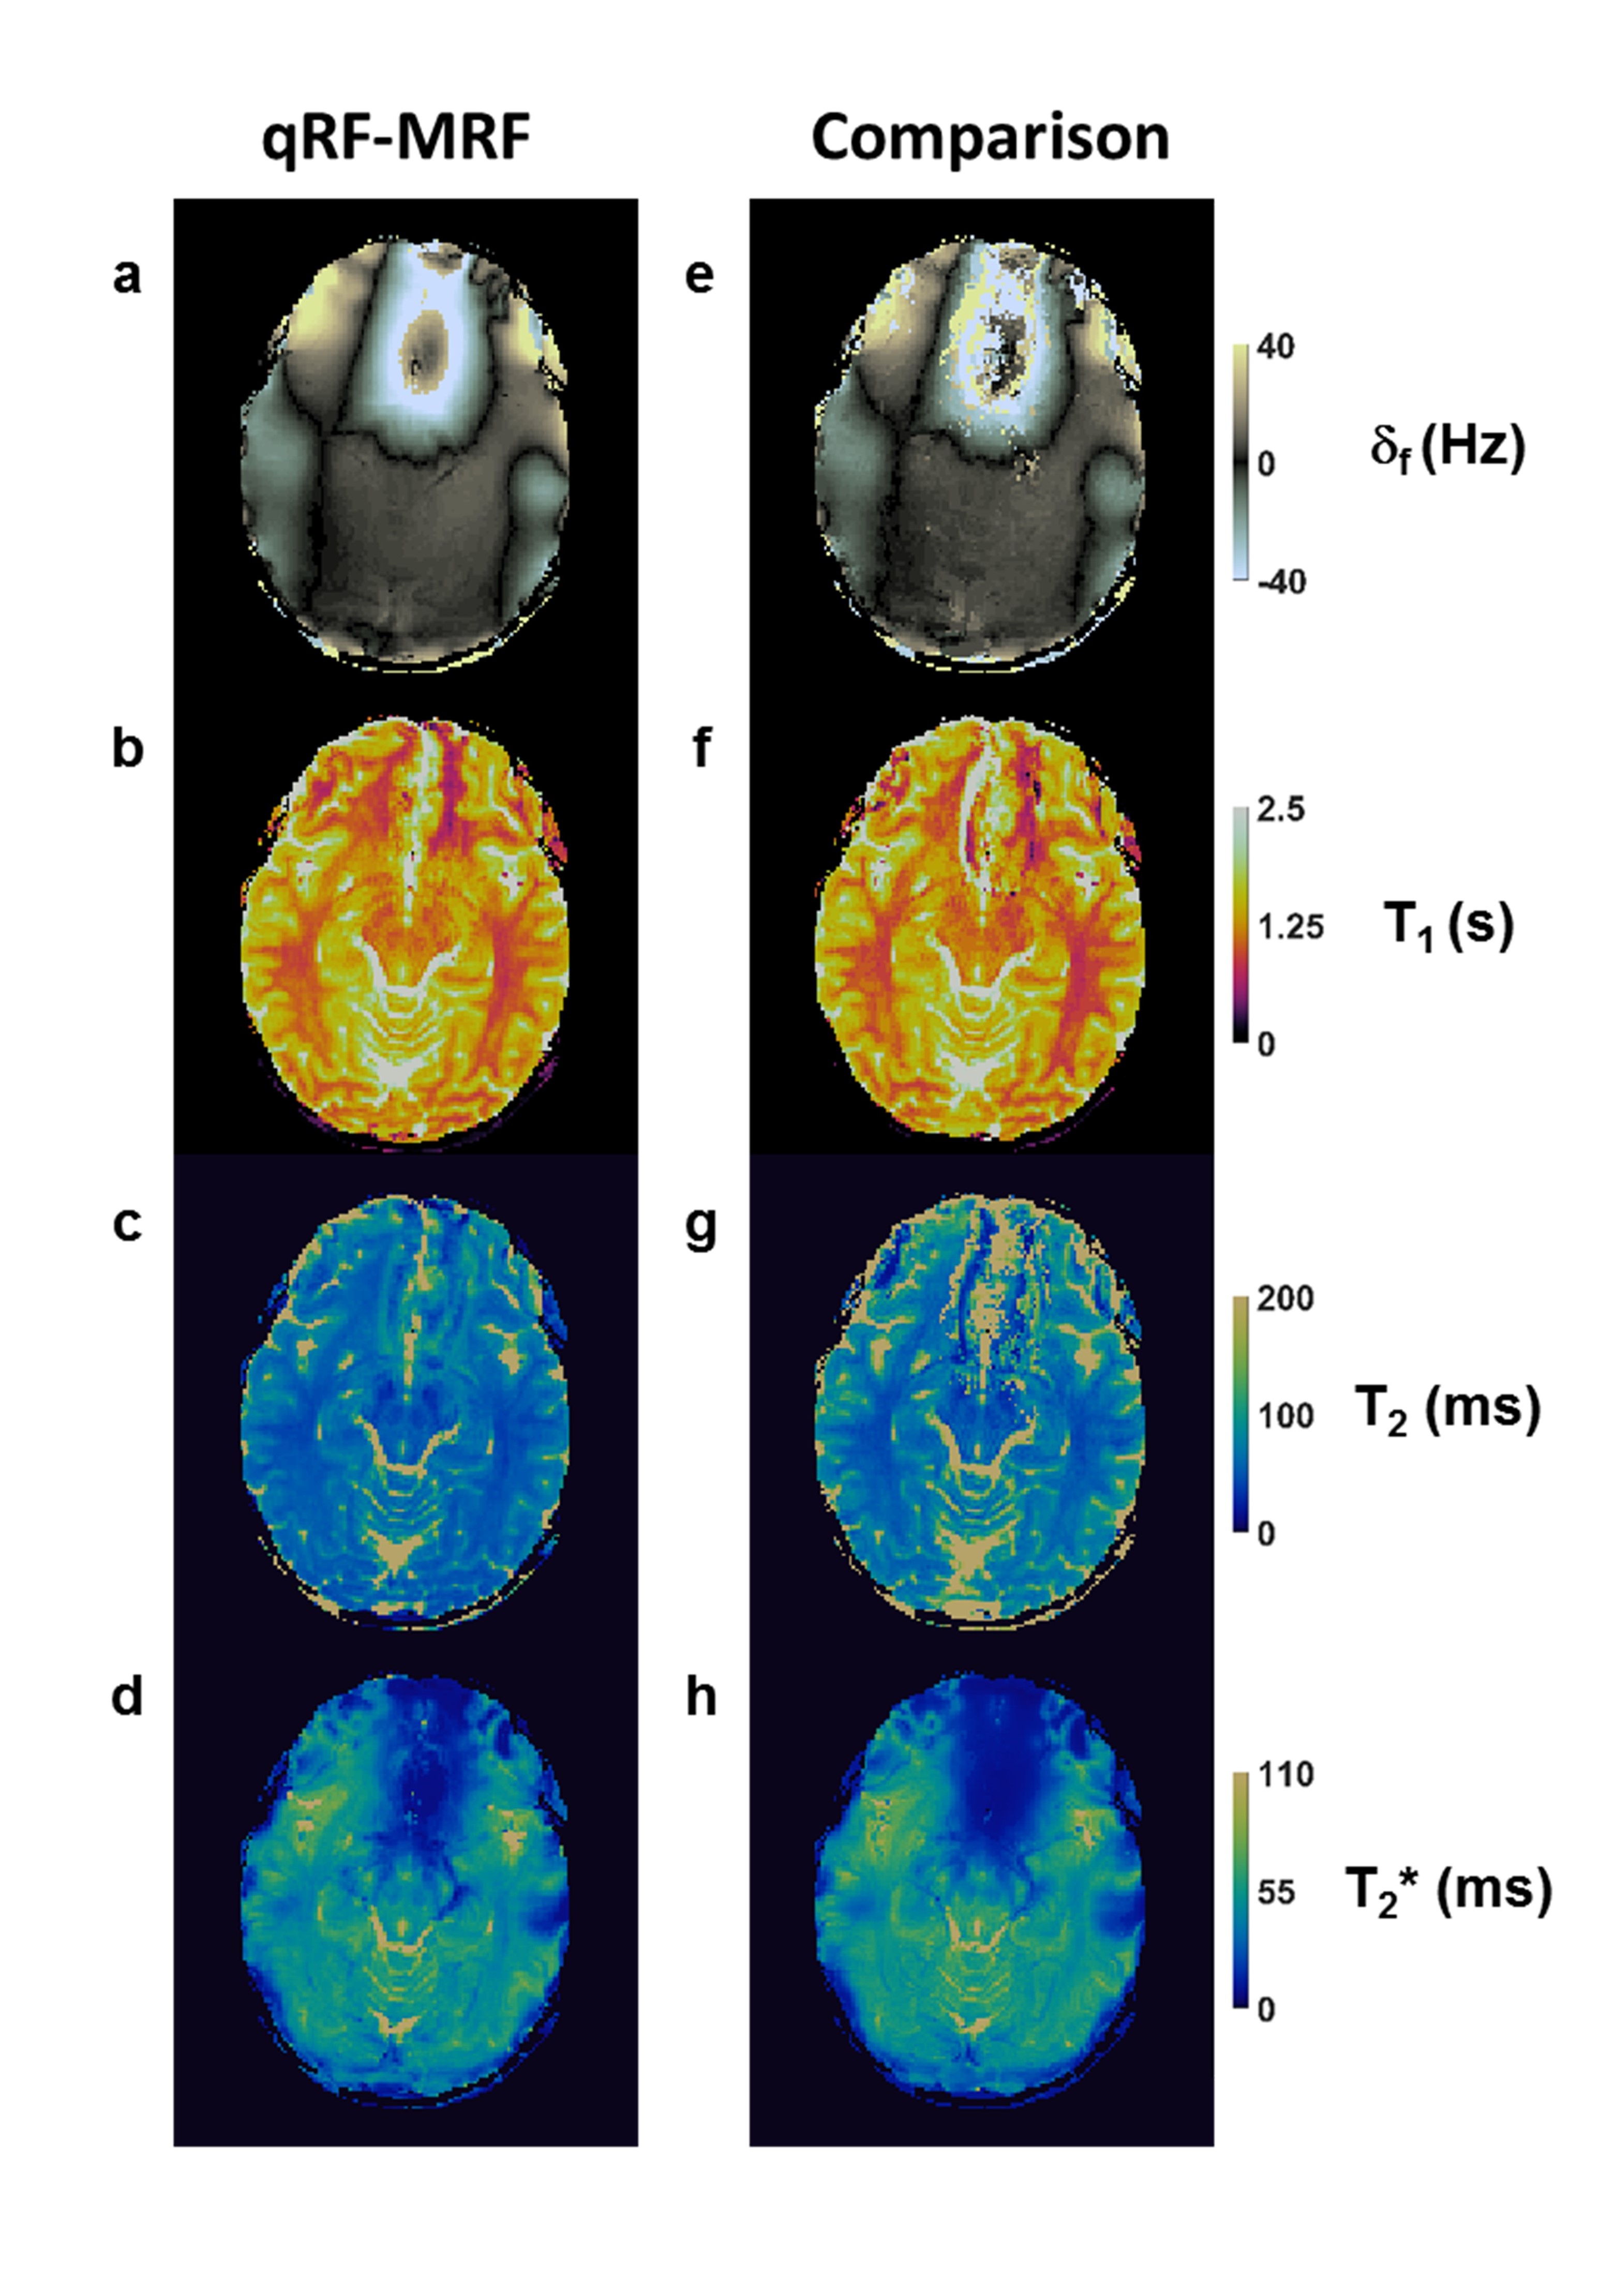
The quantification accuracy of the qRF-MRF method was first validated in gadopentate dimeglumine doped agarose gel phantoms. The accuracy of T1, T2, and T2* measurements by qRF-MRF was assessed against traditional Cartesian spin echo (SE) and multi-echo gradient echo (multi-GRE) measurements. qRF-MRF quantification was then performed with axial slices at the level of the substantia nigra in five volunteers. For comparison, bSSFP-MRF and multi-GRE tissue property maps were also obtained for each slice.
Results
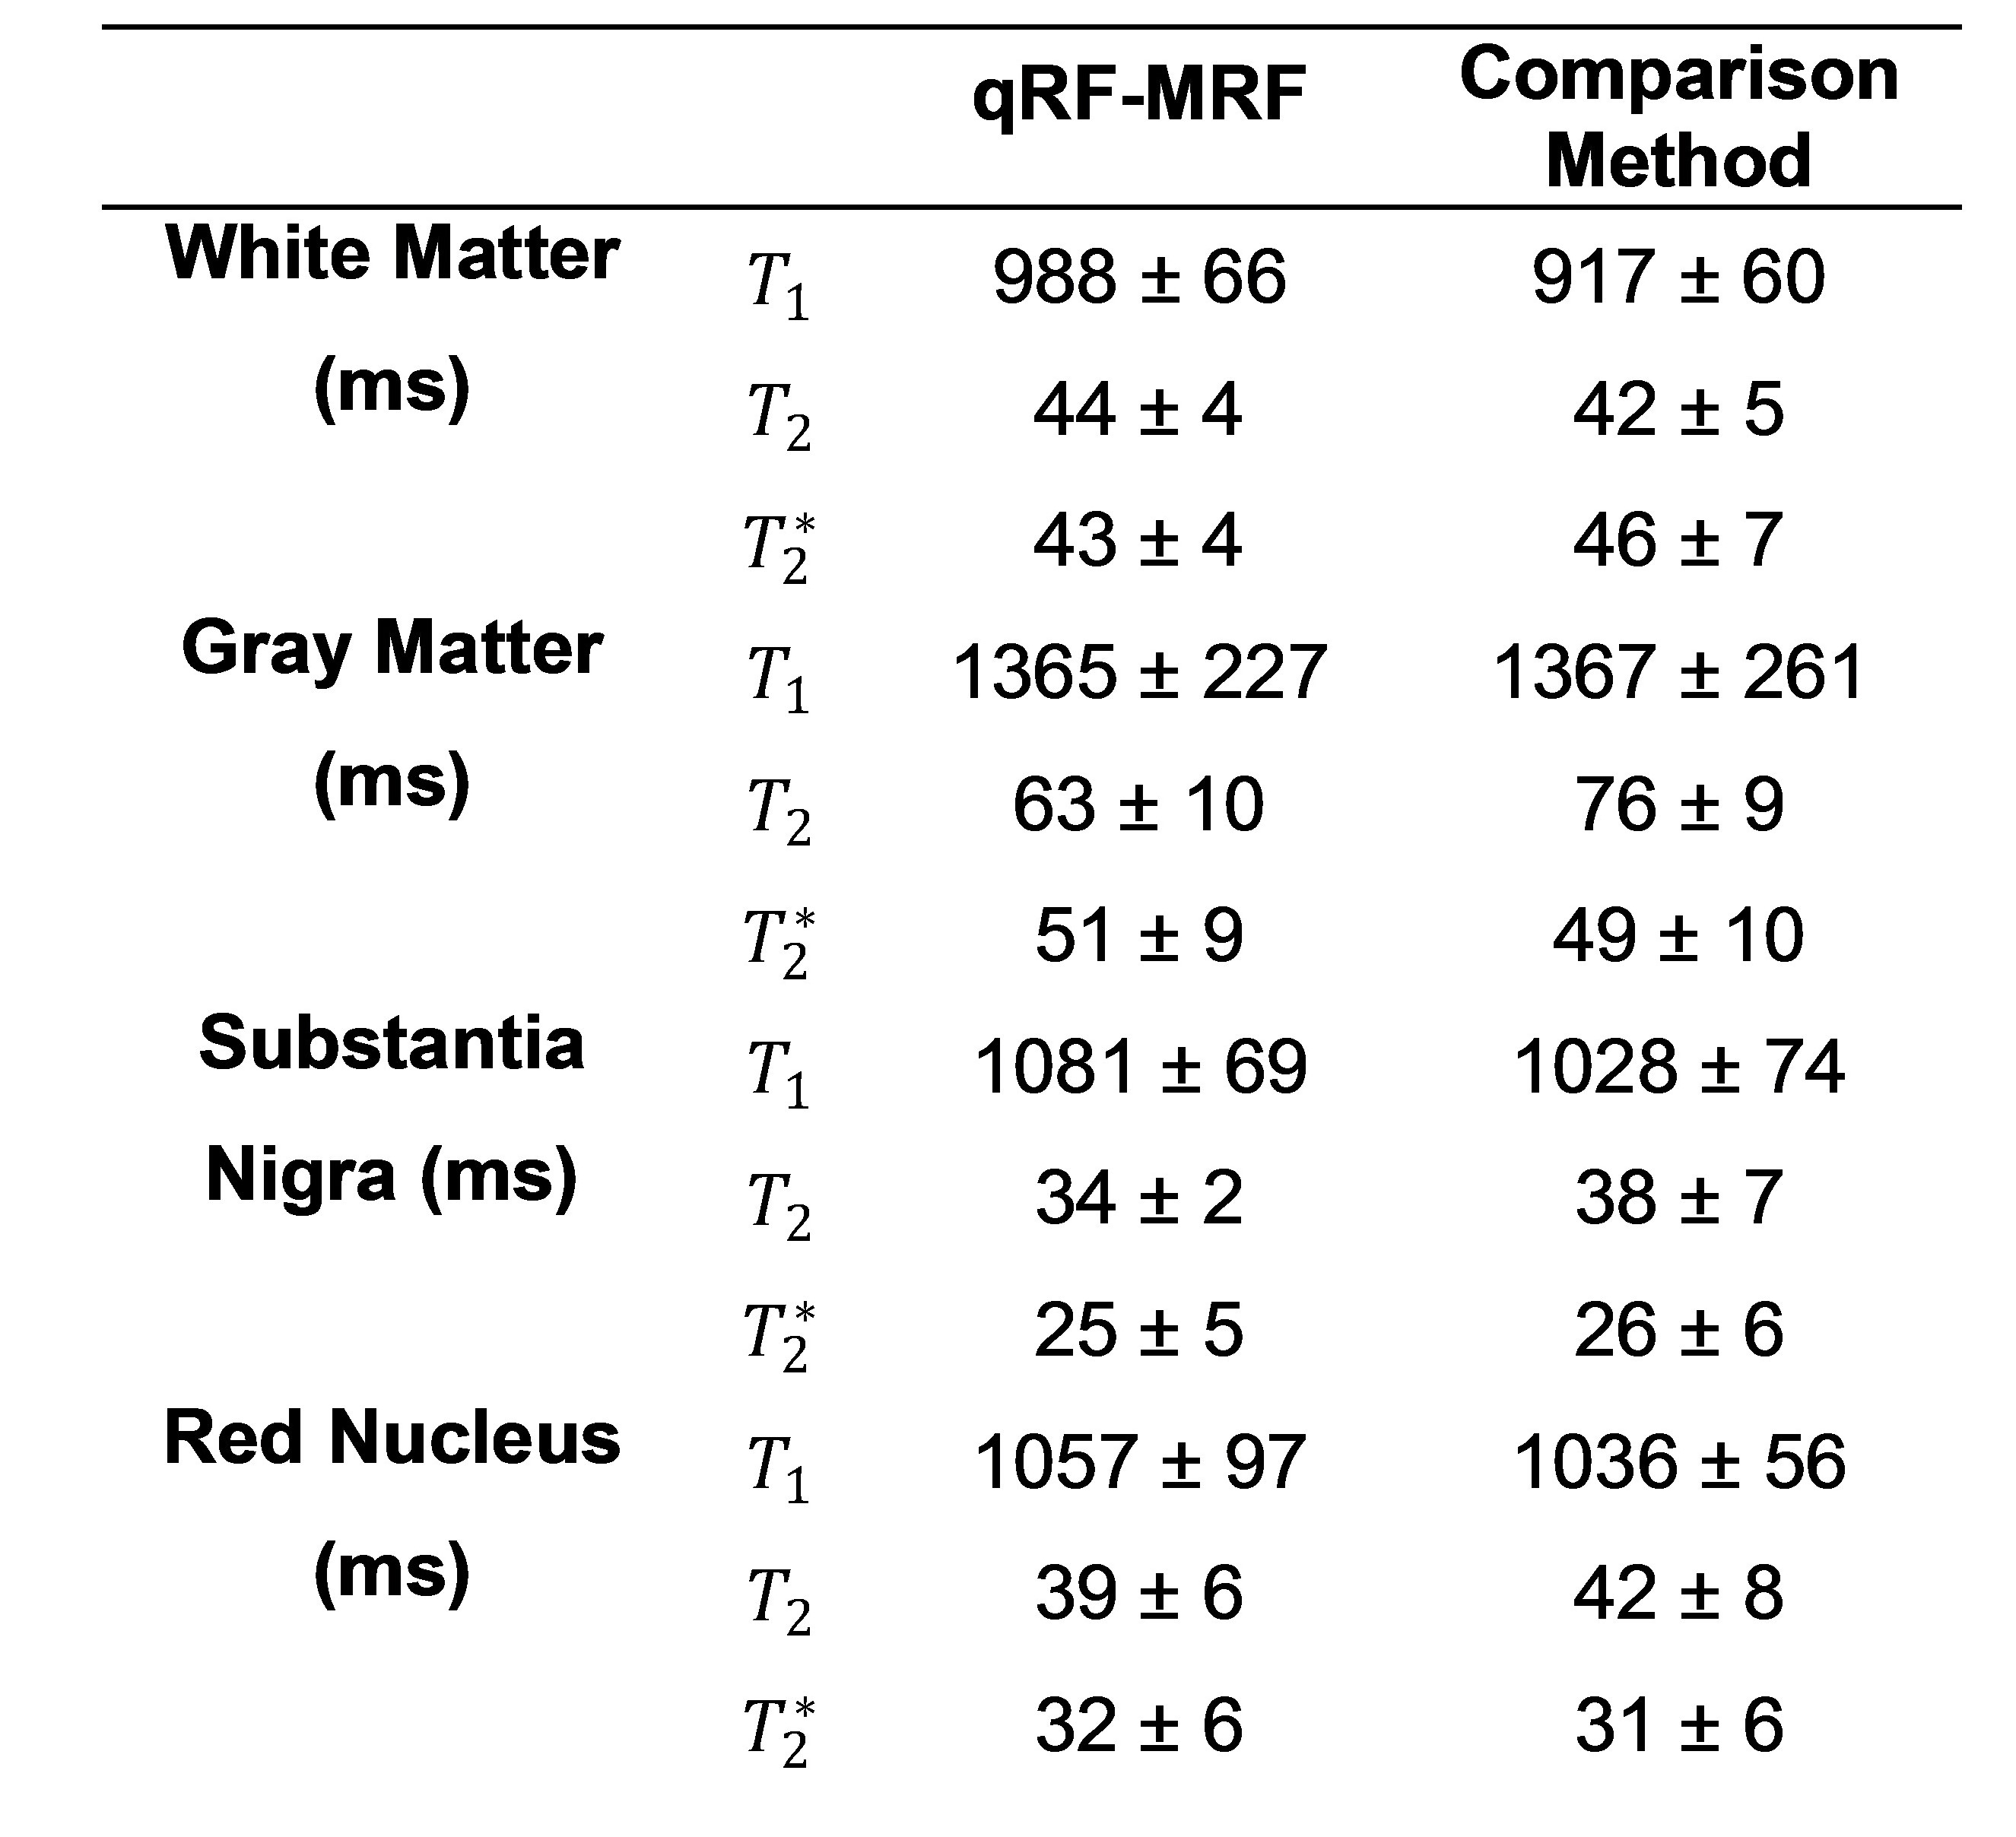
The accuracy of qRF-MRF measurements in phantom experiments is shown in Fig. 2. Fig. 3 shows representative quantitative maps derived from volunteer acquisitions. In vivo δf, T1, and T2 maps showed good agreement between qRF-MRF and bSSFP-MRF. Values for T1, T2, and T2* quantified by both qRF-MRF and comparison methods for manually selected ROIs are shown in Table 1.Discussion/Conclusion
The proposed qRF-MRF method, using quadratic RF phase to sensitize signal time courses to T2* in addition to spin parameters δf, T1, and T2 was used to obtain quantitative multi-parametric measurements in vivo in 36.4 s per 2D slice. Quantitative measurements performed in phantom and in vivo show good agreement with traditional measurement methods. This study suggests that simultaneous parameter mapping of δf, T1, T2, and T2* may be feasible in clinically relevant time.Acknowledgements
This work made use of the High Performance Computing Resource in the Core Facility for Advanced Research Computing at Case Western Reserve University. The authors would like to acknowledge funding from NIH TL1-TR000441, T32-EB007509, F30-HL124894, R01-EB023704, R01-HL094557, R01-DK098503, 1R01-EB016728, 5R01-EB017219, R21-HL126215, and Siemens Healthcare.References
1. Ma, D. et al., "Magnetic Resonance Fingerprinting", Nature 2013;495:187–92.
2. Wang C. et al., "Magnetic Resonance Fingerprinting with Quadratic RF Phase for Simultaneous Measurement of df, T1, T2, and T2*". Proc Intl Soc Mag Reson Med, Honolulu, USA, Electronic Poster 3960; 2017.
3. Jin H. Lee, et al., "Fast 3D imaging using variable-density spiral trajectories with applications to limb perfusion", MRM 2003; 50(6):1276.
Figures