1132
Magnetization Transfer effects in Actual Flip angle Imaging1School of Biomedical Engineering and Imaging Sciences, King's College London, London, United Kingdom
Synopsis
The AFI sequence is a robust flip angle mapping method and is used within quantitative MRI protocols. AFI is a modified spoiled gradient echo (SPGR) sequence, employing interleaved TR times of different lengths. It is well known that SPGR signal behaviour is sensitive to Magnetization Transfer effects, so in this work we used a two-pool model to derive signal equations for AFI that include MT. We found that MT will lead to an underestimation of flip angle by up to 6% in white matter and that longer TR and lower RF energy lead to larger bias.
Introduction
B1+ field mapping is required for characterizing inhomogeneity seen at high field (B0≥3T). Accuracy is particularly important when using B1+ maps for quantitative MRI, since small errors in B1+ estimation may translate non-linearly to the parameter value estimates1,2. The actual flip-angle3 (AFI) sequence is a modified spoiled gradient echo (SPGR) acquisition with interleaved TR times (TR1 and TR2=nTR1). AFI has been shown to be robust when using strong gradient spoiling4,5,6, and has been used for a variety of quantitative techniques4,7–10. However it has also been well demonstrated that SPGR sequences are sensitive to magnetization transfer (MT) effects, and that these will lead to a bias when used for quantitative purposes11. Hence we investigated potential MT effects on the AFI sequence.Theory
MT effects can be well described using a “two-pool” model in which longitudinal magnetization has two components $$$\mathbf{M_z}=[M_z^f M_z^r]^T$$$ where $$$M_z^f$$$ is ‘free’ (observable) magnetization and $$$M_z^r$$$ is ‘restricted’ magnetization associated with macromolecules and not directly observed. During evolution periods the modified Bloch equations12 are written $$$\mathbf{\dot{M}_z}=\mathbf{\Lambda M_z +C}$$$ where:
$$\mathbf{\Lambda} = \begin{bmatrix} -R_1^f-k & k/f \\ k & -R_1^r -k/F\end{bmatrix}$$
and
$$\mathbf{C}=\begin{bmatrix} R_1^f M_0^f \\ R_1^r M_0^r \end{bmatrix}$$
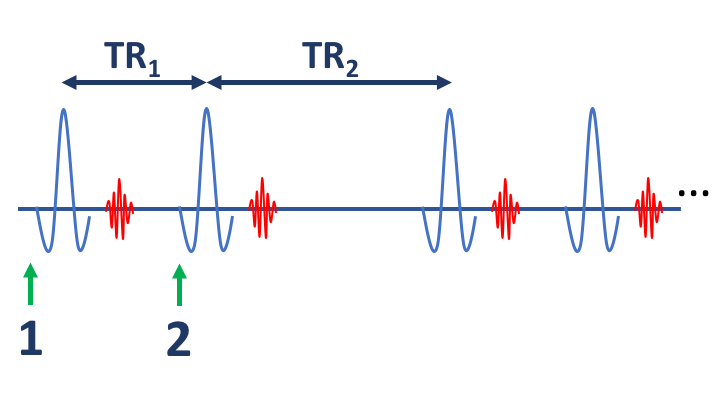
Each pool has its own relaxation rate $$$R_1^{f,r} $$$; k is the exchange rate from free to restricted pool; and F is the ratio of pool sizes $$$\frac{M_0^r}{M_0^f}$$$. An RF pulse of flip angle $$$\alpha$$$ rotates the free-pool and saturates the bound-pool, so $$$\mathbf{M_z \rightarrow \Theta M_z}$$$. Here $$$\mathbf{\Theta}=\begin{bmatrix} \cos\alpha & 0\\ 0 & e^{-\pi\gamma^2 G E_{rf}}\end{bmatrix}$$$ where G is the absorption rate of the tissue13 and $$$E_{rf}$$$ is RF pulse energy in units $$$\mu T^2 ms$$$. Figure 1 shows a sequence diagram. Steady-state expressions for magnetization at points 1 and 2 (i.e. directly before each RF pulse) are:
$$\mathbf{ M_z^1 = \left(1 - \Xi_2\Theta\Xi_1\Theta\right)^{-1}\left(\Xi_2\Theta\left(\Xi_1-1\right)+\left(\Xi_2-1\right)\right)\Lambda^{-1}C }$$
$$\mathbf{ M_z^2 = \Xi_1\Theta M_z^1 + \left(\Xi_1-1\right)\Lambda^{-1}C }$$
where $$$\mathbf{\Xi_{1,2}} = \exp\left(\mathbf{\Lambda}TR_{1,2}\right)$$$.
Methods
Apparent flip angle $$$\hat{\alpha}$$$ was estimated using the standard AFI formula3 on the ratio $$$\frac{M_z^{f,2}}{M_z^{f,1}}$$$ . MT parameters for white matter (k=4.3s-1,F=0.132;T1=779ms) and gray matter (k=1.8s-1,F=0.062,T1=1211ms) were taken from Gloor et al14. Following Gloor et.al, we fix $$$R_1^f=R_1^r$$$ and $$$T_2^r=12\mu s$$$. A single healthy adult volunteer was imaged at 3T using AFI with $$$\alpha=60°$$$, $$$E_{rf}=48.7\mu T^2ms$$$, resolution 1.5x1.5x3mm3, 30mm slab size for TR1=30,50,60 and 80ms with n=5. Strong gradient spoiling was employed.
Results
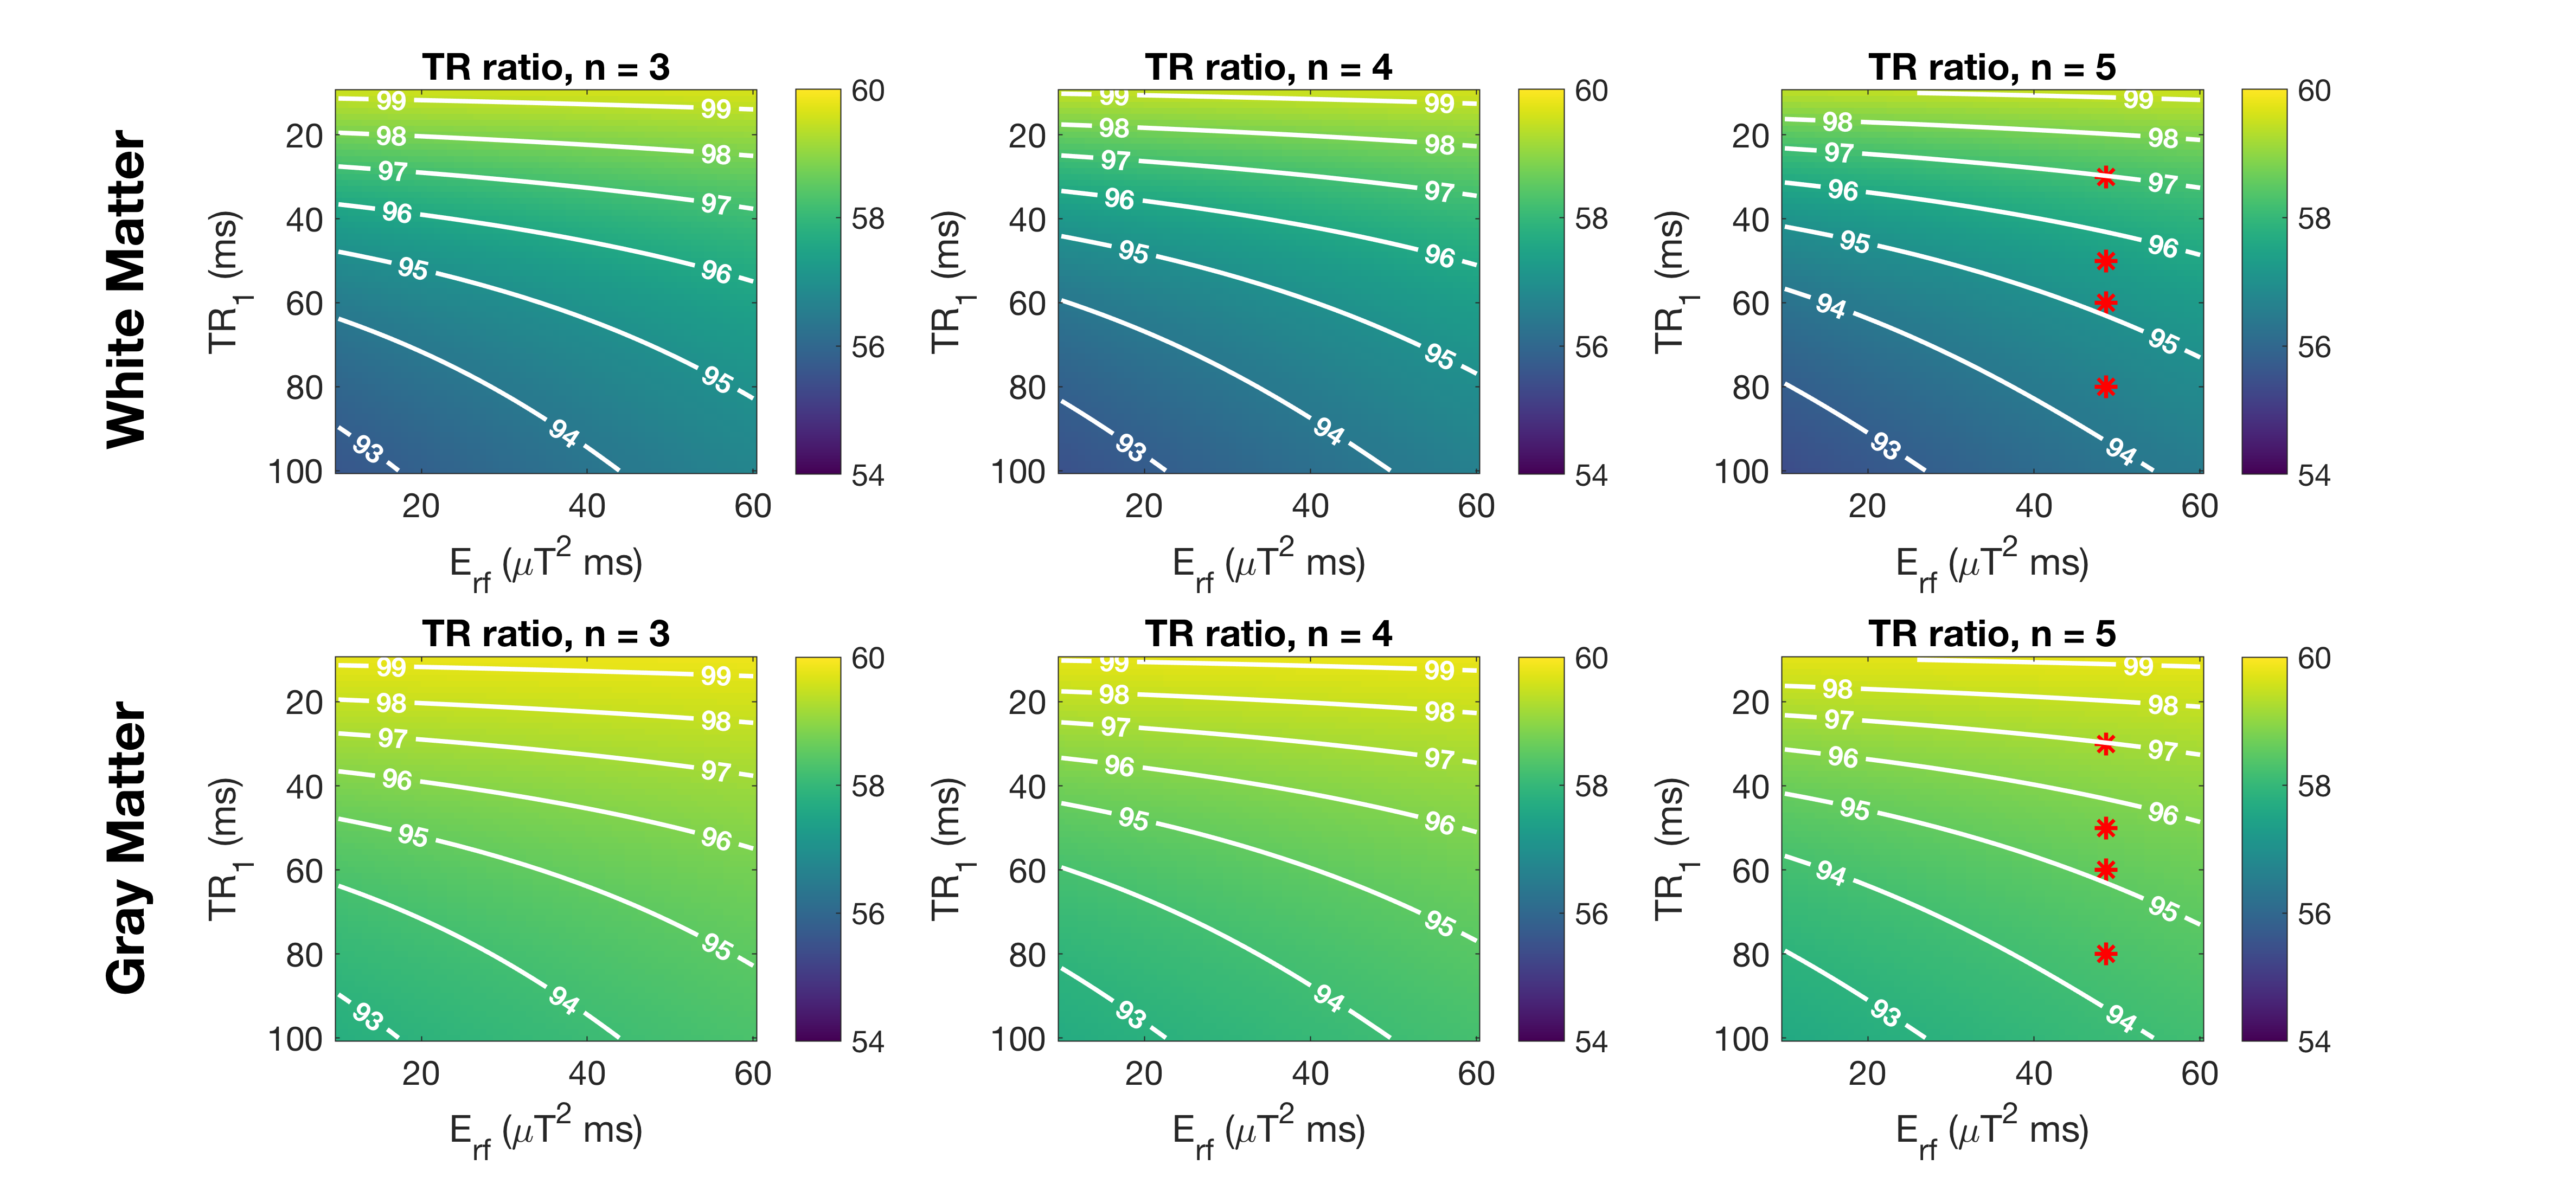
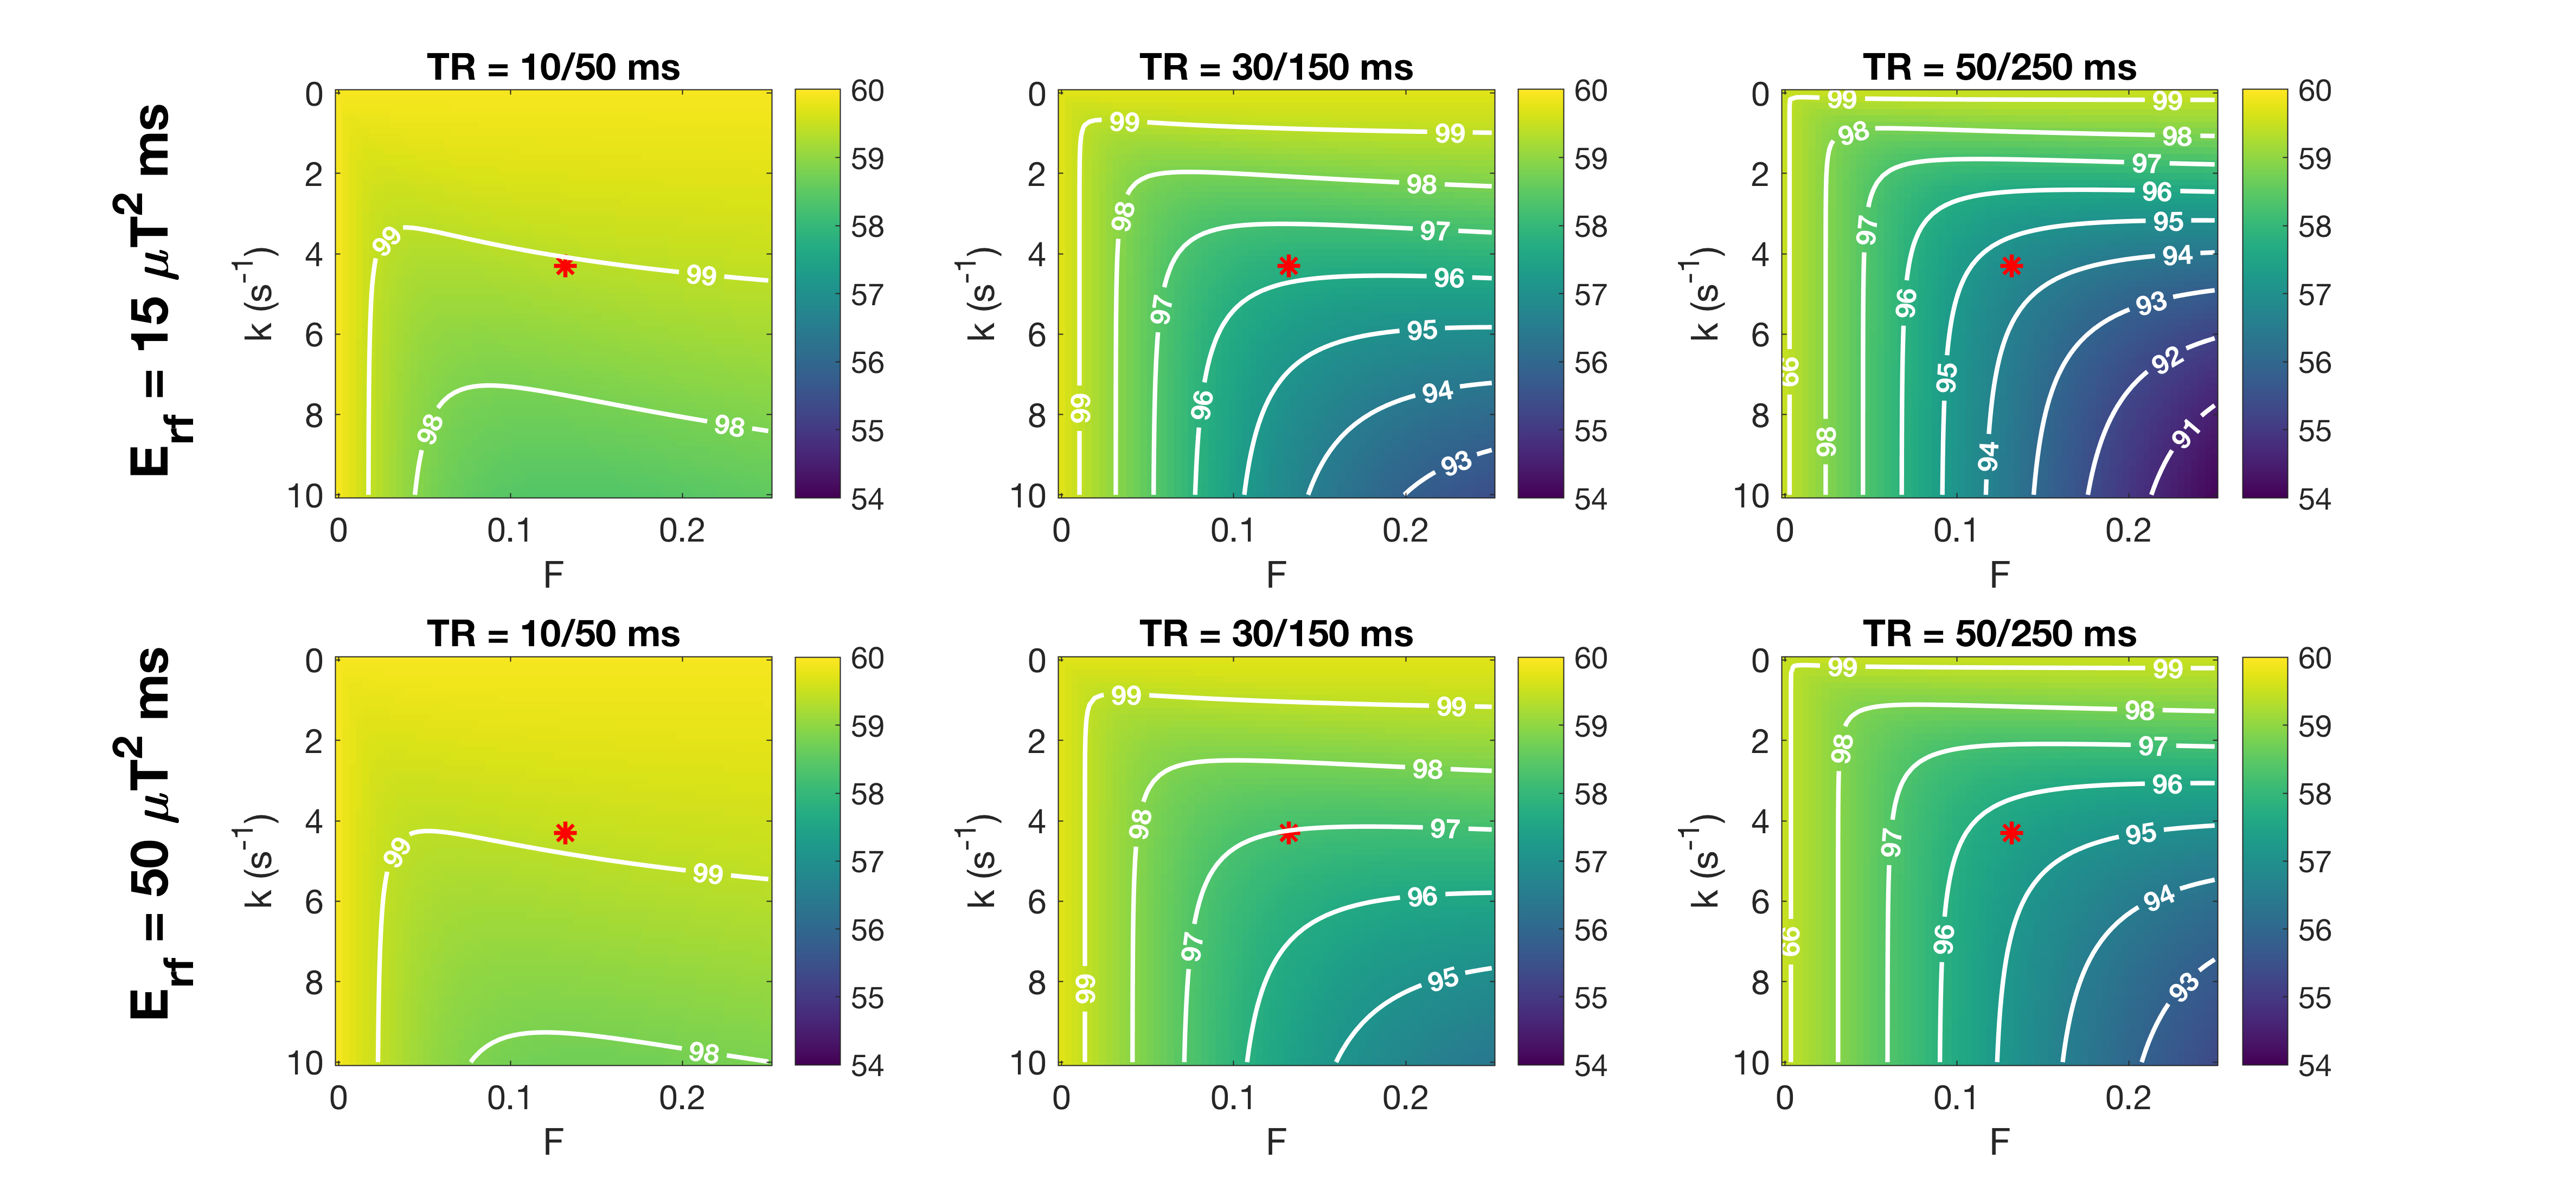
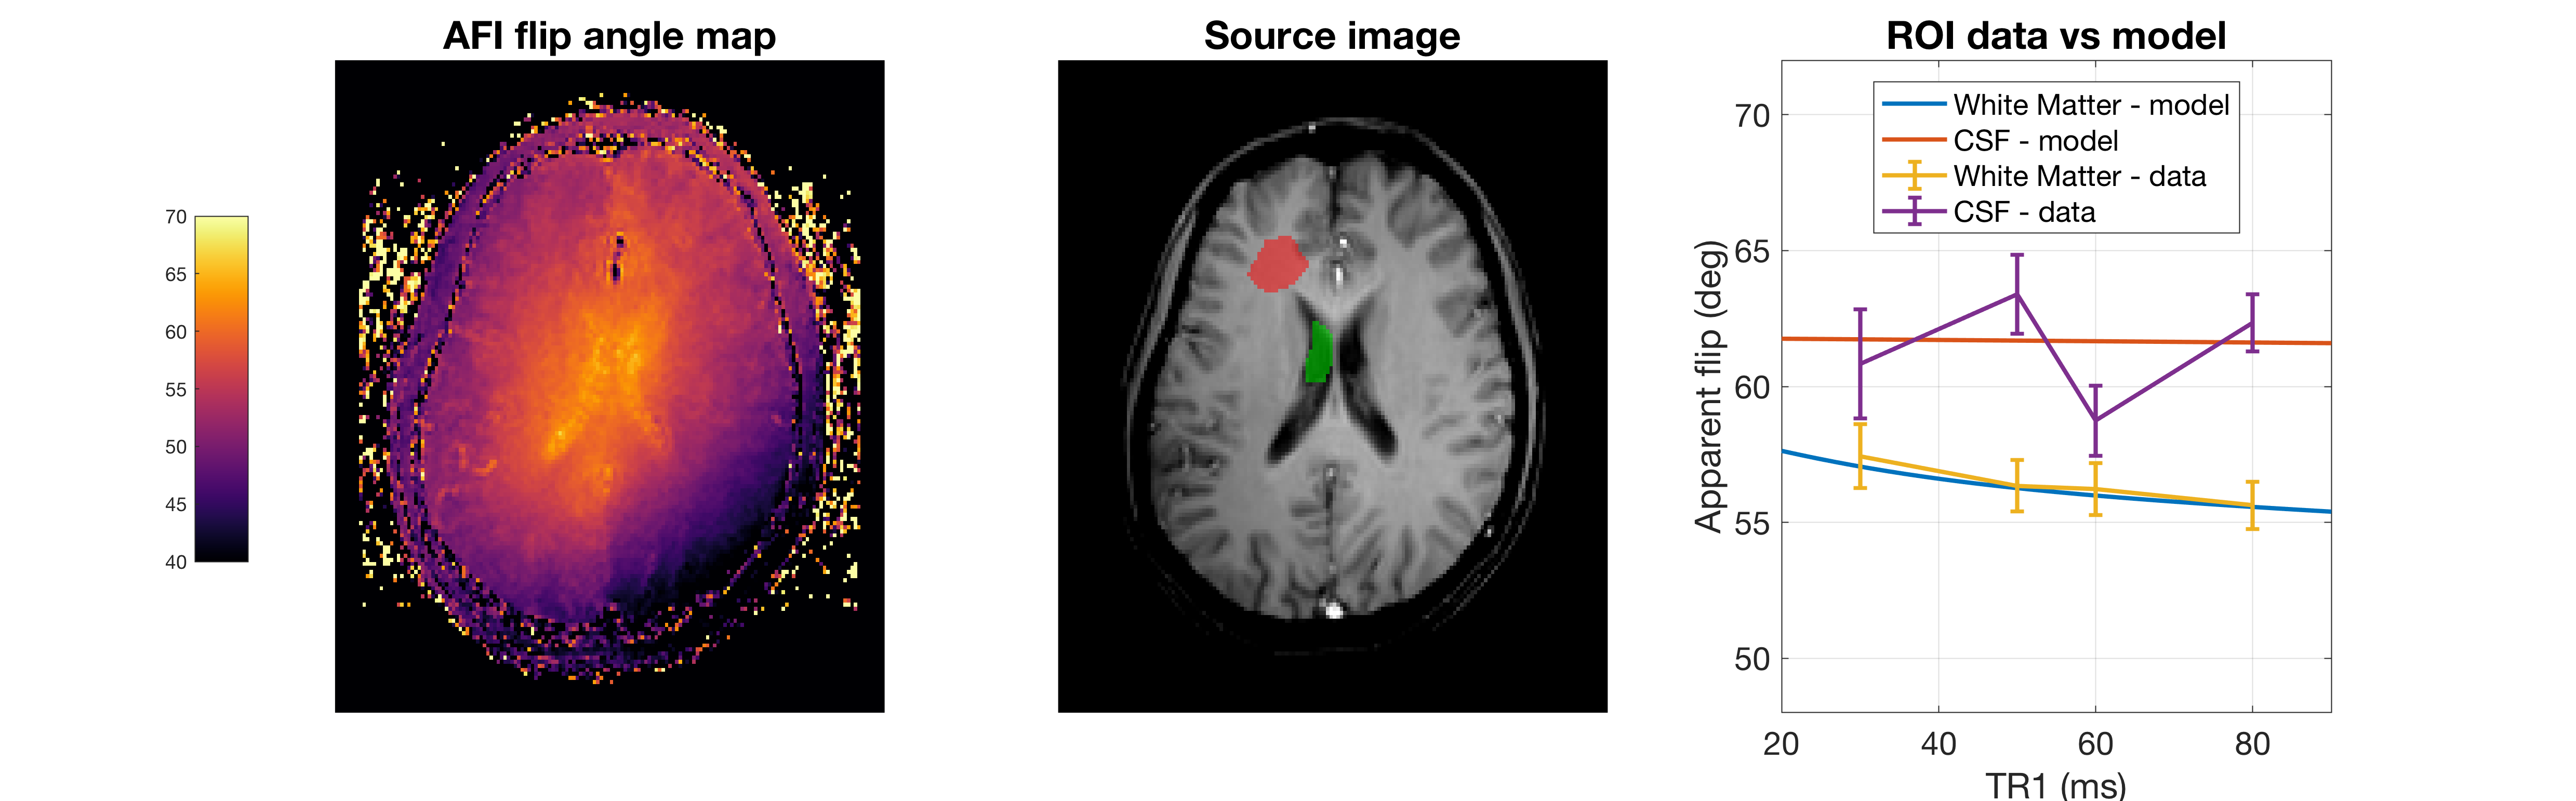
Figure 2 shows variation in $$$\hat{\alpha}$$$ for actual flip angle 60° as TR1 and $$$E_{rf}$$$ are varied for sequences with n=3,4,5 in both white matter (WM) and gray matter (GM). $$$\hat{\alpha}$$$ falls as TR1 increases, and as $$$E_{rf}$$$ is reduced. Figure 3 shows how $$$\hat{\alpha}$$$ would vary for a tissue with the same T1 as white matter, but as k and F vary; $$$\hat{\alpha}$$$ falls as k or F increases (setting either to zero represents a tissue with no MT). As Figure 2 also showed, the effects are much more marked for the lower $$$E_{rf}$$$ and longer TR1 sequences. Figure 4 shows the in-vivo result, including a flip angle map (TR1=80ms, n=5). ROI measurements are plotted against predicted $$$\hat{\alpha}$$$ for white matter, and CSF as a control (no MT). The model predictions were adjusted to account for the fact that B1+ is lower in the WM ROI than CSF because of the existing B1+ ‘doming’ effect (CSF+3%,WM-2%). The WM data appears to follow the downward trend as TR1 increases, predicted by the model. The ventricles stand out with a higher flip angle than surrounding tissue; this is consistent with flip angle being systematically underestimated in surrounding WM.Discussion & Conclusion
Predictions suggest that the AFI sequence will systematically underestimate the flip angle in WM, worsening as TR1 increases or $$$E_{rf}$$$ falls. A small reduction in $$$\hat{\alpha}$$$ would be expected as TR1 increases, simply because the assumption that TR<<T1 is increasingly violated. However this is a smaller effect (see k=0 on Fig.3) – the MT effects enhance this significantly. Further, it is counterintuitive that the effect should worsen as TR1 increases and $$$E_{rf}$$$ falls, since MT effects are classically associated with high RF power. A possible explanation is that lower $$$E_{rf}$$$ leaves the restricted pool less saturated, so more prominent in the dynamics of the system. The brightness of the ventricles in AFI has been observed by others, and even postulated as a real electromagnetic effect15. The two-pool model suggests MT as another possible explanation, however Brink et.al observed the effect using many B1+ mapping sequences, which would be unlikely to all have similar MT sensitivity. Experimental data obtained so far suggests some agreement with the model, however more precise measurements are needed. If confirmed, although a small effect, MT influence on AFI could be a confound for qMRI/qMT methods that use it for making predictions with complex models.Acknowledgements
This work was supported by the Wellcome EPSRC Centre for Medical Engineering at Kings College London (WT 203148/Z/16/Z), MRC strategic grant MR/K006355/1, EPSRC fellowship award (EP/L00531X/1) and by the National Institute for Health Research (NIHR) Biomedical Research Centre based at Guy’s and St Thomas’ NHS Foundation Trust and King’s College London. The views expressed are those of the authors and not necessarily those of the NHS, the NIHR or the Department of Health.
References
1. Lankford, C. L. & Does, M. D. Propagation of error from parameter constraints in quantitative MRI: Example application of multiple spin echo T2 mapping. Magn. Reson. Med. 0, (2017).
2. Helms, G., Dathe, H. & Dechent, P. Quantitative FLASH MRI at 3T using a rational approximation of the Ernst equation. Magn. Reson. Med. 59, 667–672 (2008).
3. Yarnykh, V. L. Actual flip-angle imaging in the pulsed steady state: a method for rapid three-dimensional mapping of the transmitted radiofrequency field. Magn. Reson. Med. 57, 192–200 (2007).
4. Yarnykh, V. L. Optimal radiofrequency and gradient spoiling for improved accuracy of T1 and B1 measurements using fast steady-state techniques. Magn. Reson. Med. 63, 1610–26 (2010).
5. Nehrke, K. On the steady-state properties of actual flip angle imaging (AFI). Magn. Reson. Med. 61, 84–92 (2009).
6. Lutti, A. et al. Robust and fast whole brain mapping of the RF transmit field B1 at 7T. PLoS One 7, 1–7 (2012).
7. Voigt, T., Katscher, U. & Doessel, O. Quantitative conductivity and permittivity imaging of the human brain using electric properties tomography. Magn. Reson. Med. 66, 456–66 (2011).
8. Teixeira, R. P. A. G., Malik, S. J. & Hajnal, J. V. Joint System Relaxometry (JSR) and Cramer-Rao Lower Bound Optimization of Sequence Parameters: A Framework for Enhanced Precision of DESPOT T1 and T2 Estimation. Magn. Reson. Med. 0, (2017).
9. Katscher, U. et al. Determination of electric conductivity and local SAR via B1 mapping. IEEE Trans. Med. Imaging 28, 1365–74 (2009).
10. Hurley, S. A. et al. Simultaneous variable flip angle - Actual flip angle imaging method for improved accuracy and precision of three-dimensional T 1 and B 1 measurements. Magn. Reson. Med. 68, 54–64 (2012).
11. Ou, X. & Gochberg, D. F. MT effects and T1 quantification in single-slice spoiled gradient echo imaging. Magn. Reson. Med. 59, 835–845 (2008).
12. Sled, J. G. & Pike, G. B. Quantitative Imaging of Magnetization Transfer Exchange and Relaxation Properties In Vivo Using MRI. 931, 923–931 (2001).
13. Graham, S. J. & Henkelman, R. M. Understanding pulsed magnetization transfer. J. Magn. Reson. Imaging 7, 903–912 (1997).
14. Gloor, M., Scheffler, K. & Bieri, O. Quantitative magnetization transfer imaging using balanced SSFP. Magn. Reson. Med. 60, 691–700 (2008).
15. Brink, W. M., Börnert, P., Nehrke, K. & Webb, A. G. Ventricular B1+ perturbation at 7T – real effect or measurement artifact ? 5–8 (2014). doi:10.1002/nbm.3112
Figures