1130
In-vitro demonstration of explicit temperature control using pTx and temperature virtual observation points at 7T1NeuroSpin, CEA, Saclay, France, 2CMRR, University of Minnesota, Minneapolis, MN, United States
Synopsis
Recent numerical studies have shown that temperature could be controlled explicitly at the pulse design stage in parallel transmission, furthermore reporting that further scan performance could be gained if the more relevant safety metric that is temperature, instead of the specific absorption rate, was controlled. Bioheat models yet are still undergoing experimental validations. So as a first step, this work reports an experimental demonstration of flip-angle homogenization with temperature control on a water phantom with parallel transmission at 7T.
Introduction
Although temperature rise induced by RF waves is recognized as a more relevant safety measure in MR exams than the Specific Absorption Rate (SAR), the latter has been ubiquitously used as gold standard for simplicity. SAR on the other hand is just one of the multi-factors impacting temperature and the lack of direct relationship between the two metrics has worsened with the advent of parallel transmission (pTx). Recently, it was shown that temperature could be controlled explicitly at the pulse design stage with so-called temperature matrices and resulting compressed Temperature Virtual Observation Points (TVOPs)1. The study was numerical but nonetheless showed that further scan and safety performance could be gained if temperature, instead of SAR, was controlled. As a first step, hence we here present an experimental demonstration of flip-angle (FA) homogenization with temperature control on a water phantom with pTx.Methods
Experiments were performed on a 7T Magnetom scanner (Siemens Healthcare, Erlangen, Germany) and with the 8Tx-8Rx RapidBiomed coil (Rapid Biomedical, Rimpar, Germany). The sample was a 16 cm diameter agar-gel phantom with 4 g/l NaCl (s=0.78 S/m and er=72). Electric and magnetic RF fields for each channel were returned by simulation using the HFSS (Ansys, Canonsburg, PA, USA) software after tuning/matching the array with cosimulation. B1 field map measurements were performed and compared with the simulated maps. A calibration procedure based on this comparison was then applied to correct for unaccounted losses, phase offsets and additional coupling effects in the numerical domain2, which was propagated to the simulated electric fields. SAR Q-matrices were then computed and fed to the heat diffusion equation (30 min sequence) with Neumann’s boundary conditions (h=10W/m2/K) to build temperature matrices, which were then compressed into 493 TVOPs1. These matrices were directly used into a non-selective pulse design1 consisting of 11 kT-points targeting a 60° FA (duty-cycle of 3.75%, TR=80 ms) with explicit constraints of: maximum temperature rise (0.4°C), maximum average power (1.9 W/channel) and peak voltage (160 V/channel). The FA homogenization of the pulse was first verified with the AFI sequence3. Second, MR thermometry4 was used to measure the temperature rise induced by the pulse sequence. For that purpose, a 3D-GRE sequence was applied (TE=28ms) to return a reference phase φ1 for each voxel. The kT-points pulse was then played in a 30 min-long gradient-free RF-heating sequence (TR = 80 ms), after which a second GRE sequence was implemented to return a locally-shifted phase φ2. Temperature rise was then computed using T(r)=(φ2 - φ1)/(αTE) with α being the electron-screening constant4. Field stability prior to heating was verified by repeating the GRE sequence 10 times which showed over 10 minutes a fluctuation of ~0.02 rad.Results
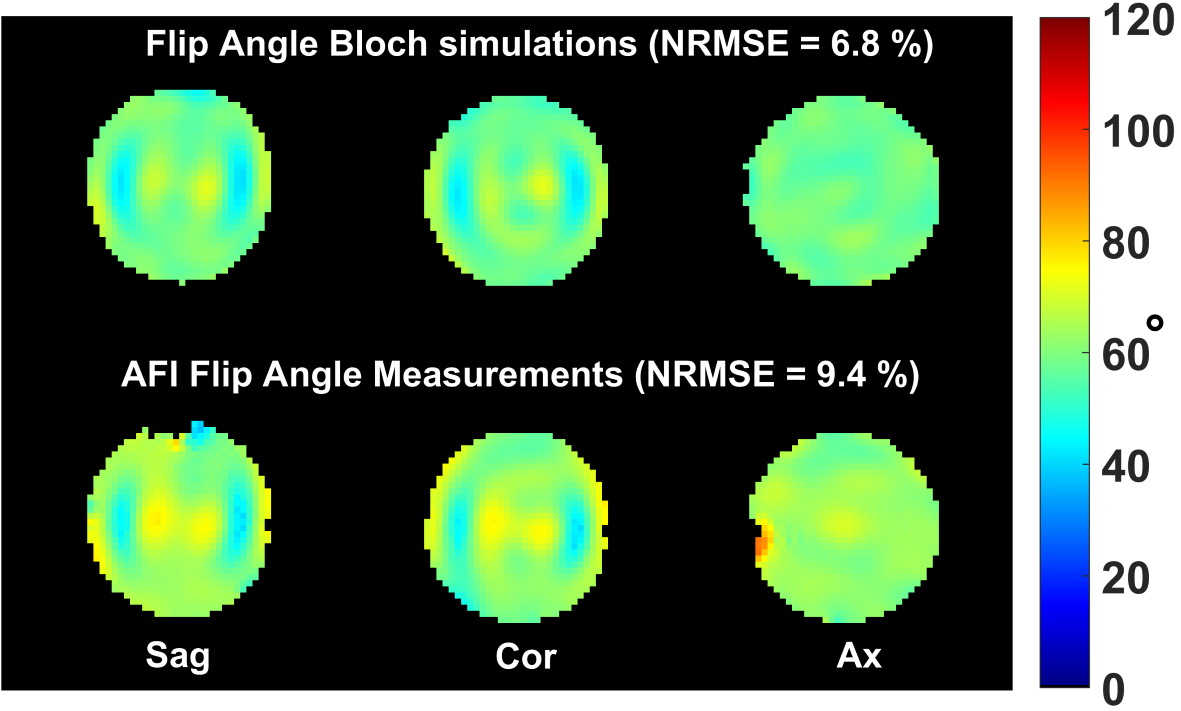
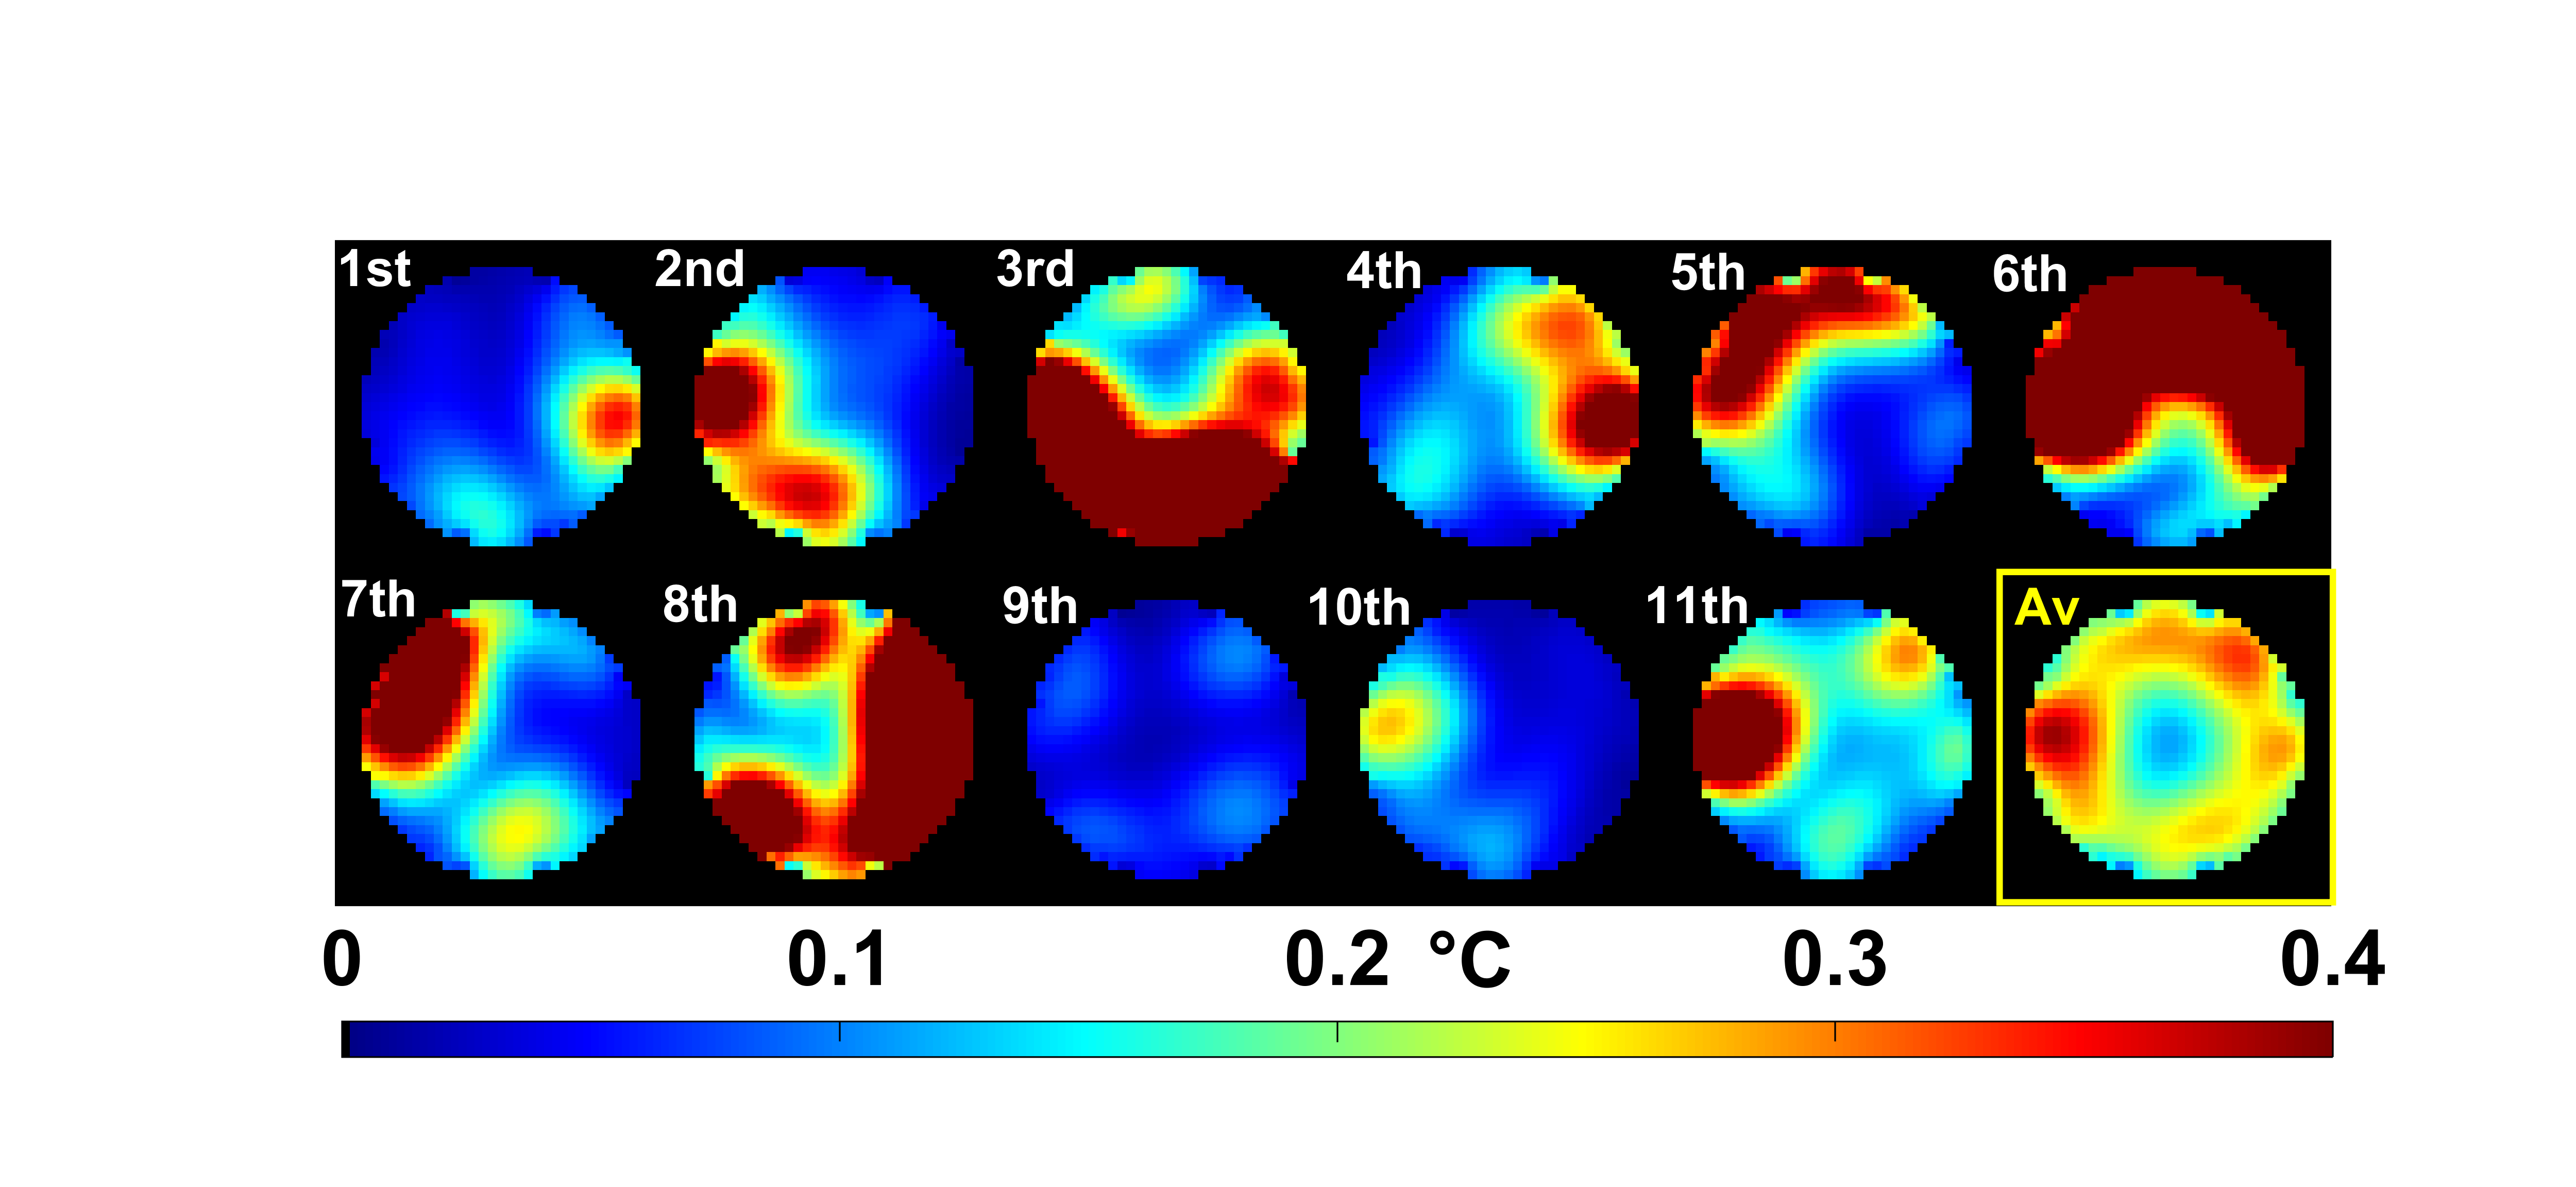
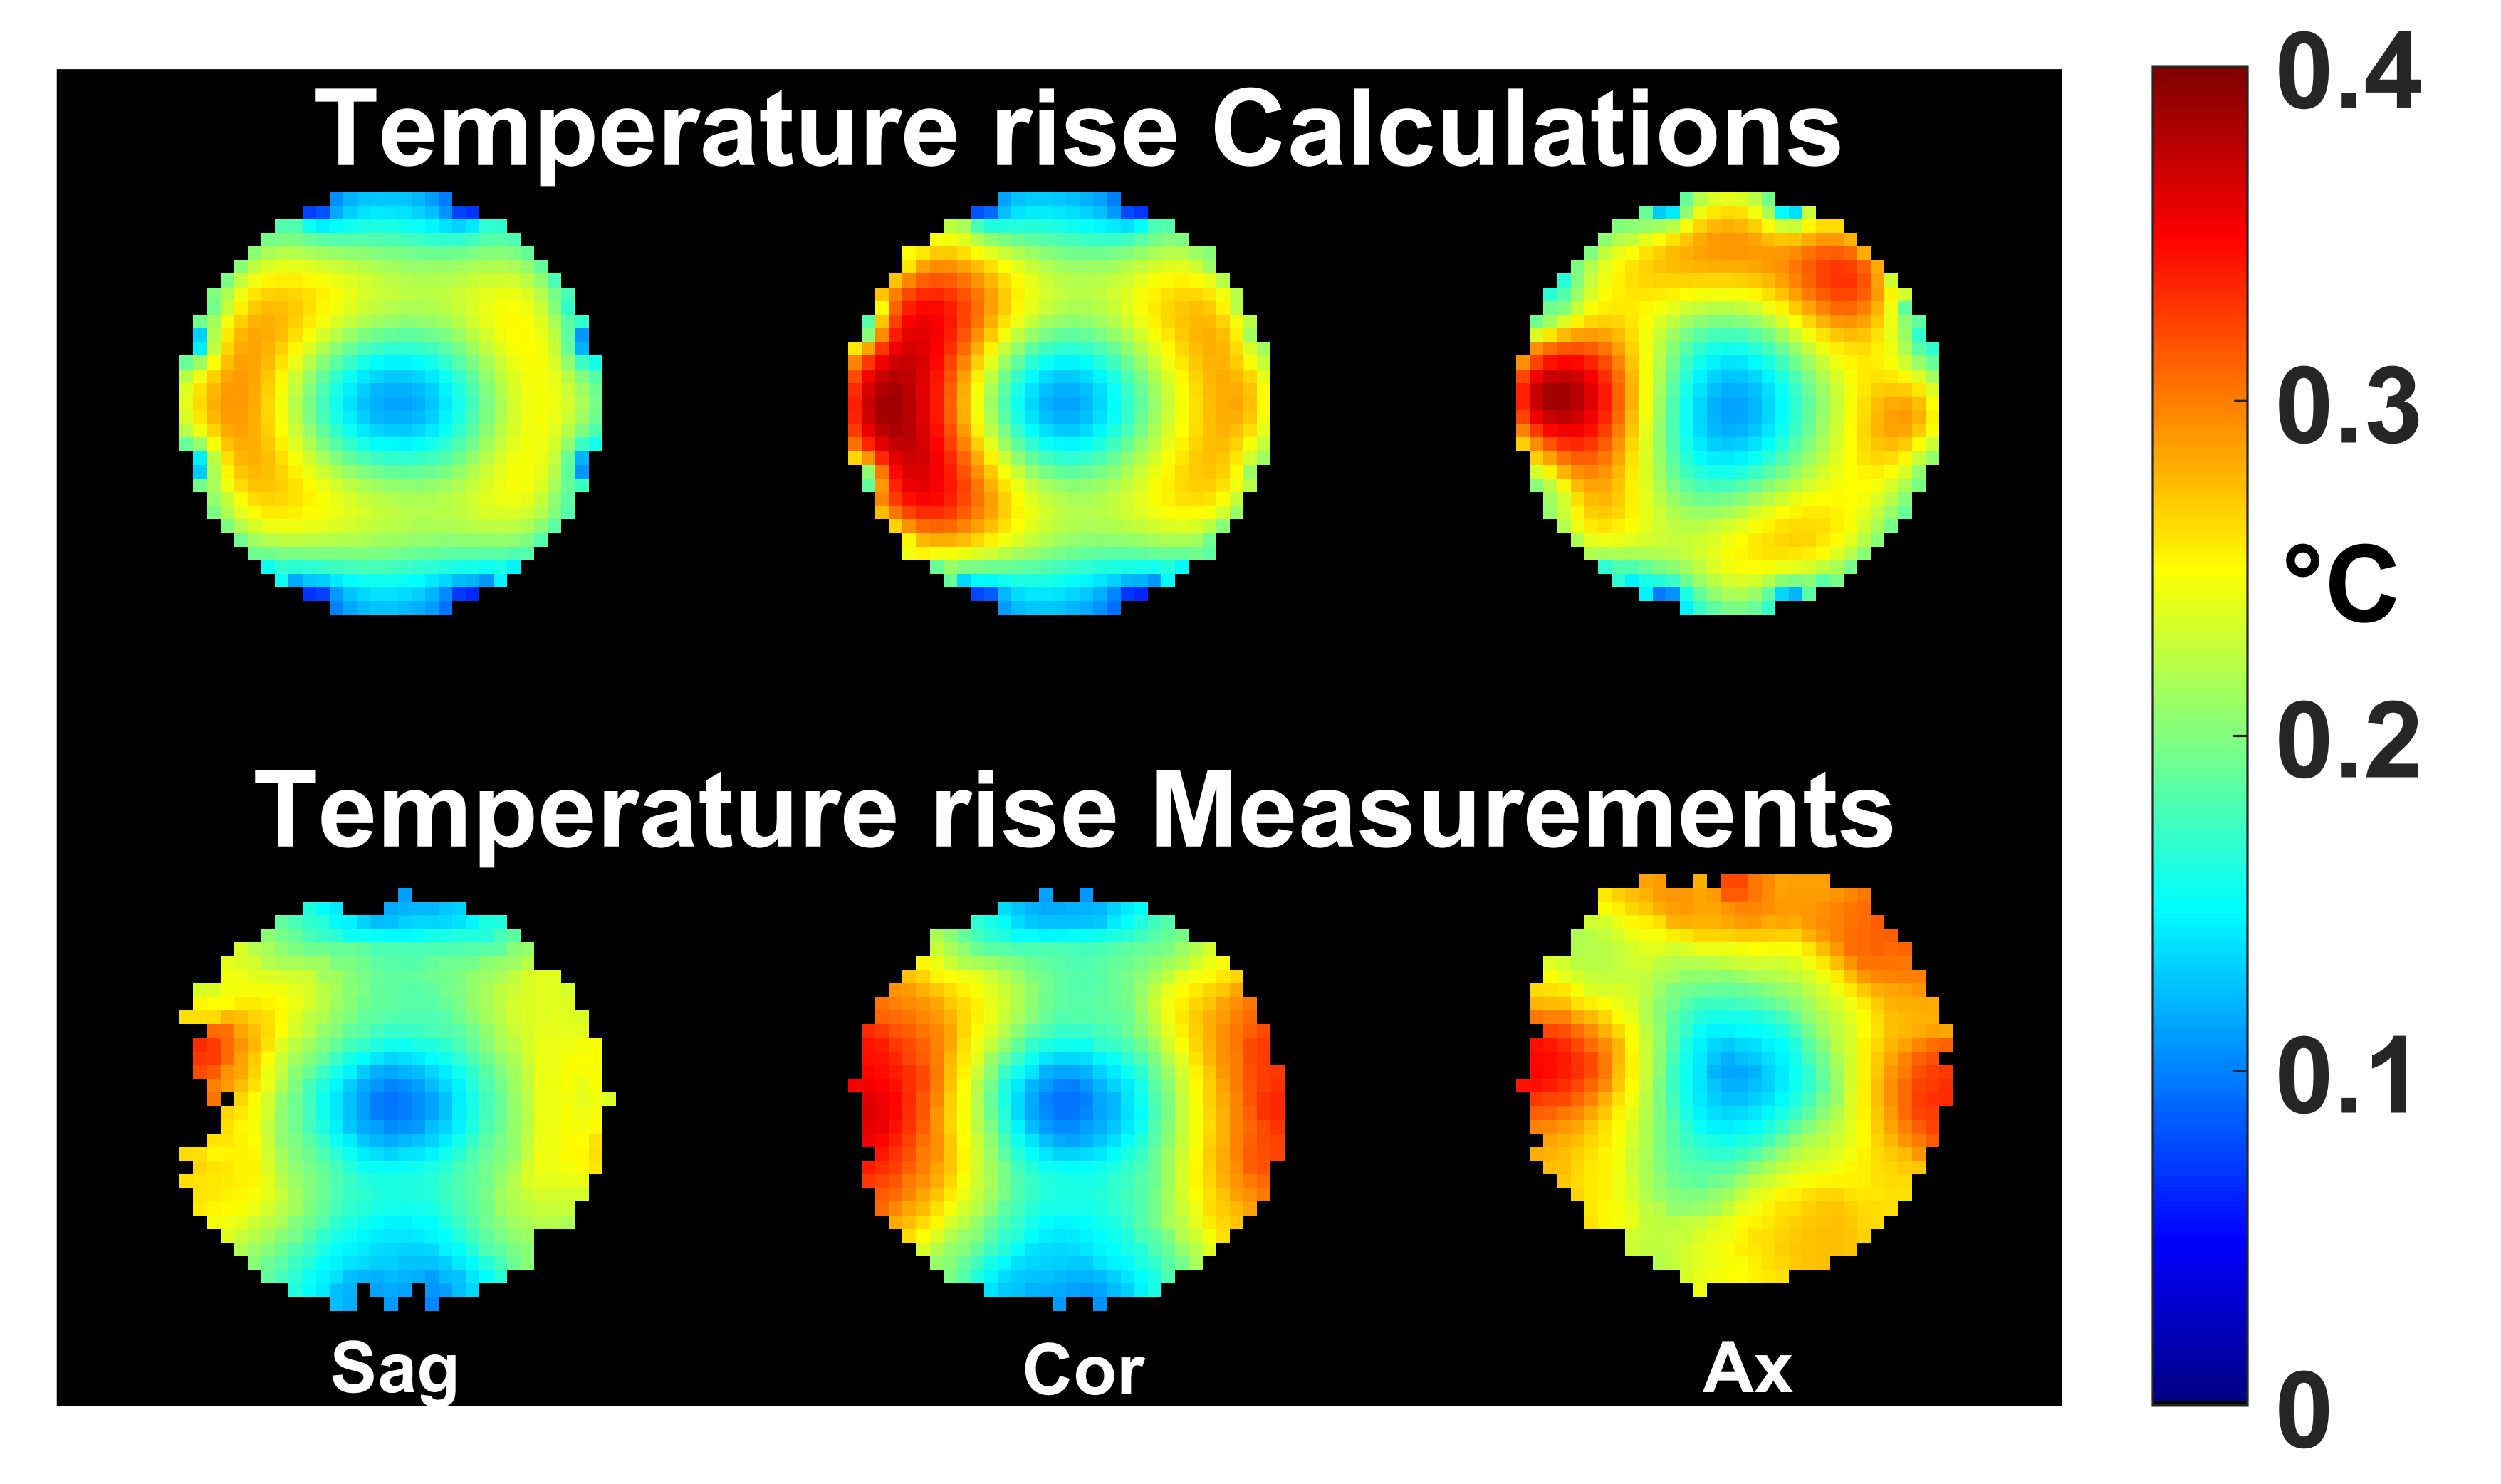
RF pulse design could be performed in about 10s and returned a pulse which saturated all constraints. In agreement with the simulations, the FA measurements provided in Fig.1 show good FA homogenization, although a slight offset most likely due to a B1 map or pulse implementation uncertainty appears. Fig. 2 reports the simulated temperature rise induced by each of the 11 kT-point sub-pulses separately (illustrating temporal averaging), the overall effect of the pulse being the average of the temperature rise maps across all sub-pulses (yellow-framed image). The latter is reproduced in Fig.3 over 3 orthogonal slices (top row) and compared with temperature rise measurements (bottom row). For this sequence duration, by simulation we found that heat diffusion had for effect to roughly halve the maximum temperature rise.Discussion and conclusion
This work reports the first in vitro demonstration of explicit temperature control in pulse design. The maximum temperature rise in the design here was set to 0.4 °C and could be verified experimentally (Fig. 3). A separate numerical optimization revealed that the maximum temperature rise obtainable with the same average power constraints was 0.97 °C but, interestingly, not more than 0.4 °C rise was necessary to achieve FA-homogenization optimality (perhaps due to temporal averaging). In this case it appeared that the most limiting constraint was the average power enforced for coil protection. Thus for this coil, given the long sequence duration and the lack of efficient cooling mechanism (perfusion) in the sample, it appears that significant tissue heating in normal in vivo conditions is unlikely. To conclude, given the very good agreement between temperature simulations and measurements, controlling temperature in vivo through the use of TVOPs appears to be within reach, although significant efforts in bioheat equation validations must be invested first.Acknowledgements
Acknowledgements: ERC EXPAT (grant number 309674).References
[1] N. Boulant, X. Wu, G. Adriany, S. Schmitter, K. Ugurbil, P-F. Van de Moortele. Direct control of the temperature rise in parallel transmission by means of temperature virtual observation points: Simulations at 10.5 tesla. Magn Reson in Med 75:249-256 (2016).
[2] A. Beqiri, J. W. Hand, J.V. Hajnal, S. Malik. Comparison between simulated decoupling regimes for specific absorption rate prediction in parallel transmit MRI. Magn Reson in Med 74:1423-1434 (2015).
[3] V. Yarnykh. Actual flip angle imaging in the pulsed steady state: a method for rapid three-dimensional mapping of the transmitted radiofrequency field. Magn Reson in Med 57:192-200 (2007).
[4] V. Rieke and K.Butts-Pauly. MR thermometry. J of Magn Reson Imag 27:376-390 (2008).
Figures