1129
Improving FLAIR SAR efficiency by predicting B1-maps at 7T from a standard localizer scan using deep convolutional neural networks1Centre for Advanced Imaging, The University of Queensland, Brisbane, Australia, 2Siemens Healthcare Pty Ltd., Brisbane, Australia
Synopsis
Ultra-high-field (7T) instrumentation offers the possibility of acquiring FLAIR images at an improved resolution when challenges such as efficient B1 calibration and SAR reductions can be realized. Instead of acquiring a separate B1-map, we propose to predict B1-maps based on the implicit B1 inhomogeneity field present in an AutoAlign localizer using deep convolutional neural networks. We show that a 34% reduction in SAR can be achieved by adjusting the power of FLAIR's adiabatic inversion pulse on a slice-by-slice basis using the B1 information without degradation of image quality.
Purpose
The fluid-attenuated inversion recovery
(FLAIR) method requires an adiabatic inversion pulse to suppress the cerebral
spinal fluid at the cost of significantly contributing to the specific
absorption rate (SAR) load of the sequence. Consequently, a fewer number of
slices, longer TR, reduced refocussing flip angles or a delay after the scan
are applied to reduce SAR. Without spatial B1 information, the adiabatic pulse
is empirically “overdriven” to ensure inversion; however, with a-priori knowledge of the 3D B1 field,
SAR could be reduced by adjusting the adiabatic pulse power on a slice-by-slice
basis. Acquisition of a B1-map requires additional scan time. We propose to
reduce the scan time by predicting the B1-map from the localizer data using
convolutional neural networks (CNNs). CNNs have already been used to learn an
end-to-end nonlinear mapping from MR images to CT image data1.
Others implemented image segmentations2,3
or trained a CNN to predict images with higher image resolutions4.
We note that the 3D localisers often used for planning are implicitly sensitive
to B1 inhomogeneity, therefore we hypothesise a CNN could be trained using a
database of AutoAlign 3D-localisers and acquired B1-maps to predict the B1-map.
The AutoAlign 3D-localisers would provide the positional information and the
B1-map required to adjust the adiabatic pulse power on a slice-by-slice basis,
with the outcome of acquiring FLAIR images with a reduced SAR load, no loss in
image quality, or increase in scan time. Methods
After approval by the local human ethics committee and written informed consent, 6 participants (2 males, 19-60 years of age) were scanned using a 7T whole-body research scanner (Siemens Healthcare, Erlangen, Germany) with a 32-channel head coil (Nova Medical, Wilmington, USA). The AutoAlign 3D localizer was acquired using a gradient echo sequence with the following parameters: TA=15.74s/TR=4ms/TE=1.53ms/α=16⁰/matrix=160x160x128/FOV=260x260x260mm3/GRAPPA=3. Individual B1-maps were acquired using the SA2RAGE sequence5 with the following parameters: TA=1min53s/TR=2.4s/TE=0.93ms/α=6⁰/TI1=108ms/TI2=1800ms/matrix=64x64x64/FOV=288x288x288mm3.
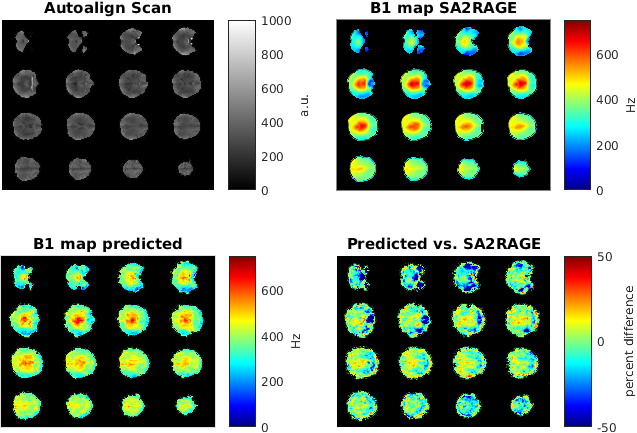
A CNN (MatConvNet, http://www.vlfeat.org/matconvnet/) implemented in Matlab 2016a (Mathworks) was trained on an NVIDIA Tesla K40c card. The network consisted of 3 convolutional layers followed by rectified linear unit layers and a final prediction layer. The network was trained on 1000 64x64 patches randomly extracted from the localizer and B1-map data, which were masked using BET6 to exclude non-brain tissue (Figure 1). 200 epochs were trained with a learning rate of 0.02, a batch size of 16 and 20 percent validation data in 2 hours.
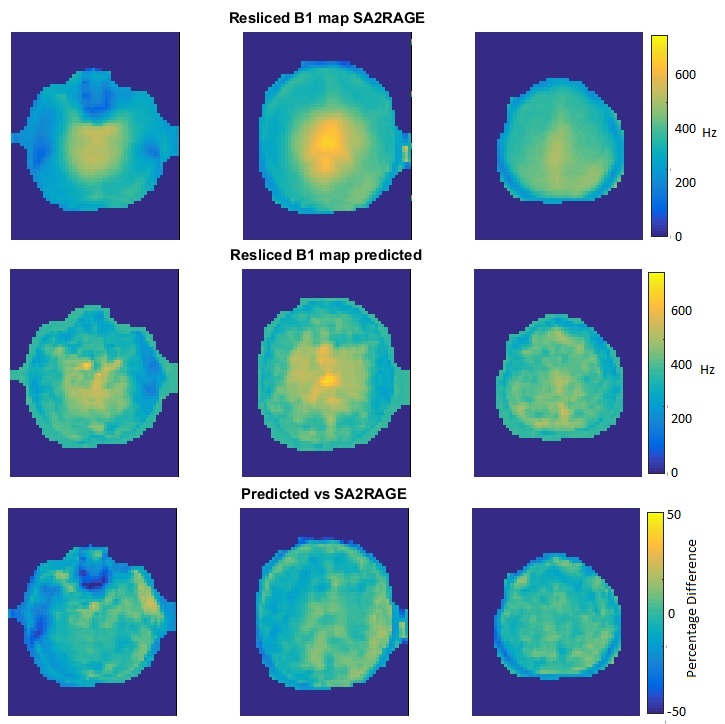
The AutoAlign algorithm was used to plan and acquire standard whole-brain FLAIR images with the following image parameters: TA=3min18s, TR=9s, TE=100ms, TI=2.6s, α=150⁰, ETL=9, slices=40, thickness=3mm, matrix=320x256, FOV=223x179mm2, GRAPPA=3. The positioning information from the algorithm was used to re-slice the predicted and acquired B1-maps. A slice-by-slice scale factor, calculated from the lower bound of 95% confidence interval about the mean, ensured inversion across the whole slice. Subsequently, predicted scale factors were applied to FLAIR acquisitions. Percentage SAR and time delays from the spectrometer’s SAR look-ahead monitor was recorded for each scan.
To test the accuracy of the predicted B1 map, an AutoAlign 3D localizer data set was used to predict a B1-map and compare it to a measured SA2RAGE B1 map (Figure 2).
Results & Discussion
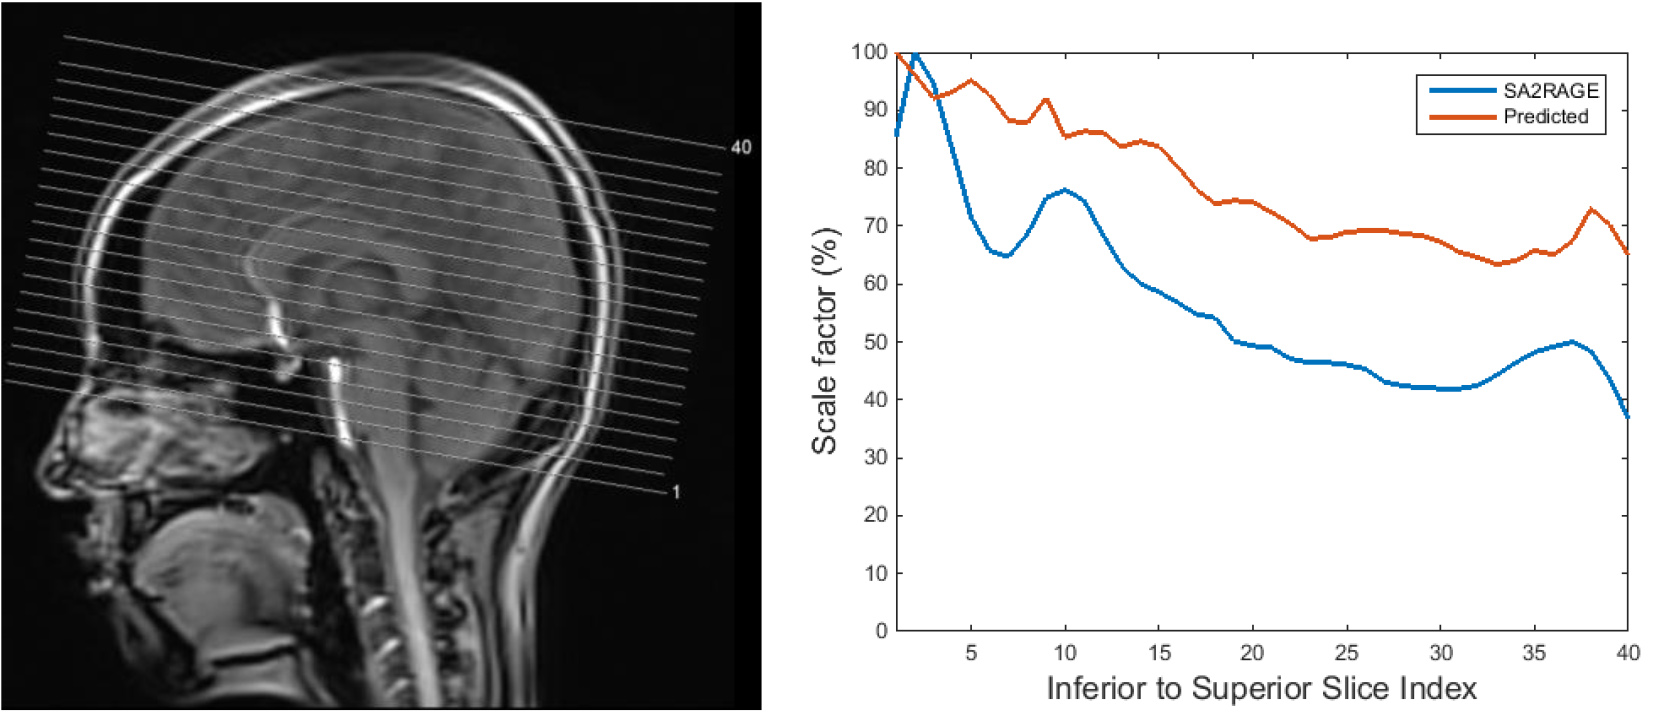
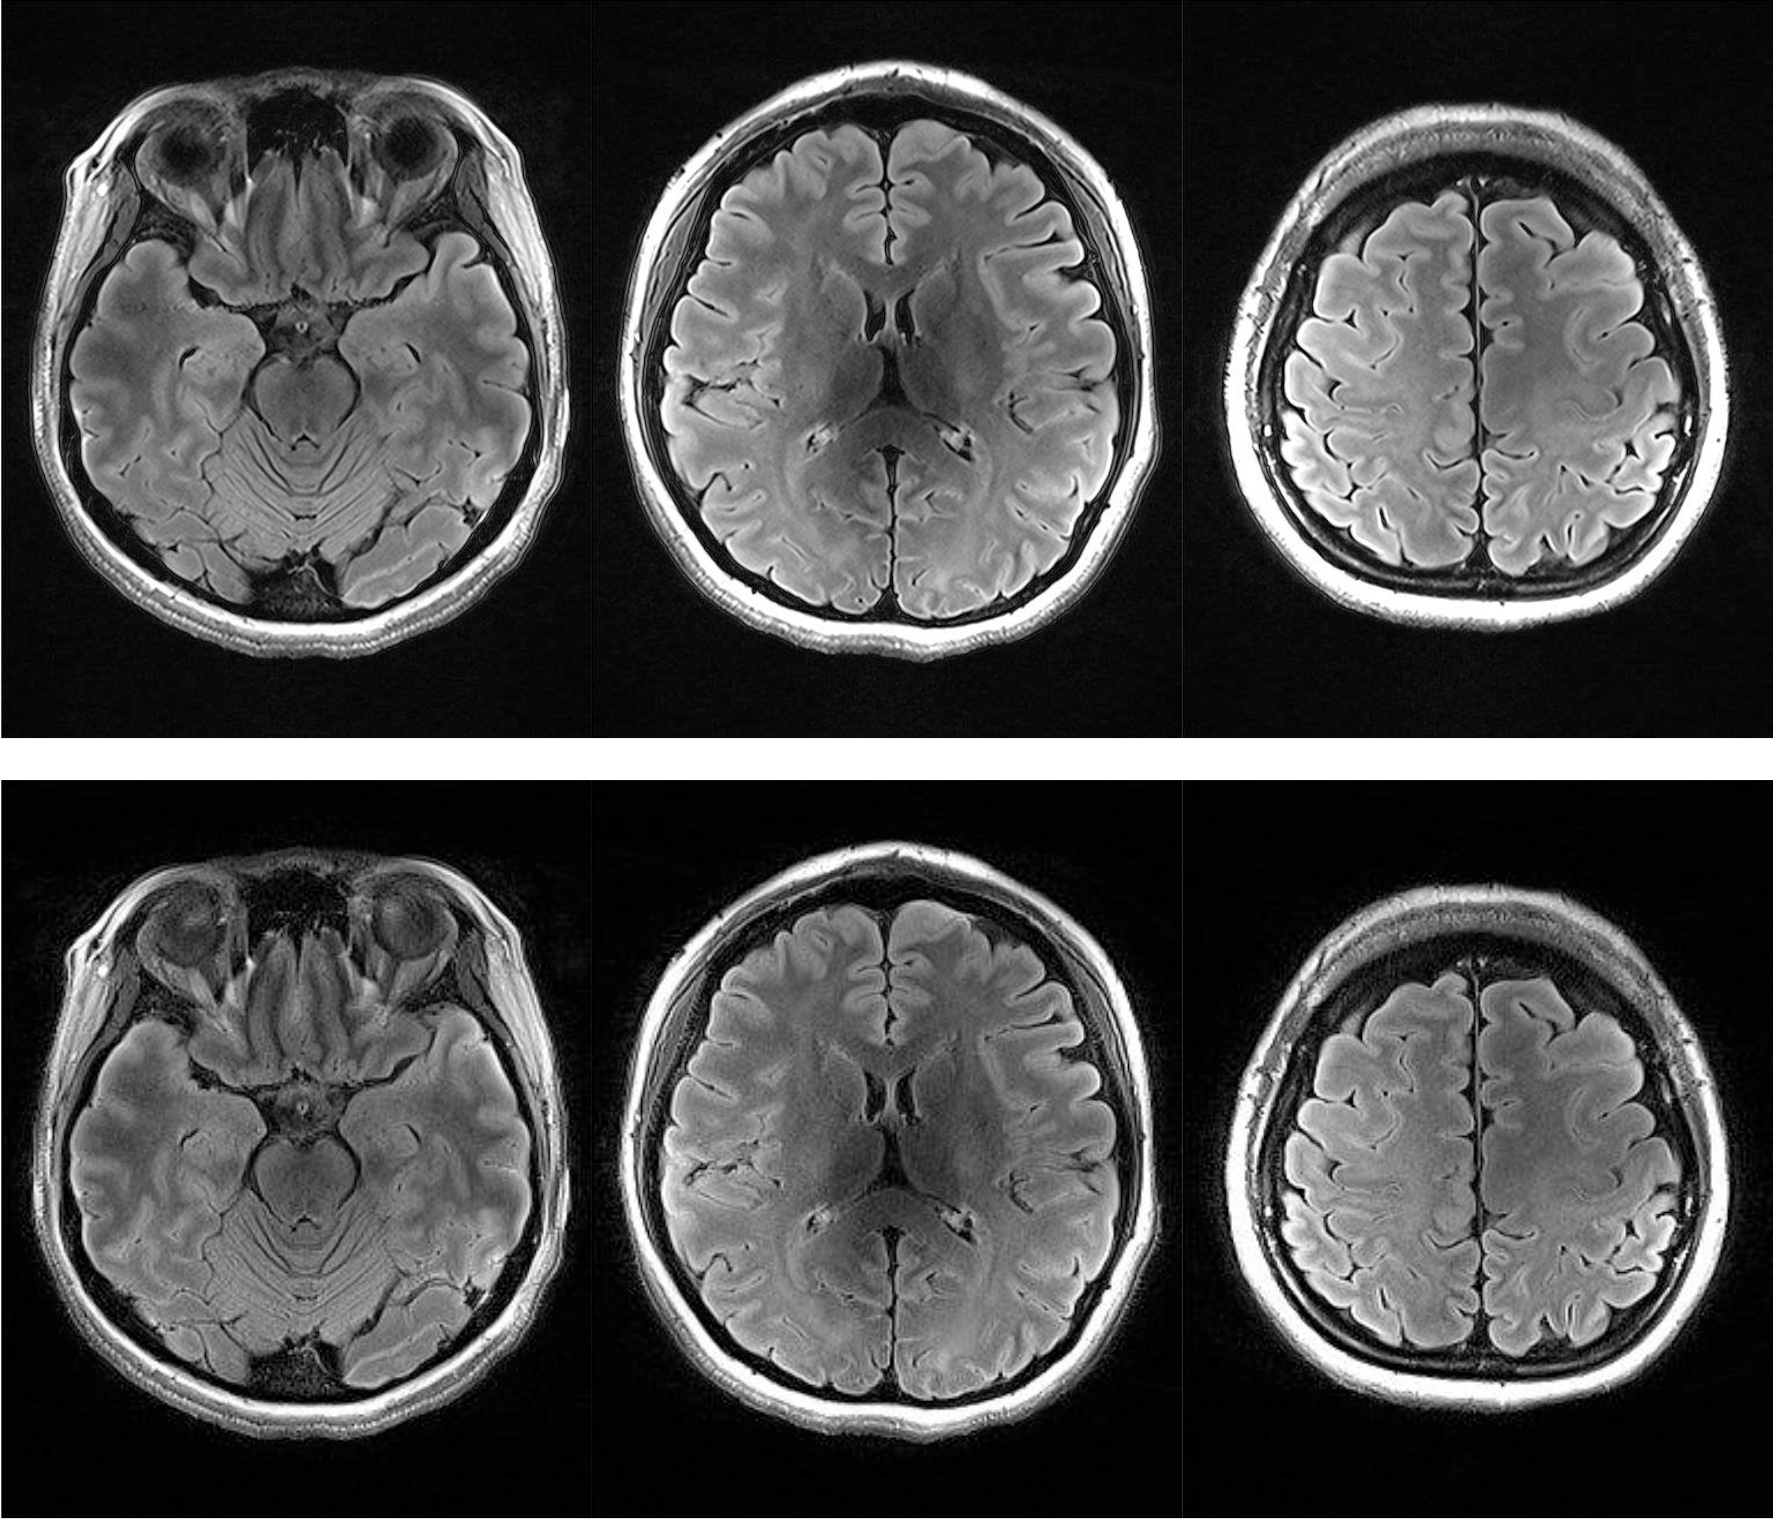
The predicted B1-map matched the subject B1-map with a mean difference across the slices of 5.9% (std 12.2%) and over-predicts values in certain regions. Likewise, with slice position (from inferior to superior), the scale factor decreases, resulting in conservative estimates of the scale factors when comparing predicted and acquired maps (Figure 3). Importantly, Figure 4 highlights that the CSF suppression and image quality in general are unaffected by the factor applied in a slice-by-slice scale manner. The standard acquisition has an SAR level of 135% requiring a 69-second delay whereas the slice-by-slice adjustment reduced the SAR to 89% without a need for a delay and therefore shortening the acquisition time.Conclusions
Our results suggest that CNNs can be used to predict B1-maps from the AutoAlign 3D localizer for the purpose of attenuating the peak amplitude of adiabatic inversion pulses in a slice-by-slice manner. The effect of scaling adiabatic pulse amplitudes in this manner, results in significant reductions in SAR without compromising image quality.Acknowledgements
The authors acknowledge the facilities of the National Imaging Facility at the Centre for Advanced Imaging, University of Queensland. SB acknowledges funding from UQ Postdoctoral Research Fellowship grant and support via an NVIDIA hardware grant. MB acknowledges funding from ARC Future Fellowship grant FT140100865, VV from NHMRC project grant APP1104933.References
1. Nie, D., Cao, X., Gao, Y., Wang, L. & Shen, D. in Deep Learning and Data Labeling for Medical Applications (eds. Carneiro, G. et al.) 170–178 (Springer International Publishing, 2016). doi:10.1007/978-3-319-46976-8_18
2. Choi, H. & Jin, K. H. Fast and robust segmentation of the striatum using deep convolutional neural networks. J. Neurosci. Methods 274, 146–153 (2016).
3. Nie, D., Wang, L., Gao, Y. & Shen, D. FULLY CONVOLUTIONAL NETWORKS FOR MULTI-MODALITY ISOINTENSE INFANT BRAIN IMAGE SEGMENTATION. Proc. IEEE Int. Symp. Biomed. Imaging Nano Macro IEEE Int. Symp. Biomed. Imaging 2016, 1342–1345 (2016).
4. Bahrami, K., Shi, F., Rekik, I. & Shen, D. in Deep Learning and Data Labeling for Medical Applications (eds. Carneiro, G. et al.) 39–47 (Springer International Publishing, 2016). doi:10.1007/978-3-319-46976-8_5
5. Eggenschwiler, F., Kober, T., Magill, A. W., Gruetter, R. & Marques, J. P. SA2RAGE: A new sequence for fast B1+-mapping. Magn. Reson. Med. 67, 1609–1619 (2012).
6. Smith, S. M. Fast robust automated brain extraction. Hum. Brain Mapp. 17, 143–155 (2002).
Figures