1126
EEG microstate and spectral signatures of epileptic patterns found in fMRI dynamic functional connectivity1ISR-Lisboa/LARSyS and Department of Bioengineering, Instituto Superior Técnico, Lisboa, Portugal, 2Department of Neurophysiology, Centro Hospitalar Psiquiátrico de Lisboa, Lisboa, Portugal
Synopsis
We aimed to investigate EEG signatures specifically associated with epileptic patterns of dynamic functional connectivity (dFC) found in BOLD-fMRI data. We estimated dFC using a sliding-window correlation analysis and applied dictionary learning (DL) to identify the most prominent patterns while forcing a certain degree of sparsity in time. Upon the labelling of each time window based on the pattern exhibiting the highest contribution, we investigated pattern-specific microstates (MS) and spectral proprieties in simultaneously recorded EEG data. In contrast with the spectral proprieties, EEG MS revealed robust signatures of epileptic dFC patterns in all patients.
Introduction
Epilepsy has been recently studied with BOLD-fMRI dynamic functional connectivity (dFC) because it is characterized by a continuous interchange between epileptic and normal states related with the spontaneous occurrence of epileptic activity1. However, whether there are electrophysiological signatures underlying epileptic dFC patterns is yet to be clarified2. Here, we aimed to investigate EEG microstate (MS) and spectral signatures of the most prominent dFC patterns identified in fMRI data in simultaneous EEG-fMRI recordings from epilepsy patients.Methods
Data acquisition and pre-processing: Five epilepsy patients were studied on a 3T MRI system using an MR-compatible 32-channel EEG system. BOLD-fMRI data were obtained using 2D-EPI (TR/TE=2500/50 ms) concurrently with EEG, and subjected to advanced pre-processing steps3. EEG data were MR-induced artefact corrected and band-pass filtered (1-45 Hz). A representative time-course of epileptic activity was extracted from the EEG based on the following steps4: 1) visual inspection for inter-ictal epileptiform discharges (IEDs); 2) identification of a channel of interest (ChOI) yielding the highest IED-triggered EEG amplitude; 3) extraction of the phase synchronization index (PSI) between ChOI and the channel for which PSI exhibited the highest variance when averaged across an IED-focused band (3–10 Hz); and 4) convolution with the canonical haemodynamic response function.
dFC estimation: Brain parcellation was performed using the automated anatomical labelling (AAL) atlas5, and the BOLD signal was averaged within each parcel. dFC was estimated by a sliding-window approach6 (window length=37.5 s, step=5 s), whereby the pair-wise Pearson correlation coefficient is computed across all parcel-averaged BOLD signals for each sliding window. The final dFC matrix comprised only the non-redundant entries of the correlation matrices.
Identification of epileptic patterns: An l1-norm regularized dictionary learning (DL) estimation procedure7 was applied to identify the most prominent patterns in the dFC matrix, while forcing a certain degree of sparsity in time. In order to identify the epileptic patterns, non-sparse weight time-courses were computed by correlating each pattern’s correlation matrix with that of each time window; patterns exhibiting significant correlations (p<0.05) with EEG-PSI were deemed epilepsy-related. The number of patterns and the regularization parameter in DL were identified by searching for those that maximized the correlation between the epileptic pattern’s weight time-courses and EEG-PSI. Statistically meaningful patterns were identified by comparing their individual reconstruction error of the original dFC matrix against a null distribution generated from phase-randomized surrogate data.
EEG signatures: EEG MS and power spectra were extracted from windows with the same properties as for dFC estimation. The minimal number of MSs that explained at least 80% of the EEG variance was considered. Time windows were labelled according to the pattern exhibiting the highest contribution, and MSs and power spectra assigned to the same pattern were averaged, representing the pattern-specific EEG signatures.
Results
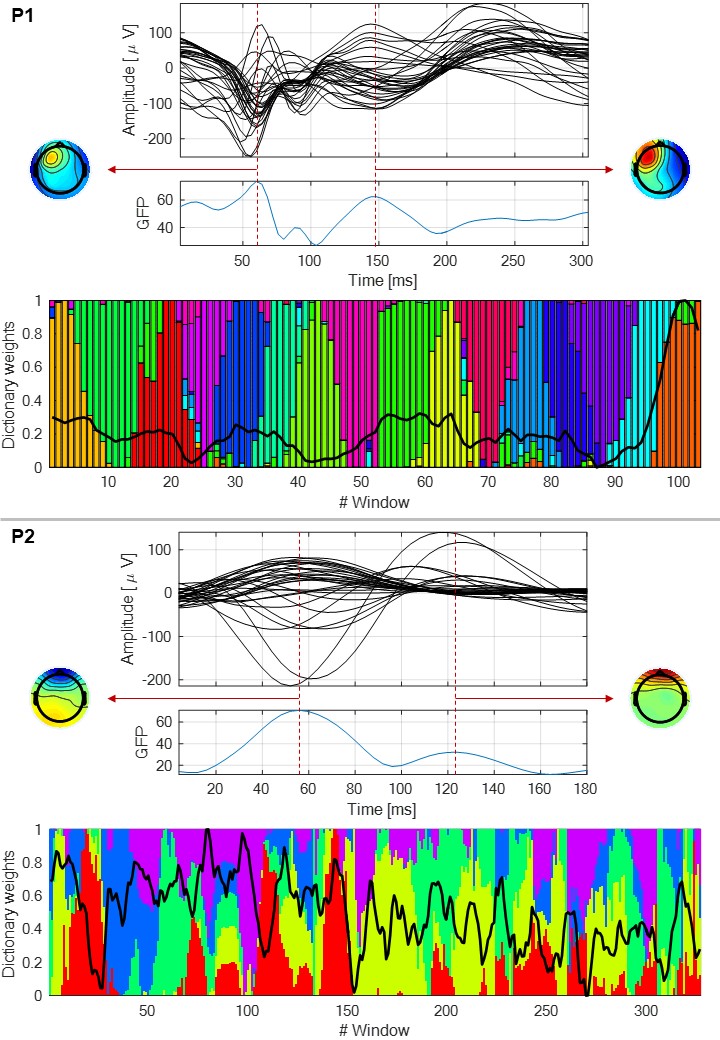
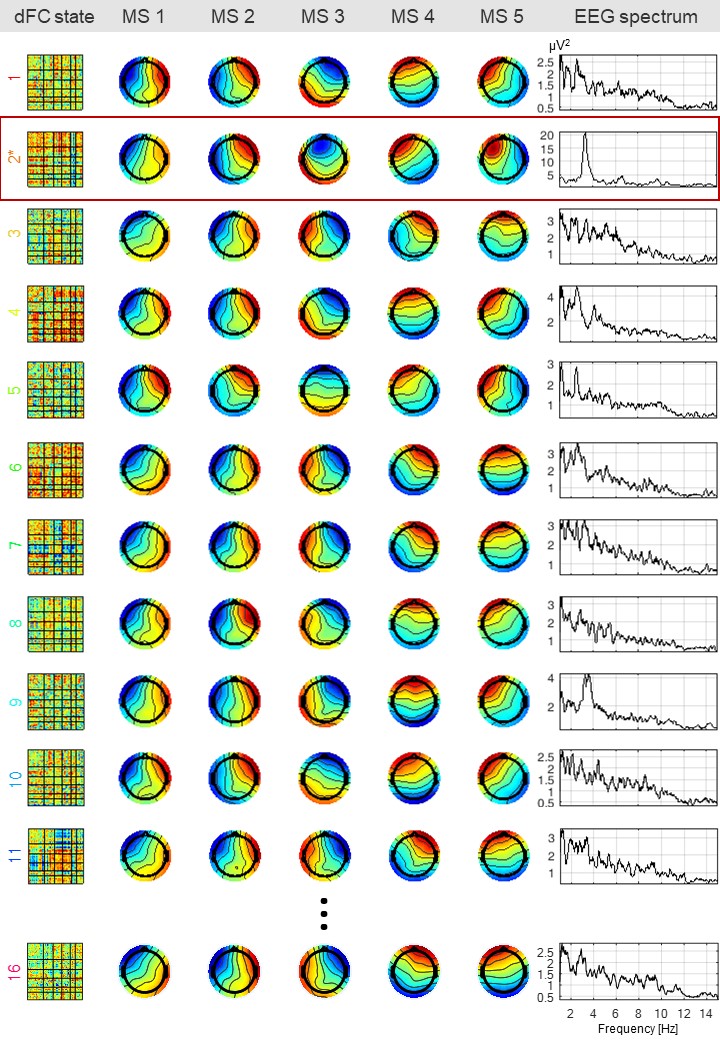
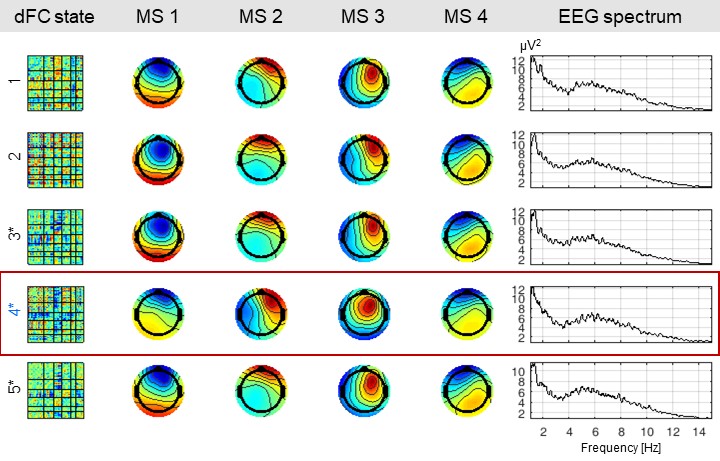
The results are shown for two illustrative patients: P1, with IEDs over the posterior right quadrant; and P2, with IEDs over the left posterior occipital-temporal lobe, both with apparent frontal propagation. Fig. 1 shows the average IED, the respective global field power (GFP) and the topographies at the two highest GFP values (representative of the IEDs’ spatial distributions), for both patients. Also, a bar plot depicting the contribution of the dFC patterns (normalized between 0 and 1) over time, superimposed with EEG-PSI, is shown. Fig. 2 illustrates 12/16 dFC patterns (color-coded according to Fig. 1; black labels denote statistically non-significant patterns) estimated for P1, and the respective five MSs and power spectra. Only pattern #2 was deemed epilepsy-related (red rectangle); while MSs 1, 2 and 4 are present in most patterns, MSs 3 and 5 are specific of pattern #2; also, the respective power spectrum shows a strong peak at ~3 Hz, characteristic of the patient’s IEDs. Fig. 3 depicts the same as in Fig. 2 but for patient P2. Although patterns #3, #4 and #5 were deemed epilepsy-related, only pattern #4 survived statistical significance. Although MS 4 is present in all patterns, MS 3 varies substantially across patterns and MS 2 is exclusive to pattern #4. No differences were observed when analyzing the power spectra. In general, MSs exclusive to epileptic patterns were found to be similar to the EEG topographies at the IED-GFP peaks; also, MSs were more consistent EEG signatures of dFC patterns than spectral properties.Conclusion
We showed that: 1) epileptic dFC patterns found in fMRI data are strongly associated with epilepsy-related EEG microstates, supporting the electrophysiological underpinnings of dFC patterns in agreement with a previous study2. Furthermore, 2) dFC analyses are sensitive to epileptic activity, as evidenced by the specific EEG signatures, in particular microstates, associated with epileptic patterns.Acknowledgements
We acknowledge the Portuguese Science Foundation (FCT) for financial support through Project PTDC/SAUENB/112294/2009, Project PTDC/EEIELC/3246/2012, Grant UID/EEA/50009/2013 and the Doctoral Grant PD/BD/105777/2014.References
1. Preti, MG et al. Epileptic network activity revealed by dynamic functional connectivity in simultaneous EEG-fMRI. 2014 IEEE 11th International Symposium on Biomedical Imaging (ISBI). IEEE, 2014.
2. Allen, EA et al. EEG signatures of dynamic functional network connectivity states. Brain Topography. 2017; 1-16.
3. Abreu, R et al. Physiological noise correction using ECG-derived respiratory signals for enhanced mapping of spontaneous neuronal activity with simultaneous EEG-fMRI. NeuroImage. 2016.
4. Abreu, R et al. EEG synchronization measures predict epilepsy-related BOLD-fMRI fluctuations better than commonly used univariate metrics. 2016 33rd European Society of Magnetic Resonance in Medicine and Biology (ESMRMB). ESMRMB, 2016.
5. Tzourio-Mazoyer, N et al. Automated anatomical labelling of activations in SPM using a macroscopic anatomical parcellation of the MNI MRI single-subject brain. NeuroImage. 2002; 15:273-289.
6. Hutchison, RM et al. Dynamic functional connectivity: promise, issues, and interpretations. NeuroImage. 2013; 80: 360–378.
7. Mairal, J et al. Online learning for matrix factorization and sparse coding. J Mach Learn Res. 2010; 11:19–60
Figures