1125
Efficacy of different dynamic functional connectivity methods to capture cognitively relevant information1Department of Electrical & Computer Engineering, Texas Tech University, Lubbock, TX, United States, 2Section on Functional Imaging Methods, Laboratory of Brain and Cognition, National Institute of Mental Health, National Institutes of Health, Bethesda, MD, United States, 3FMRI Core, National Institute of Mental Health, National Institutes of Health, Bethesda, MD, United States
Synopsis
With a multitask dataset (rest, memory, video, and math) serving as ground truth, we evaluated the efficacy of four different methods of estimating dynamic functional connectivity (dFC)—namely sliding window correlation (SWC), sliding window correlation with L1-regularization (SWC_L1), dynamic conditional correlation (DCC), and multiplication of temporal derivatives (MTD)—to capture cognitively relevant information. We used dFC estimates of each method as inputs for k-means, and evaluated how well they segregate scan periods for different tasks. We found that moving average DCC produces best results, especially for short window length (WL ≤ 9sec), suggesting DCC may more reliably reveal dFC linked to mental states.
Purpose
To evaluate the ability of different dynamic connectivity methods to parcellate multitask scans as a function of the task being performed. We use this as a proxy to evaluate how well dynamic FC snapshots in terms of short-term whole-brain FC patterns (Allen et al., 2014) correspond to different mental states, as defined by task (Gonzalez-Castillo et al., 2015).Methods
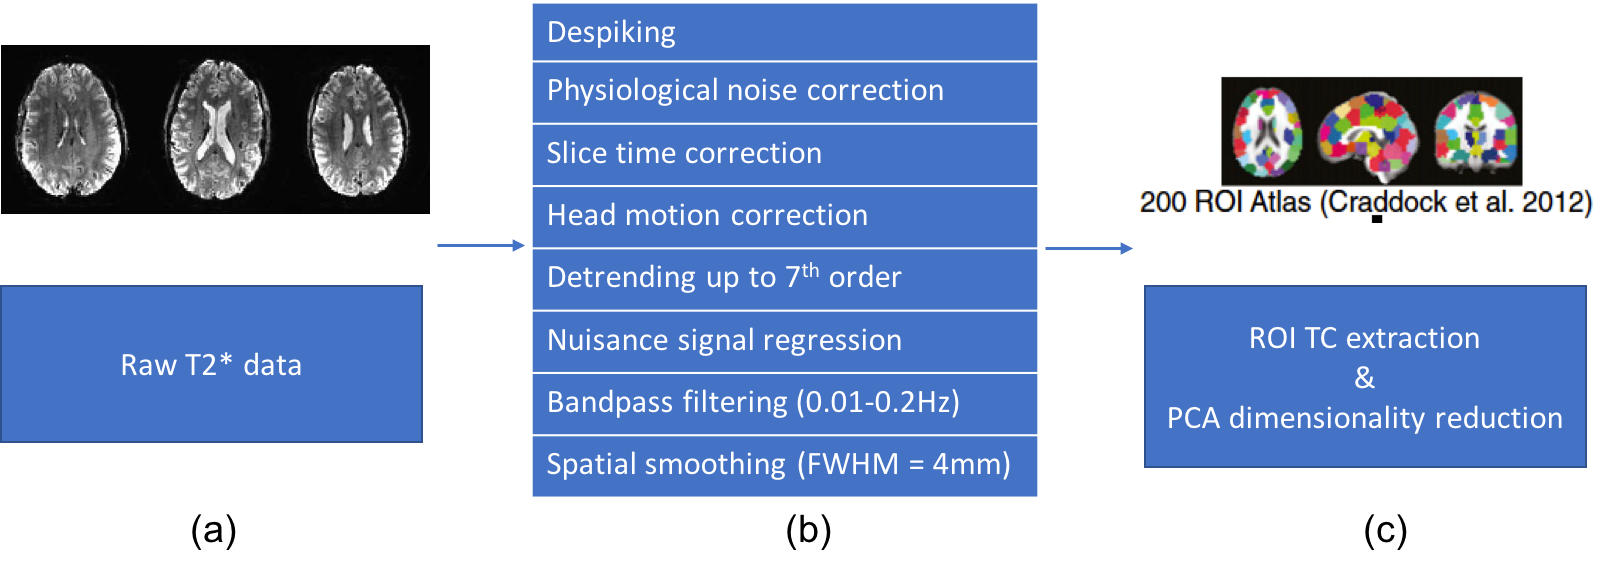
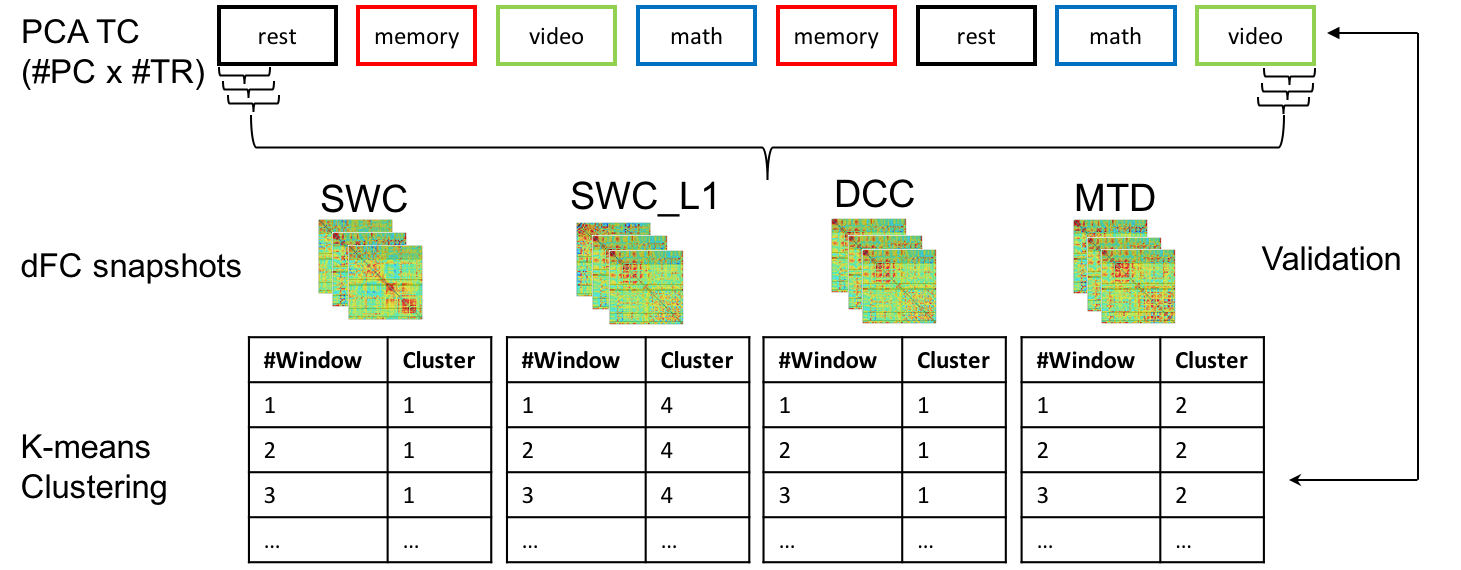
Many methods have been introduced to probe whole-bran dynamic functional connectivity, however, few studies have compared them; partially due to lack of ground truth regarding the timing of ongoing cognition. Here, we used a multitask dataset originally published in Gonzalez-Castillo et al. (2015) to serve as the ground truth for evaluating the ability of four different dFC methods to capture cognitively meaningful transitions in mental states. Following the preprocessing pipeline in Figure 1, with the known timing of ground-truth mental state as defined by the external task (rest, simple math, a two-back memory task and visual attention task; Figure 2), we compared the efficacy of four dFC methods: sliding window correlation (SWC), sliding window correlation with L1-regularization (SWC_L1), dynamic conditional correlation (DCC), and multiplication of temporal derivatives (MTD). More specifically, we first computed dFC snapshots (defined here as windowed/time-resolved whole-brain connectivity pattern) using non-overlapping windows of five different durations (WL = 45, 30, 15, 9, 6sec). dFC snapshots were then input to k-means algorithm (k=4, max_iterations=10000, replicates=100, distance: Pearson's correlation). Finally, we compared the resulted clustering accuracy, i.e. correspondence between the k-means partitions (FC states) and ground-truth task structure, in terms of Adjusted Rand Index3 (ARI).
SWC: dFC snapshots are computed as the correlation matrices of the windowed TC, segmented by a Gaussian taper sliding window with σ = 3TR1. An adaptive bandpass filter (lower cutoff = 1/WL) is applied on the window TC to remove spurious fluctuation, which is also incorporated for SWC_L1.
SWC_L1: a penalty on the L1 norm is placed on the inverse windowed covariance matrix to promote sparsity following the graphical LASSO method5.
DCC: A generalized autoregressive conditional heteroskedasticity (GARCH) model is fitted using the whole timecourses, and the standardized residuals are used to estimate the frame-wise dynamic correlations6, which is then smoothed by simple moving average to compare against window-based approach.
MTD: dFC snapshots are computed as the moving averaged dot products of the two first-order derivatives of the timecourses7.
Results
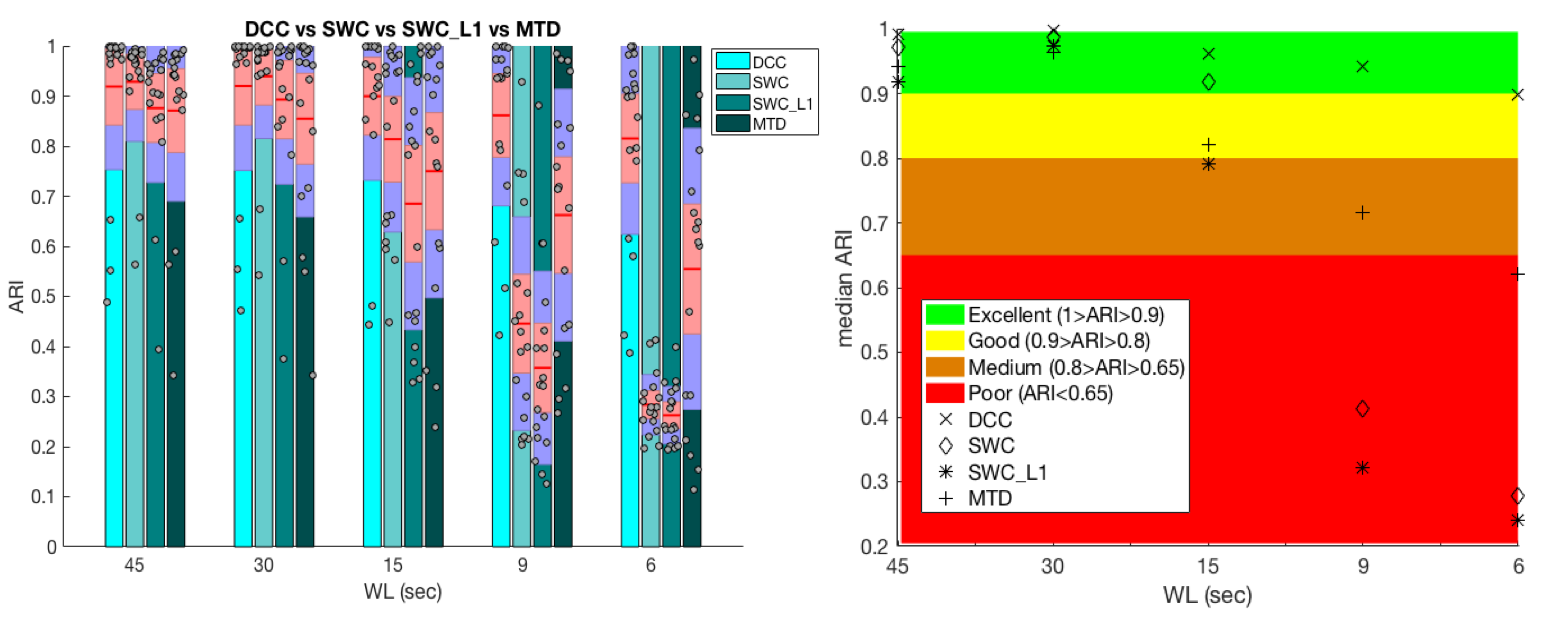
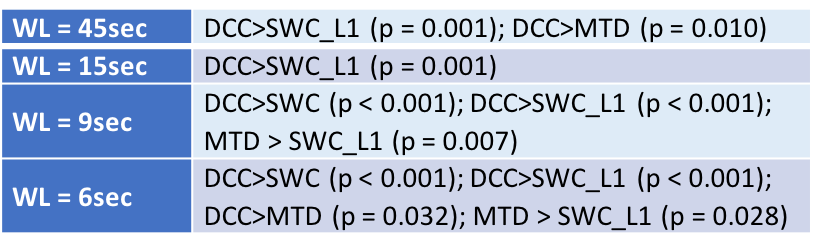
The individual’s ARI is shown in Figure 3. We can see the overall accuracy dropped as the WL shortened, while the ARI of moving average DCC remained high. We then performed non-parametric Kruskal–Wallis ANOVA test to test for unequal medians, and after correcting for multiple comparison, the groups with significantly different medians are reported in Table 1. The test results showed that moving average DCC significantly outperformed the rest of the methods using WL = 6sec and significantly outperformed SWC and SWC_L1 for WL = 9sec.Discussion/Conclusions
In this study, we aim to evaluate the efficacy of four dFC approaches of capturing cognitively relevant information, i.e. how well the FC states output by k-means clustering truly reflect the underlying task structure. Our evaluations suggest there is no obvious group difference in terms of median ARI for WL = 30 secs across all 4 evaluated methods. As the WL shortens, the accuracy of DCC remained the highest, suggesting DCC may be the most appropriate selection for exploration of the shortest window lengths. For the shortest WL, we also observed that MTD outperformed the two variants of SWC. SWC performed well using medium to long window length (WL ≥ 15 secs), but the performance dropped significantly using short window length. Finally, we also observed that L1 regularization did not increase the performance of SWC. Our results suggest that when aiming at capturing mental states via short-term whole-brain FC patterns, windowed average DCC seems to be the best choice among the methods evaluated here.
The exact reason of moving average DCC outperforming other dFC methods still needs to be understood. Based on our initial assessment, we suspect that similar to how autoregressive moving average model (ARMA) is adopted in conventional activation-based analysis to account for the autocorrelation in the signal8, the GARCH(1,1) model used by DCC assumes the error variance follows an ARMA process, which may allow for better estimation of dynamic correlation upon removal of dFC changes induced by random noise.
Acknowledgements
This research was possible thanks to the support of the National Institute of Mental Health Intramural Research Program (NIH clinical protocol number NCT00001360, protocol ID 93-M-0170, annual report ZIAMH002783-16). Portions of this study used the high-performance computational capabilities of the HPC Biowulf Cluster at the National Institutes of Health, Bethesda, MD (http://hpc.nih.gov).References
[1] Allen, Elena A., et al. "Tracking whole-brain connectivity dynamics in the resting state." Cerebral cortex 24.3 (2014): 663-676.
[2] Gonzalez-Castillo, Javier, et al. "Tracking ongoing cognition in individuals using brief, whole-brain functional connectivity patterns." Proceedings of the National Academy of Sciences 112.28 (2015): 8762-8767.
[3] Hubert L, Arabie P (1985) Comparing partitions. J Classif 2(1):193–218.
[4] Craddock, R. Cameron, et al. "A whole brain fMRI atlas generated via spatially constrained spectral clustering." Human brain mapping 33.8 (2012): 1914-1928.
[5] Friedman, Jerome, Trevor Hastie, and Robert Tibshirani. "Sparse inverse covariance estimation with the graphical lasso." Biostatistics 9.3 (2008): 432-441.
[6] Lindquist, Martin A., et al. "Evaluating dynamic bivariate correlations in resting-state fMRI: a comparison study and a new approach." NeuroImage 101 (2014): 531-546.
[7] Shine, James M., et al. "Estimation of dynamic functional connectivity using Multiplication of Temporal Derivatives." NeuroImage 122 (2015): 399-407.
[8] Chen, Gang, et al. "Linear mixed-effects modeling approach to FMRI group analysis." NeuroImage 73 (2013): 176-190.
Figures