1124
Quantitative deconvolution of neuronal-related BOLD events with Multi-Echo Sparse Free Paradigm Mapping1Section on Functional Imaging Methods, National Institute of Mental Health, Bethesda, MD, United States, 2Basque Center on Cognition, Brain and Language, San Sebastian, Spain, 3FMRI Core, National Institute of Mental Health, Bethesda, MD, United States
Synopsis
This work proposes a novel formulation of the Sparse Free Paradigm Mapping (SPFM) algorithm for Multi-Echo (ME) fMRI that produces estimates of ΔR2* with interpretable units (s-1) without prior timing information of task events. Here we show how ΔR2* time-series estimated with ME-SPFM have physiologically plausible values, in agreement with previously published estimates of ΔR2* for neuronal events. We also show, how having easily interpretable units permits detection of artefactual events that can be easily removed from subsequent analysis and interpretation. Our results suggest that ME-SPFM may provide a pseudo-quantitative method to study the time-varying nature of brain activity in experimentally unconstrained paradigms (naturalistic, resting-state) or clinical applications (detection of inter-ictal epileptic events).
Introduction
Multi-echo (ME) fMRI results in $$$K$$$ time-series per voxel; each acquired at a different TE. Well-understood differences in TE dependence profiles for BOLD (linear dependence) and non-BOLD (no dependence) fluctuations can be exploited to automate denoising of ME fMRI time-series[1]. Here, we propose a novel ME formulation of the Sparse Free Paradigm Mapping[2] (ME-SPFM) algorithm that by combining a hemodynamic response model, the above-mentioned TE-dependence model and L1-norm regularized estimators, produces voxel-wise quantitative estimates of time-varying changes in the transverse relaxation (ΔR2*) and the net magnetization (ΔS0/ S0). All this, without prior information about the timing of experimental events.
To evaluate the quantitative nature of the ME-SPFM outputs, we computed histograms of ΔR2* estimates accompanying five distinct tasks (auditory, finger tapping, reading, viewing of houses and viewing of biological motion patterns). In most instances, estimates fell within physiologically plausible limits of neuronally-driven ΔR2* at 3T[3]. These results indicate ME-SPFM provide a viable method to estimate ΔR2* time-series with interpretable units, even when experimental event timing is missing (e.g., naturalistic, resting-state).
Methods
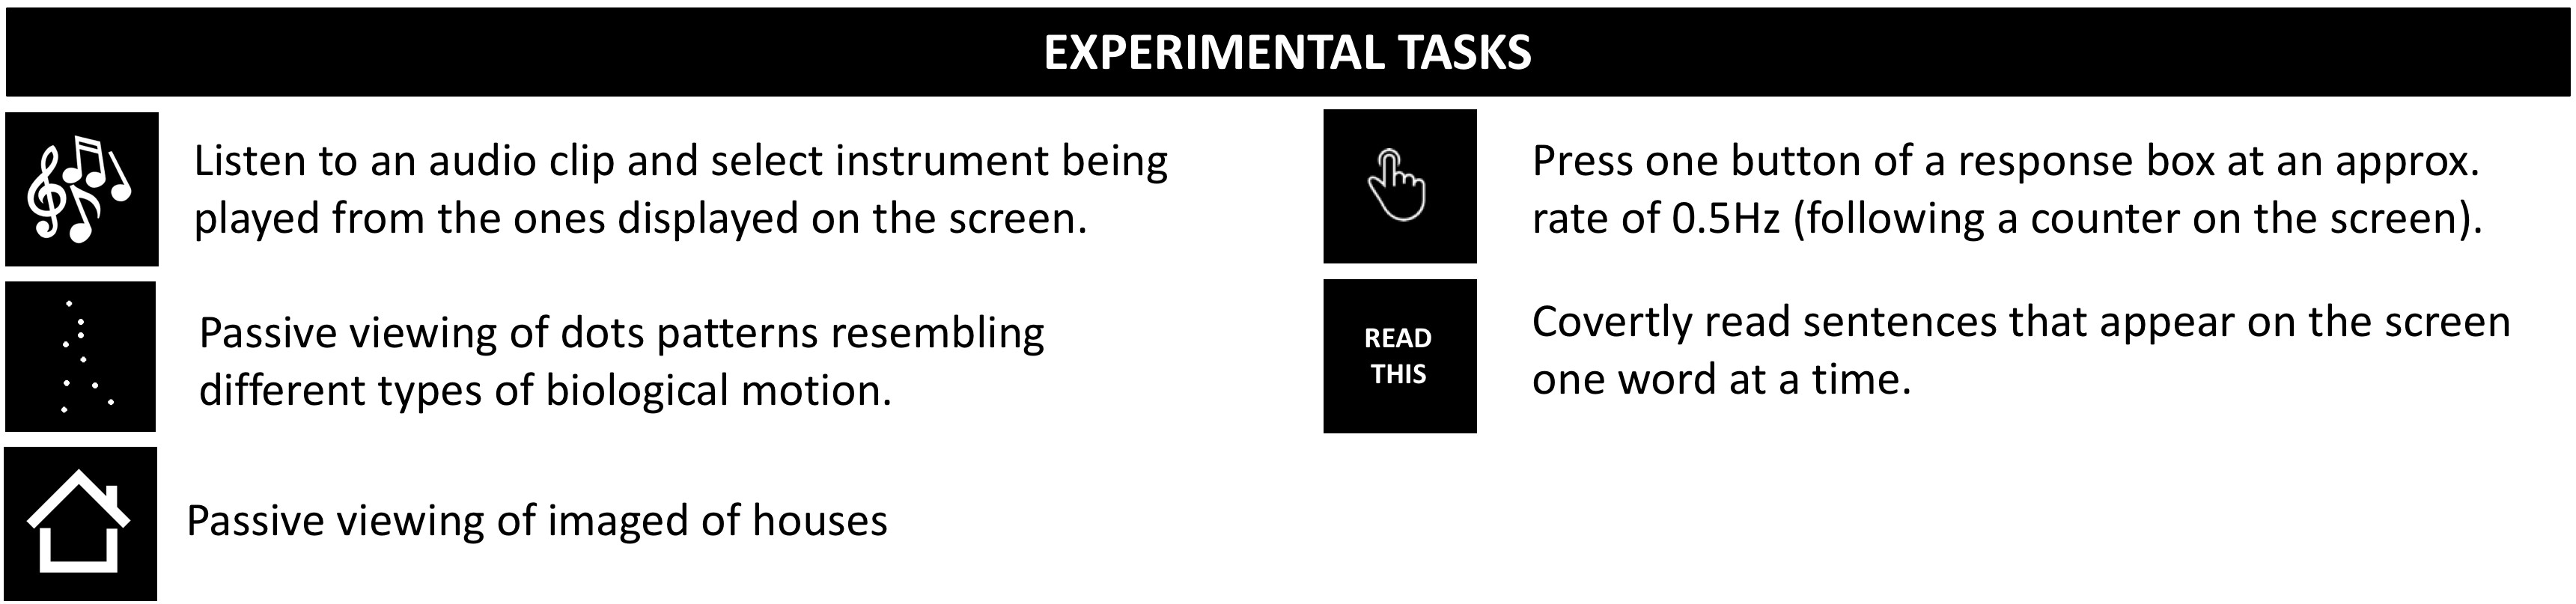
DATA: 9 healthy adults. Anatomicals were preceded by one (3 subjects) or two ME functional scans (3T, EPI, FA=70°, TE=16.3/32.2/48.1ms, TR=2s, Res=3x3x4mm, N=220 volumes, #Slices=30, ASSET=2). Each run had 30 trials of each of 6 different tasks (4s each; Figure 1.A).
PRE-PROCESSING: (1) discard 10s, (2) time-shift correction, (3) estimate motion and MNI transformation, (4) spatial interpolation, (5) ME-ICA denoising (v2.5 beta11), (6) regress nuisance signals (motion, its 1st derivative, and physiological noise[4]), (7) spatial smoothing (FWHM=6mm), and (8) computing signal percentage change.
ME-SPFM: Voxel-wise SPC time-series acquired at $$$TE_k$$$ are defined as $$$\mathbf{y}_k = \frac{\bf{\Delta S}_0}{S_0} - TE_k \bf{\Delta R}_2^*$$$ [5]. A haemodynamic model for the neuronal-related $$$\bf{\Delta R}_2^*$$$ time-series can be defined as $$$\bf{\Delta R}_2^* = \mathbf{H}\mathbf{s}$$$. With $$$N_e$$$, it can be shown that $$\underbrace{\left[ \begin{array}{c} \mathbf{y}_1 \\ \vdots \\ \mathbf{y}_K \end{array} \right]}_{\widetilde{\mathbf{y}}} = \underbrace{\left[ \begin{array}{c} \mathbf{I} \\ \vdots \\ \mathbf{I} \\ \end{array}\right]}_{\widetilde{\mathbf{I}}} \bf{\Delta}\bf{\rho} - \underbrace{ \left[ \begin{array}{c} TE_1 \mathbf{H} \\ \vdots \\ TE_K \mathbf{H}\\ \end{array}\right]}_{\widetilde{\mathbf{H}}} \bf{\Delta s}.$$ The ME-SPFM method estimates $$$\mathbf{s}$$$ and $$$\bf{\Delta\rho}=\frac{\bf{\Delta S}_0}{S_0}$$$ by solving $$$\mathbf{\widehat{x}}=\min_{\mathbf{x}}\|\mathbf{\widetilde{y}}-\mathbf{T}\mathbf{x}\|_2^2 + \lambda \|\mathbf{x}\|_1$$$, where $$$\mathbf{x}^T=\left[\bf{\Delta}\bf{\rho}^T,\bf{\Delta s}^T\right]$$$ and $$$\mathbf{T}=\left[\widetilde{\mathbf{I}} \ \widetilde{\mathbf{H}}\right]$$$.
Here, we used the SPM canonical HRF to generate the convolution matrices $$$\mathbf{H}$$$, and the Bayesian Information Criterion (BIC) to select the regularization parameter $$$\lambda$$$. Furthermore, their activation maps were computed for each trial considering the volumes of the deconvolved coefficients ($$$\mathbf{\widehat{s}}$$$) when each trial occurs (i.e. 3 TRs).
GLM: For each subject and task, activation maps were computed with AFNI 3dREMLfit (pFDR<0.05). These maps were used to generate masks for subsequent computation of histograms of ΔR2* in activated regions.
Results
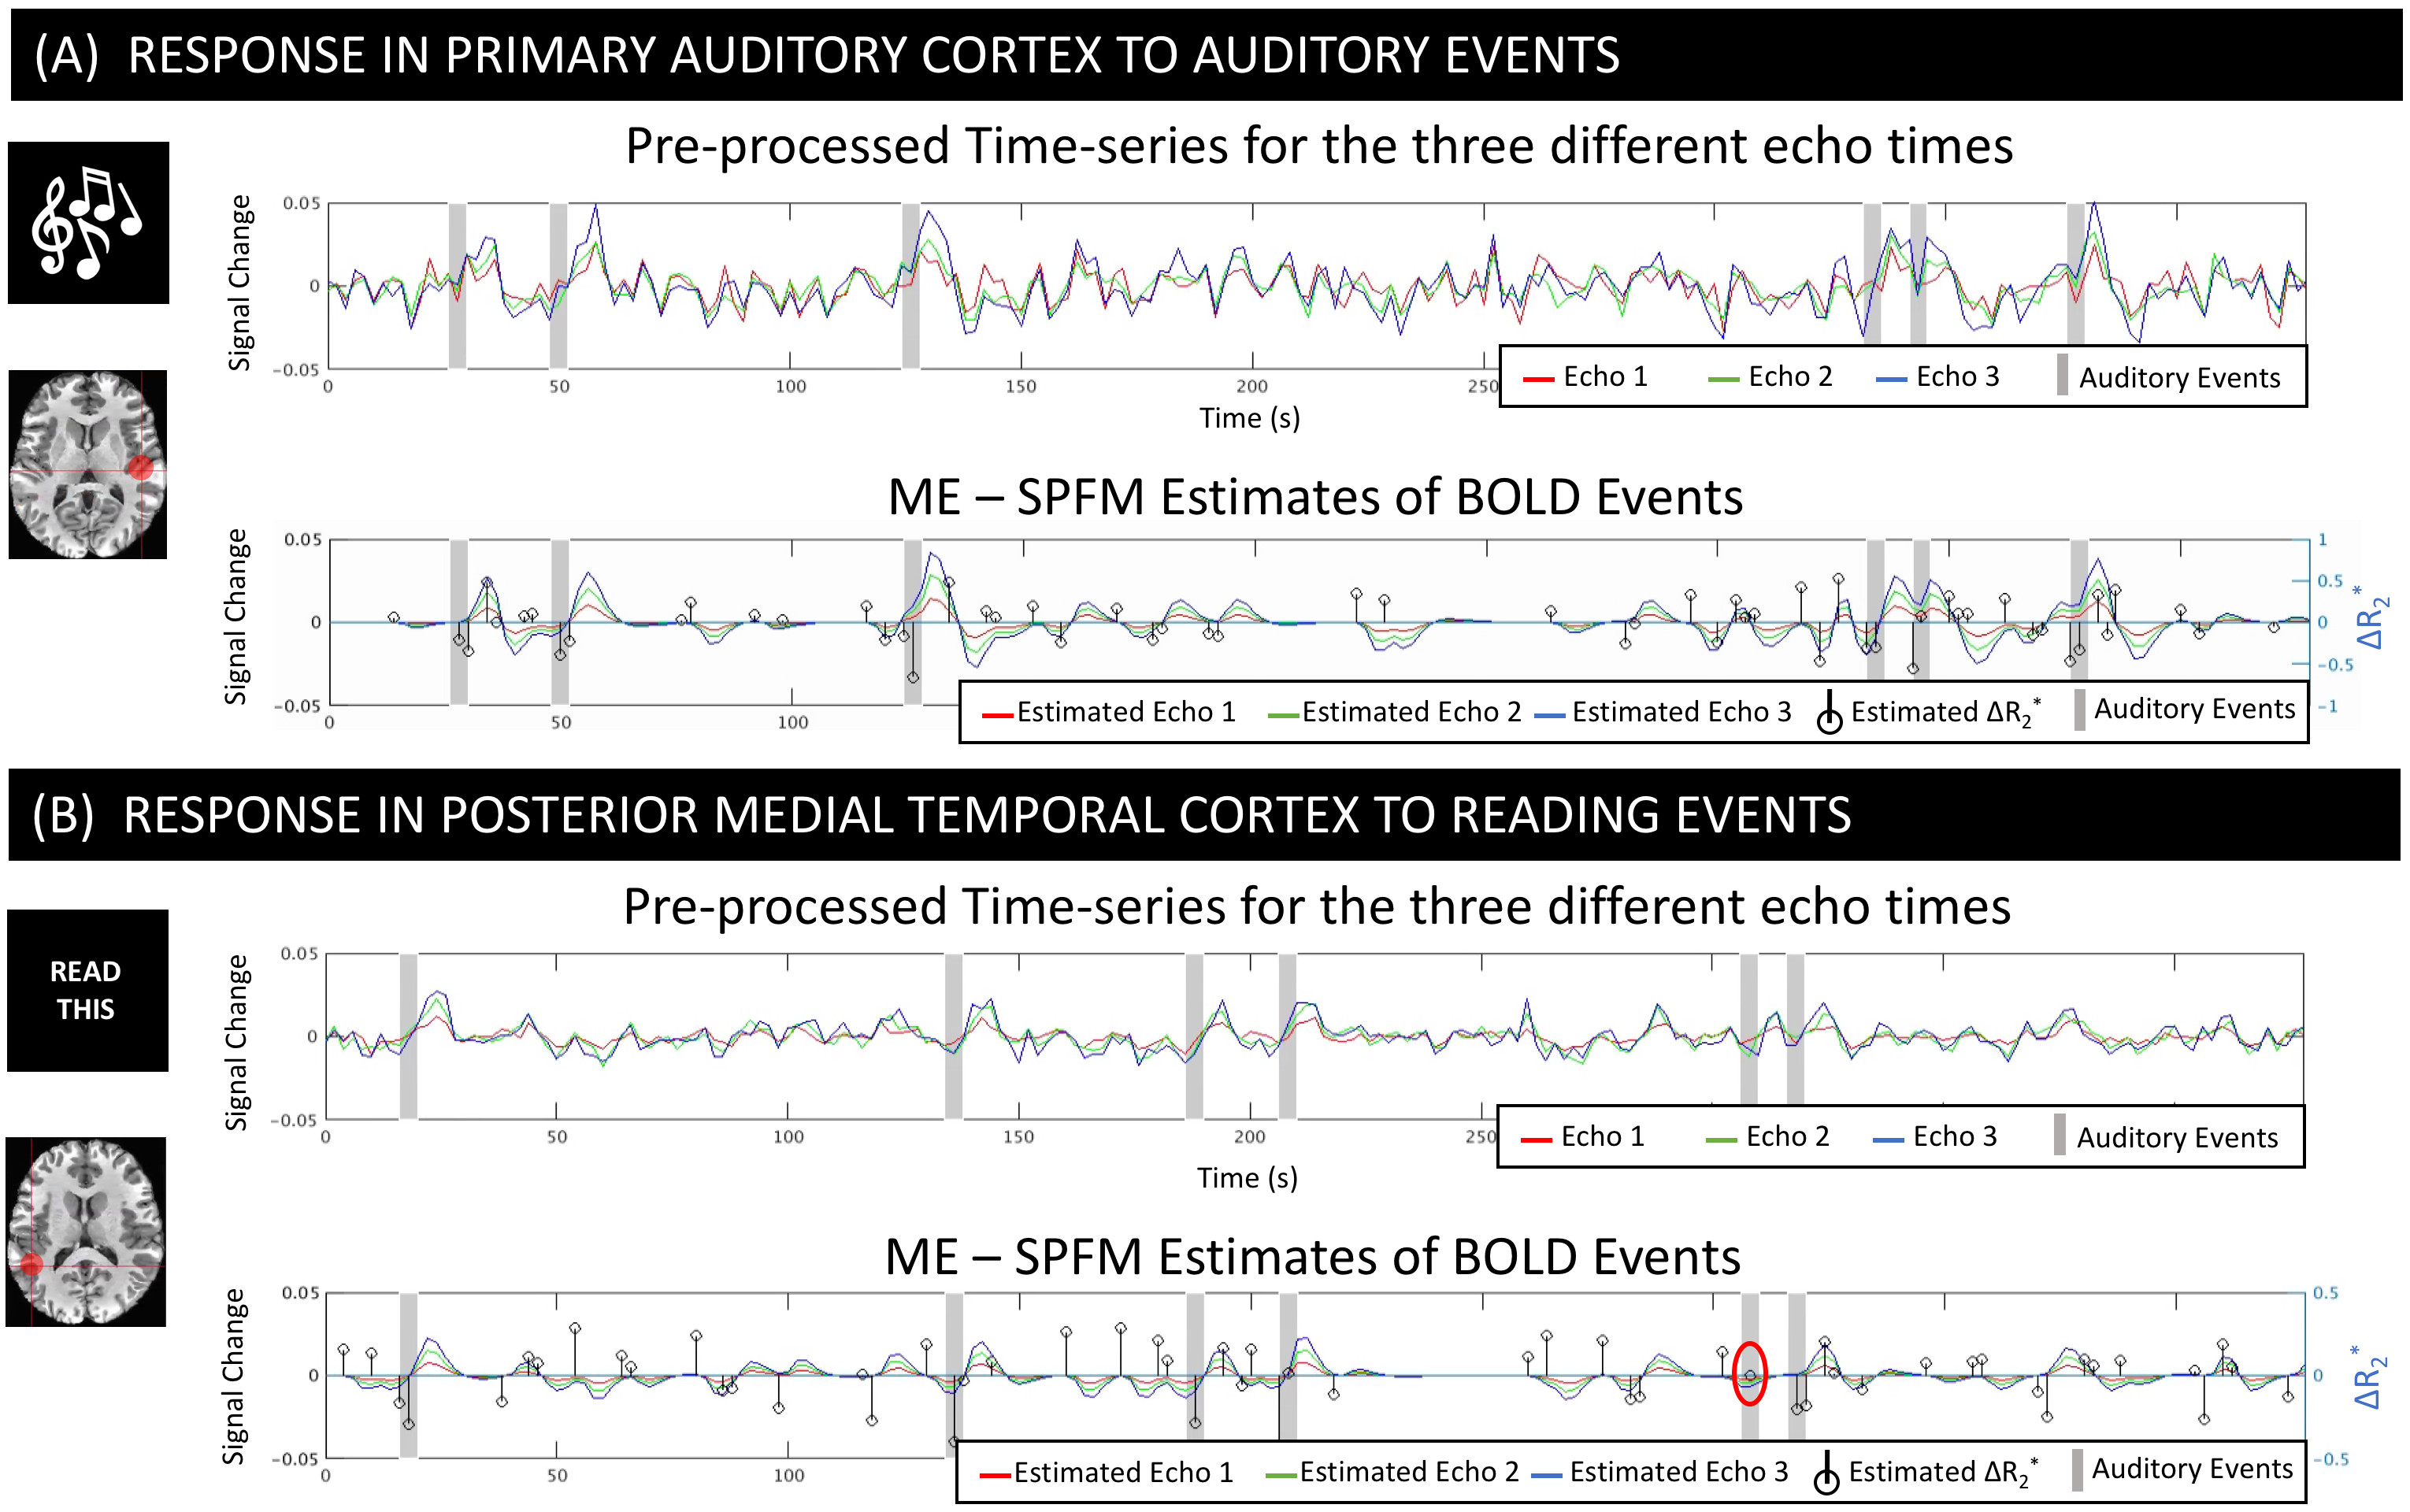
Figure 2.A-B shows pre-processed times-series and ME-SPFM fits for two representative active voxels for the audio and read tasks. ME-SPFM detected all auditory trials. For the reading task, one trial was missed (red circle). In all instances, task-trials are associated with negative ΔR2* under -0.5 s-1.
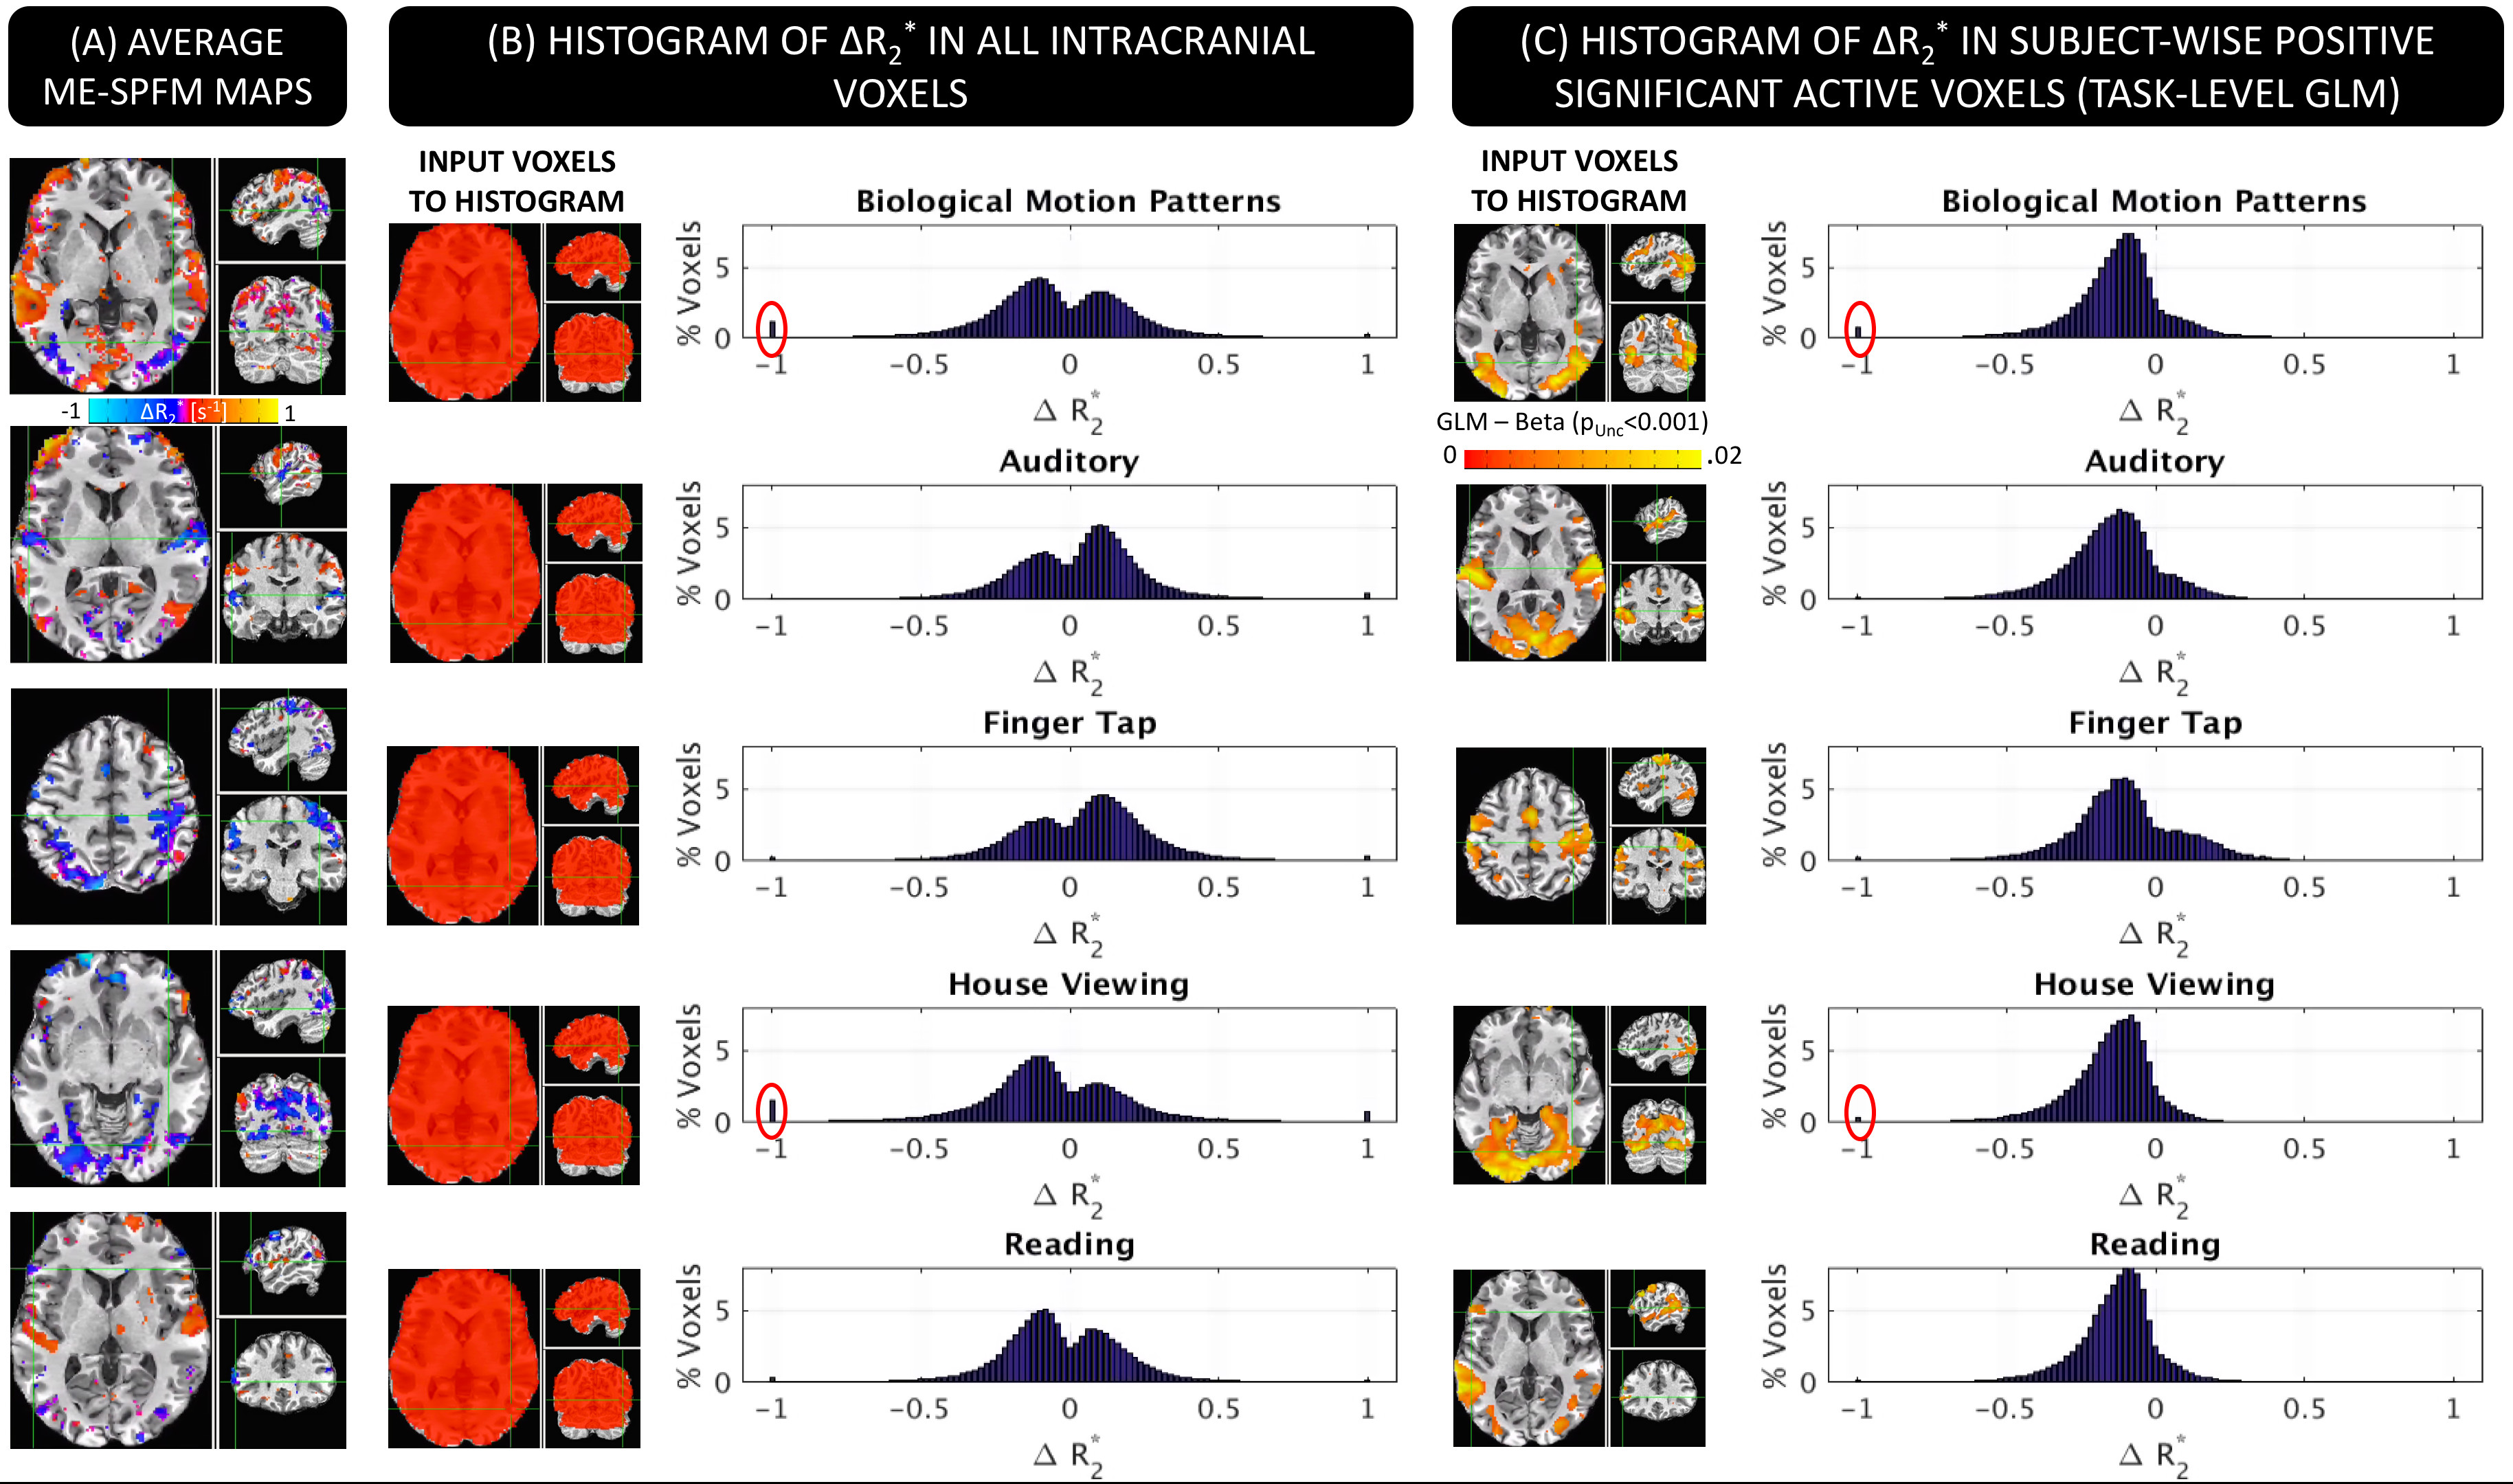
Figure 3.A shows ME-SPFM ΔR2* maps for one representative subject. There is good agreement between GLM (3.A) and ME-SPFM ΔR2* maps (3.C); with areas of positive activation in the GLM maps being dominated by negative changes in ΔR2* in ME-SPFM maps. Figure 3.B shows the histograms of ME-SPFM ΔR2* for all intracranial voxels, where most ΔR2* estimates fall in the range [-0.74, 0.74] s-1 of physiologically plausible values for neuronal activation[3]. Also, Figure 3.C shows the histograms for only voxels with significant positive response according to GLM (pFDR<0.05), where ME-SPFM ΔR2* estimates are mostly negative (e.g., [-0.74,0] s-1). This demonstrates how ME-SPFM yields physiologically plausible quantitative estimates of ΔR2*, and only few voxels (red circles in Figure 3.C) exhibited excessively large ΔR2* to be mislabeled as neuronal-related events.
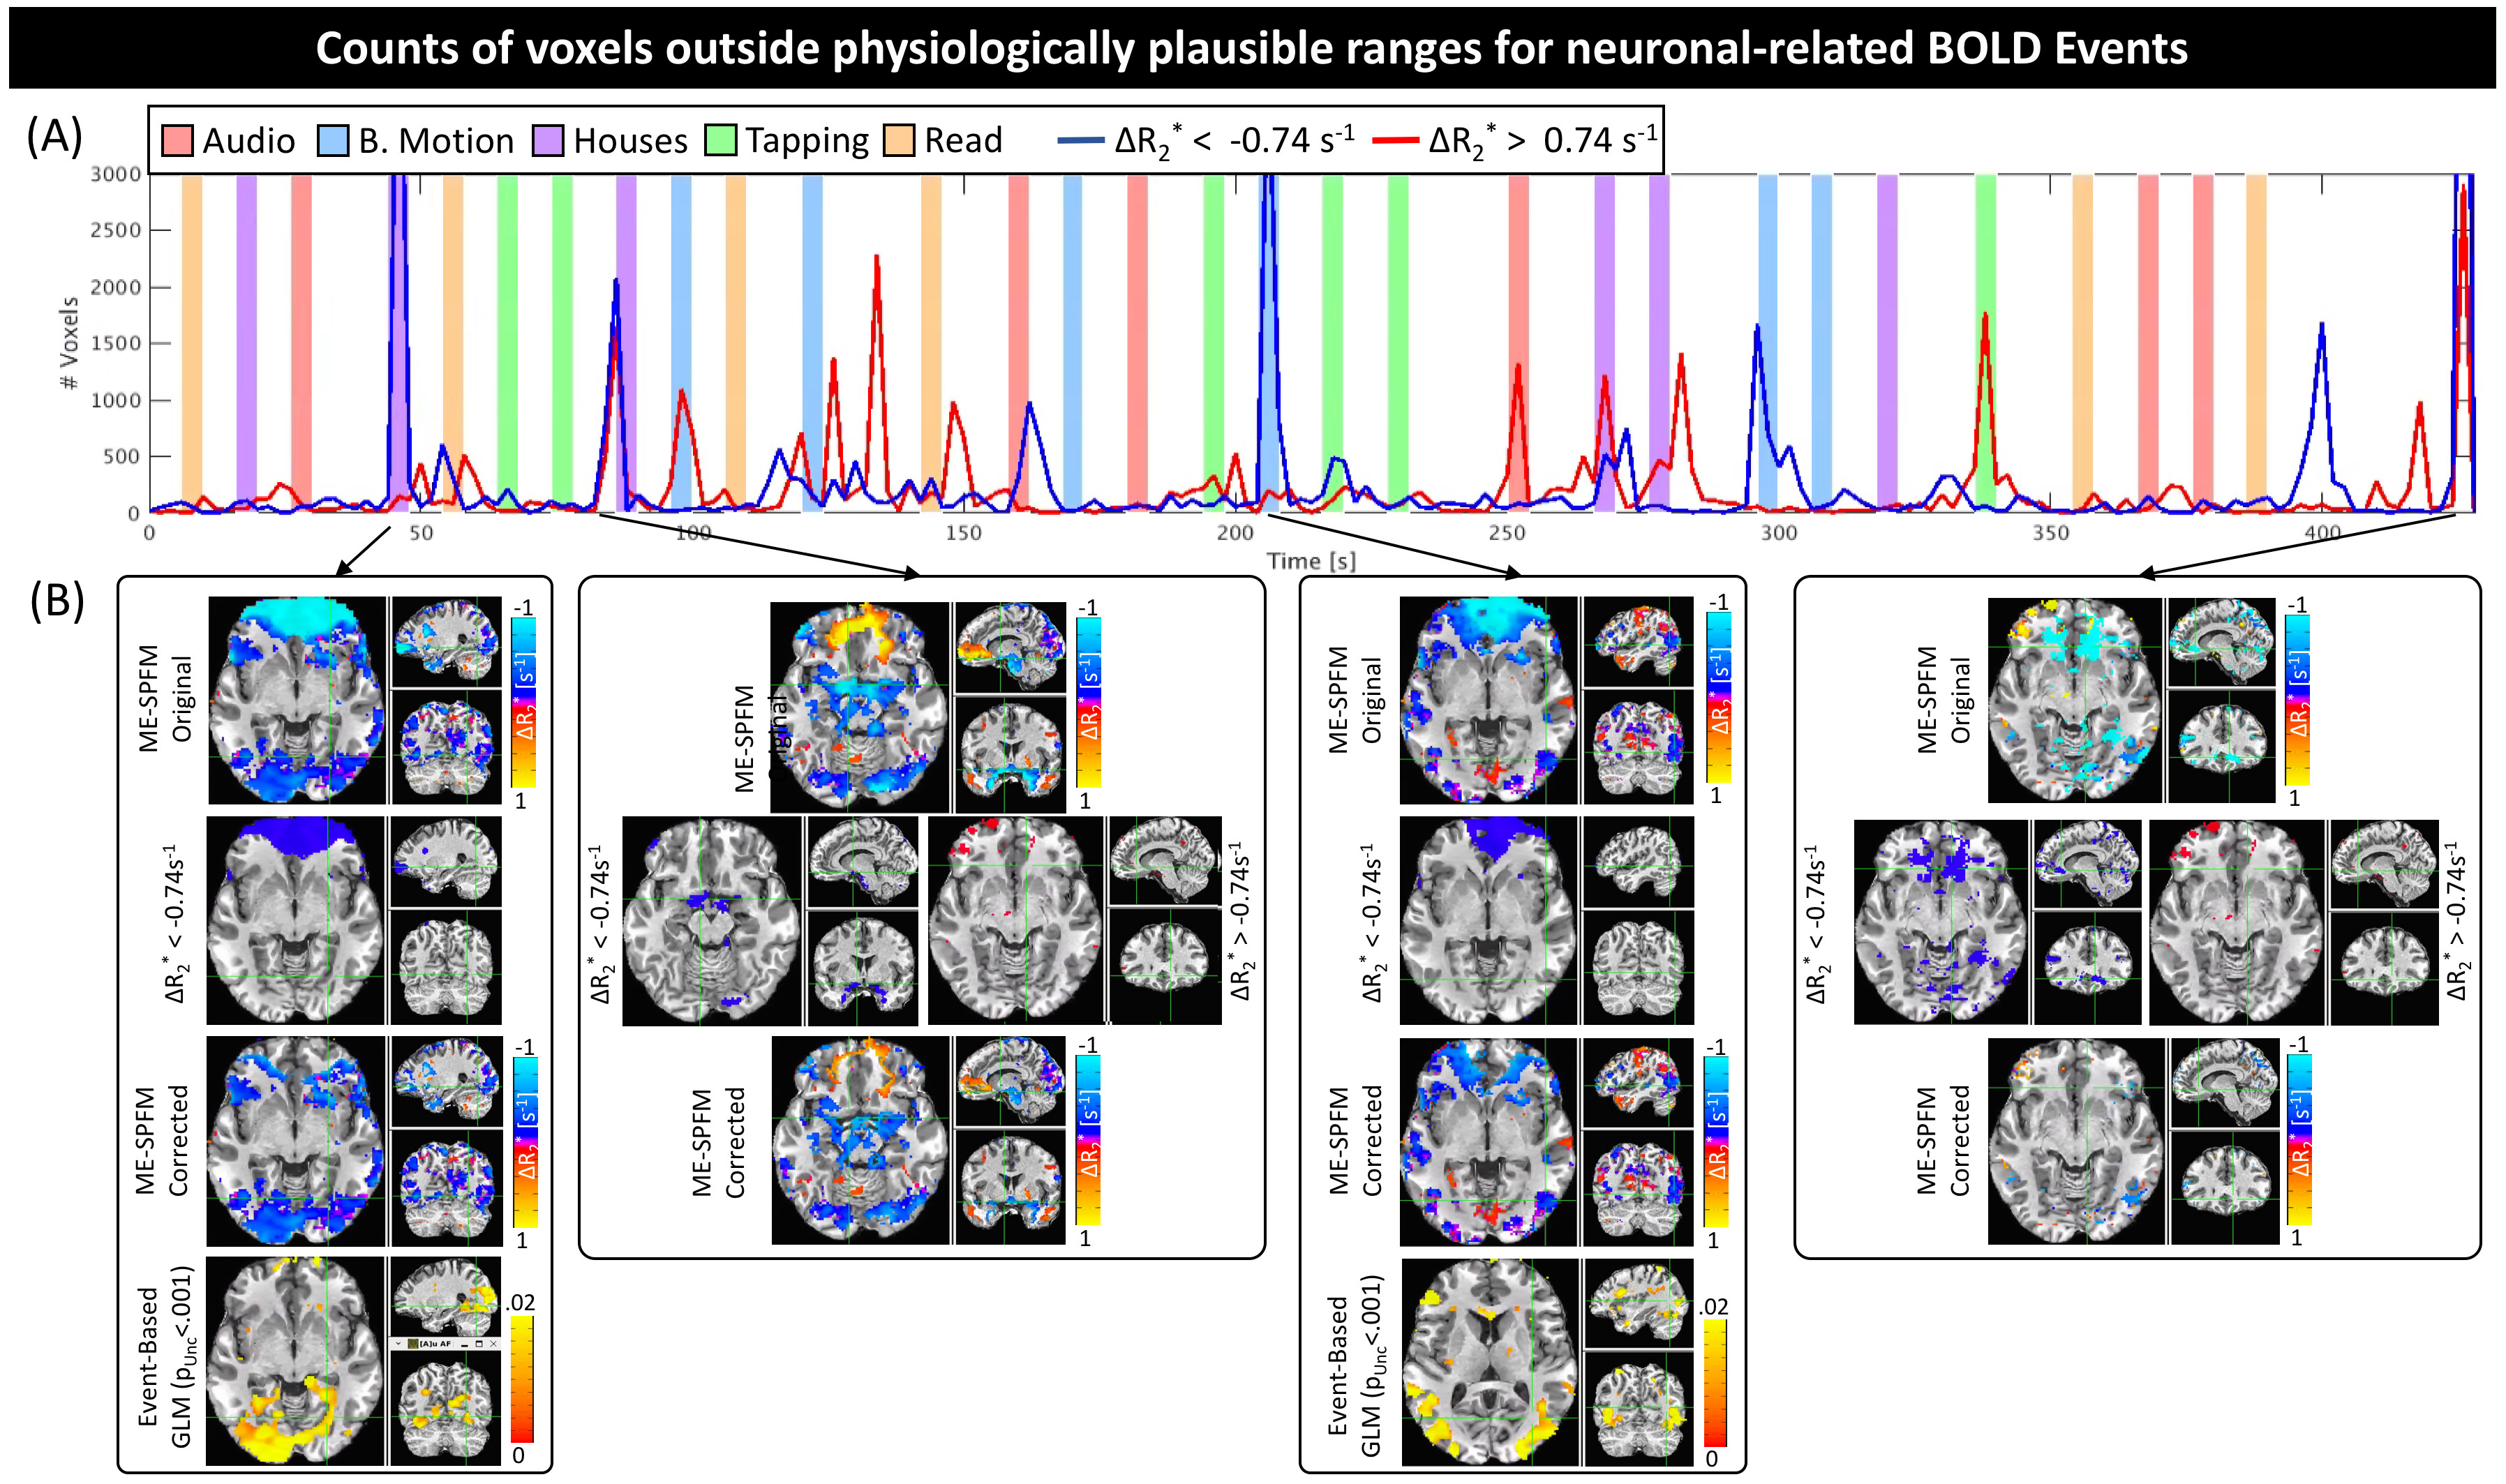
Figure 4 shows time-series of physiologically-implausible voxel counts (4.A), and maps at time points with higher counts before and after removing such voxels (4.B) for one representative subject. Erroneous estimates are mostly constrained to ventromedial frontal cortex, area prone to eye movement artifacts and signal distortions. Thresholding to physiologically plausible ΔR2*values ([-0.74, 0.74] s-1) produces corrected maps that better match GLM analysis.
Discussion/Conclusions
Our evaluations indicate that ME-SPFM can generate time-series of ΔR2* with interpretable units (s-1). Average estimates of ΔR2* in areas activated by the different tasks fall within physiologically plausible values. Voxels with excessively high ΔR2* values were limited in space. Simple thresholding based on previously published estimates of ΔR2* for neuronally-induced BOLD fluctuations permitted to correct ΔR2* maps that more closely resemble activity maps generated with traditional model-based approaches.
Acknowledgements
This research was possible thanks to the support of the National Institute of Mental Health Intramural Research Program. Portions of this study used the high-performance computational capabilities of the Biowulf Linux cluster at the National Institutes of Health, Bethesda, MD (biowulf.nih.gov). This study is part of NIH clinical protocol number NCT00001360, protocol ID 93-M-0170 and annual report ZIAMH002783-17. Dr. Caballero-Gaudes was supported by the Spanish Ministry of Economy and Competitiveness, through grant PSI 2013-42343 Neuroimagen Multimodal and the Severo Ochoa Programme for Centres/Units of Excellence in R&D (SEV-2015-490).References
[1] Kundu P, Inati SJ, Evans JW, Luh WM, Bandettini PA. (2012). Differentiating BOLD and non-BOLD signals in fMRI time series using multi-echo EPI. NeuroImage. 60, 1759-1770.
[2] Caballero Gaudes C, Petridou N, Francis ST, Dryden IL, Gowland PA. (2013). Paradigm free mapping with sparse regression automatically detects single-trial functional magnetic resonance imaging blood oxygenation level dependent responses. Hum. Brain Mapp. 34(3), 501-518.
[3] Donahue MJ, Hoogduin H, Van Zijl PCM, Jezzard P, Luijten PR, Hendrikse J. (2011). “Blood oxygenation level-dependent (BOLD) total and extravascular signal changes and ΔR2* in human visual cortex at 1.5, 3.0 and 7.0 T. NMR Biomed. 2011; 24: 25-34.
[4] Behzadi Y, Restom K, Liau J, Liu TT. (2007). “A Component Based Noise Correction Method (ComCorr) for BOLD and Perfusion Based fMRI” NeuroImage 37(1); 90-101.
[5] Kundu P, Voon V, Balchandani P, Lombardo MV, Poser BA, Bandettini PA. (2017). Multi-echo fMRI: A review of applications in fMRI denoising and analysis of BOLD signals. Neuroimage 154, 59-80.
Figures