1123
Whole brain Quasi-Periodic patterns interact with visual stimulation processing in mice1University of Antwerp, Antwerpen, Belgium, 2Emory university, Atlanta, GA, United States
Synopsis
We show the detection of whole-brain mouse Quasi-periodic patterns (QPPs), highlighting their interaction with the global signal and coincidence with anti-correlation between speculative mouse Default Mode (DMN) and Task-Positive (TPN)-like networks. We further investigated how QPPs interact with sensory information processing. By tracking QPP behavior during an fMRI visual stimulation block design, we illustrate how QPPs can become modulated by visual stimulation, triggering or diminishing their occurrence. We then linearly regressed QPPs from the fMRI images to show how QPPs underlie a substantial fraction of visual response magnitude and variance. These results suggest the relevance of QPPs in sensory processing.
Introduction
Recently, we showed for the first time the existence of QPPs in mice, imaging only a subsection of the brain1. We now show their detection at the whole-brain level, revealing DMN-TPN-like anti-correlations and a relationship with the global signal. Similar observations were previously shown in humans, suggesting QPPs orchestrate large-scale network interactions2,3. QPPs and similar intrinsic BOLD fluctuations were further linked to arousal and task performance4–6. We therefore performed visual fMRI to assess how QPPs might interact with sensory stimulation processing.Methods
4-5 month old C57BL6/J mice (n=24) were scanned on a 9.4T scanner (GE-EPI - TR:500ms; TE:16ms; matrix:90x70x12; FOV:(270x210x60)mm). Animals were anesthetized with isoflurane (0.5%) and medetomidine (bolus:0.075mg/kg, infusion:0.150mg/kg/h). Functional scans were acquired 30min post-bolus: 10min rsfMRI scans, followed by 15min bilateral visual stimulation fMRI scans (10 blocks of 30s ON (4Hz, 50% duty cycle) and 60s OFF). Subject preprocessed images (SPM12) were concatenated per group (rsfMRI/fMRI) to extract group-wise QPPs. QPPs were determined with and without global signal (GS) regression (GSR). (Analysis performed in MATLAB2015a).
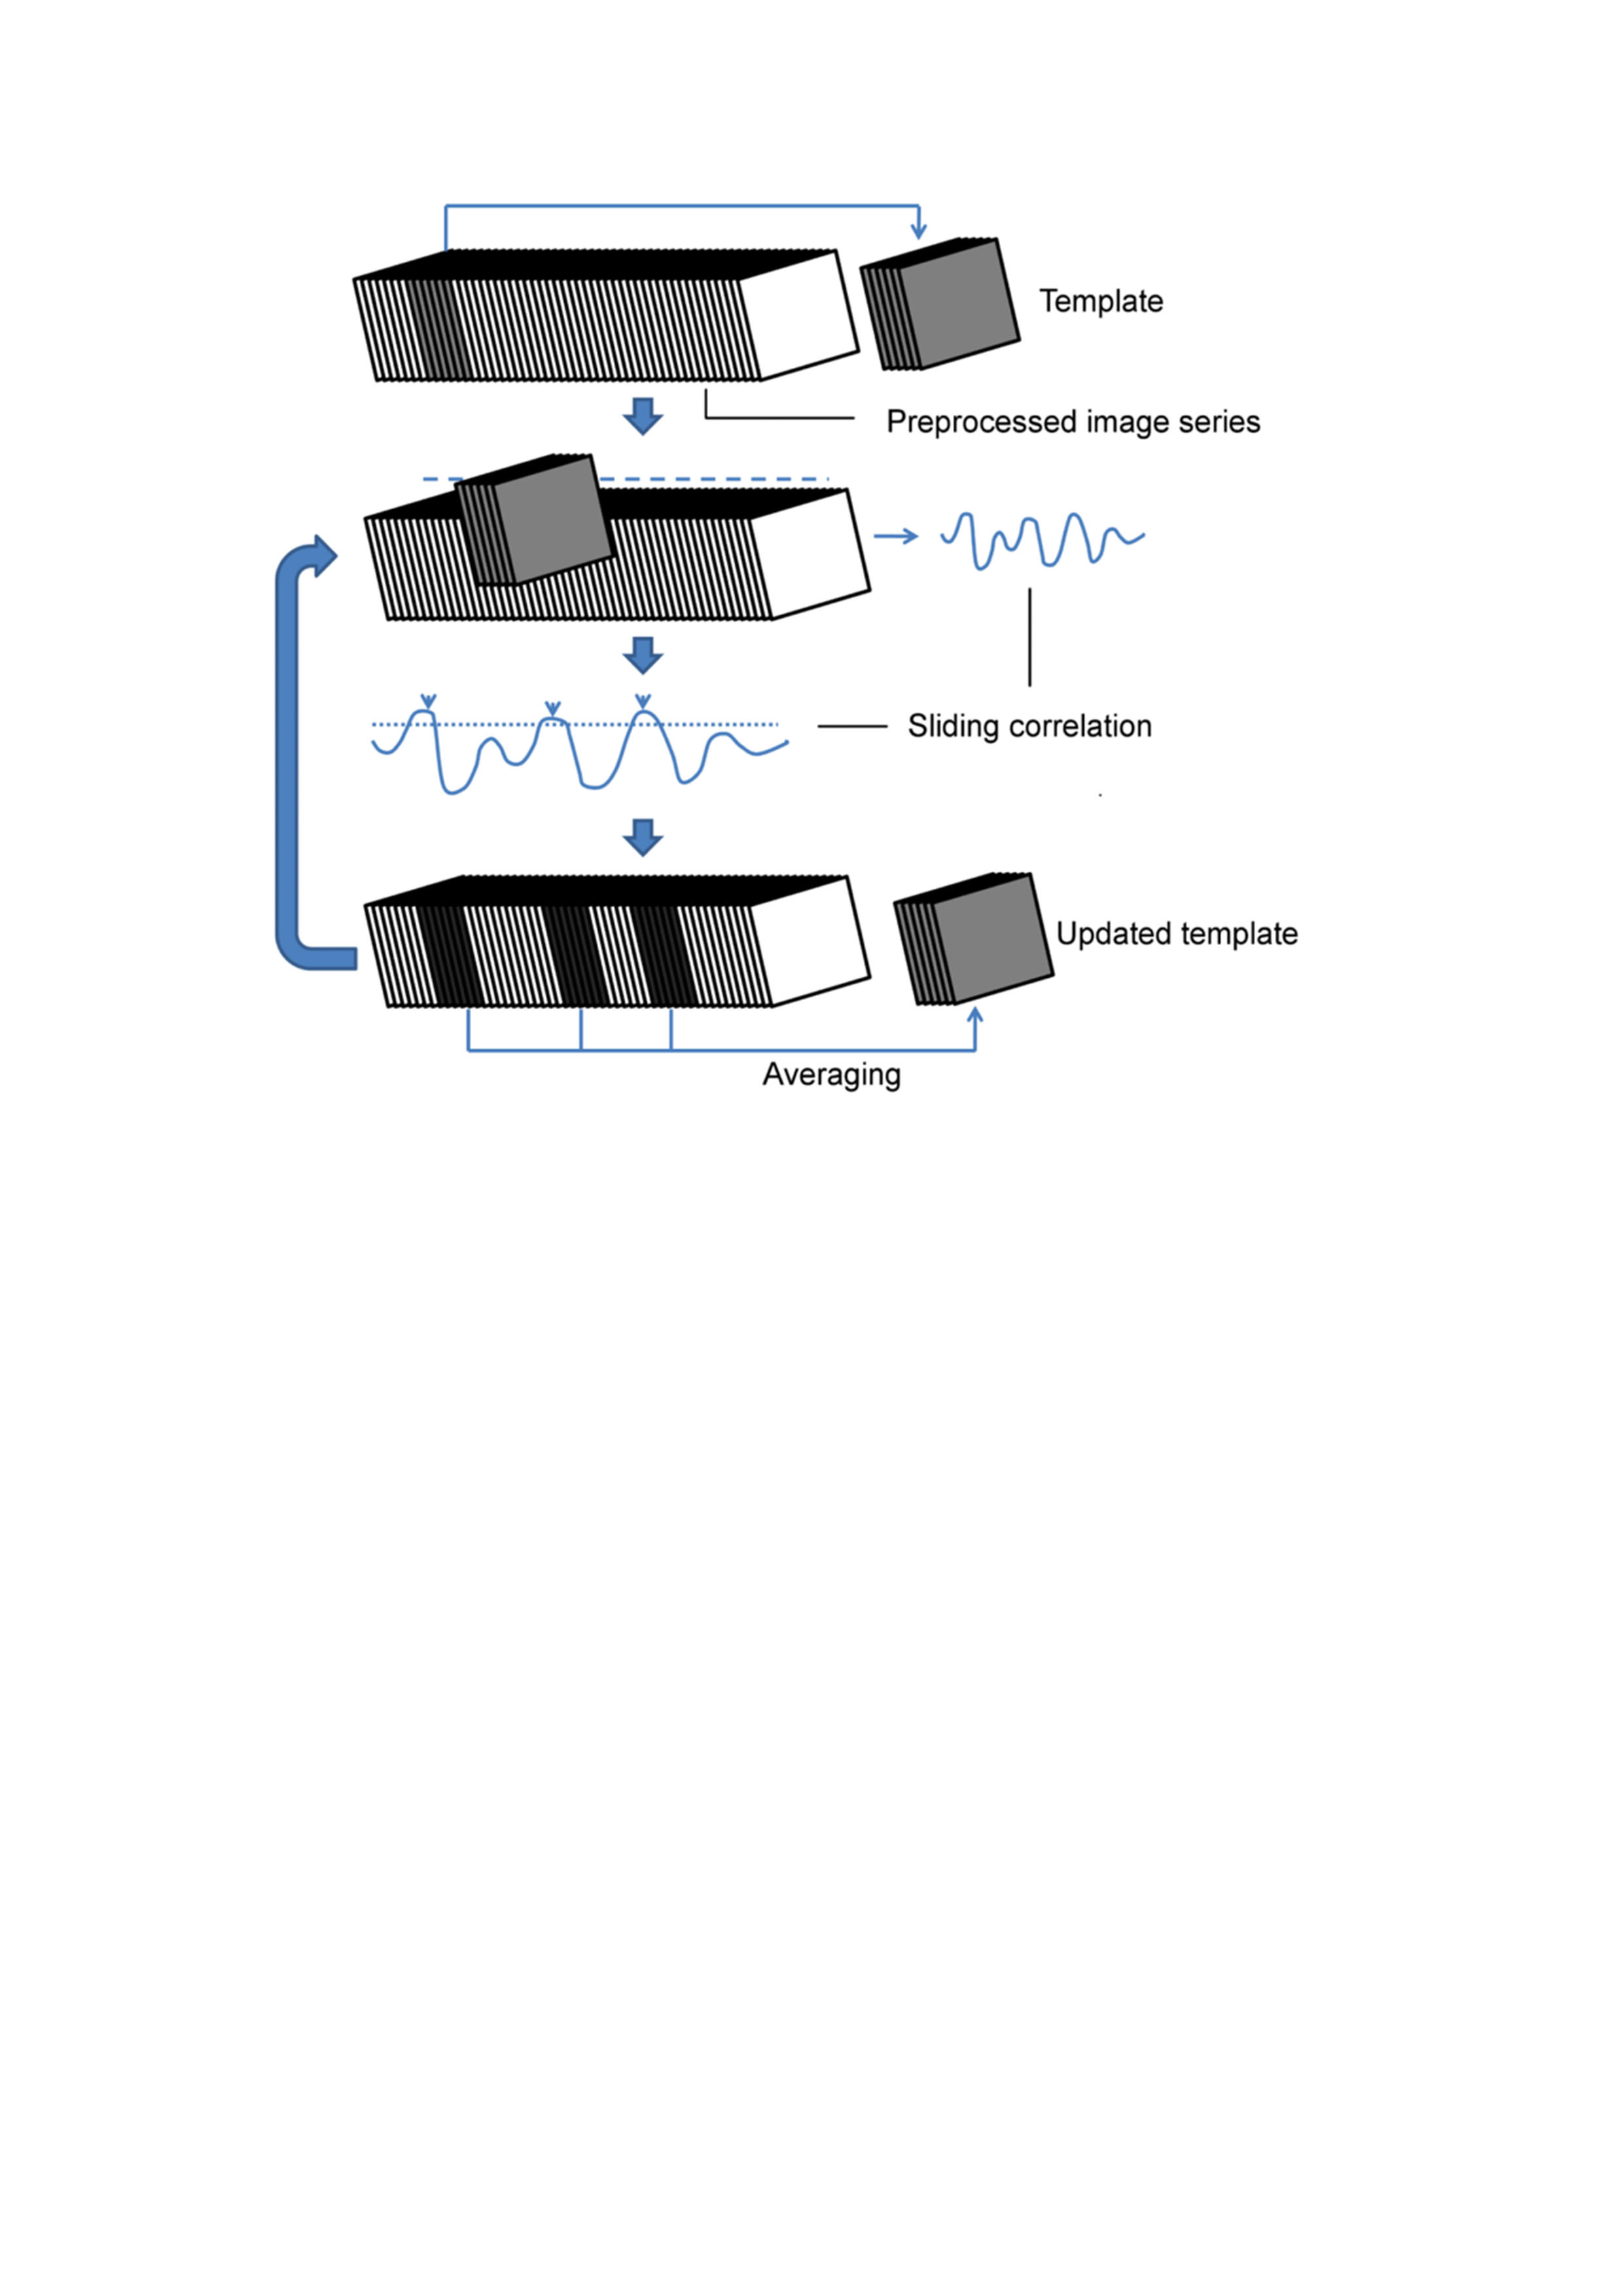
QPPs are accompanied by their Sliding window Template Correlation (STC) with the reference image series (YR) from which they are derived, through averaging frames at STC peak values (Fig.1)3. Similar STCs can be constructed with another ‘target’ image series (YT), i.e. projection (e.g. YR-rsfMRI -> YT-fMRI). This allows assessment of pattern detection rate in the YT. Frames at STC peaks were used for statistical parametric mapping of QPPs within and between groups.
RsfMRI-derived QPPs were projected onto fMRI scans and were convolved with respective projection STCs, constructing fMRI QPP-image series (YQPP). Using the general-linear model approach, the YQPP were regressed voxel-wise out of the original fMRI YT, so that the impact of QPPs on visual stimulation processing could be investigated.
Results
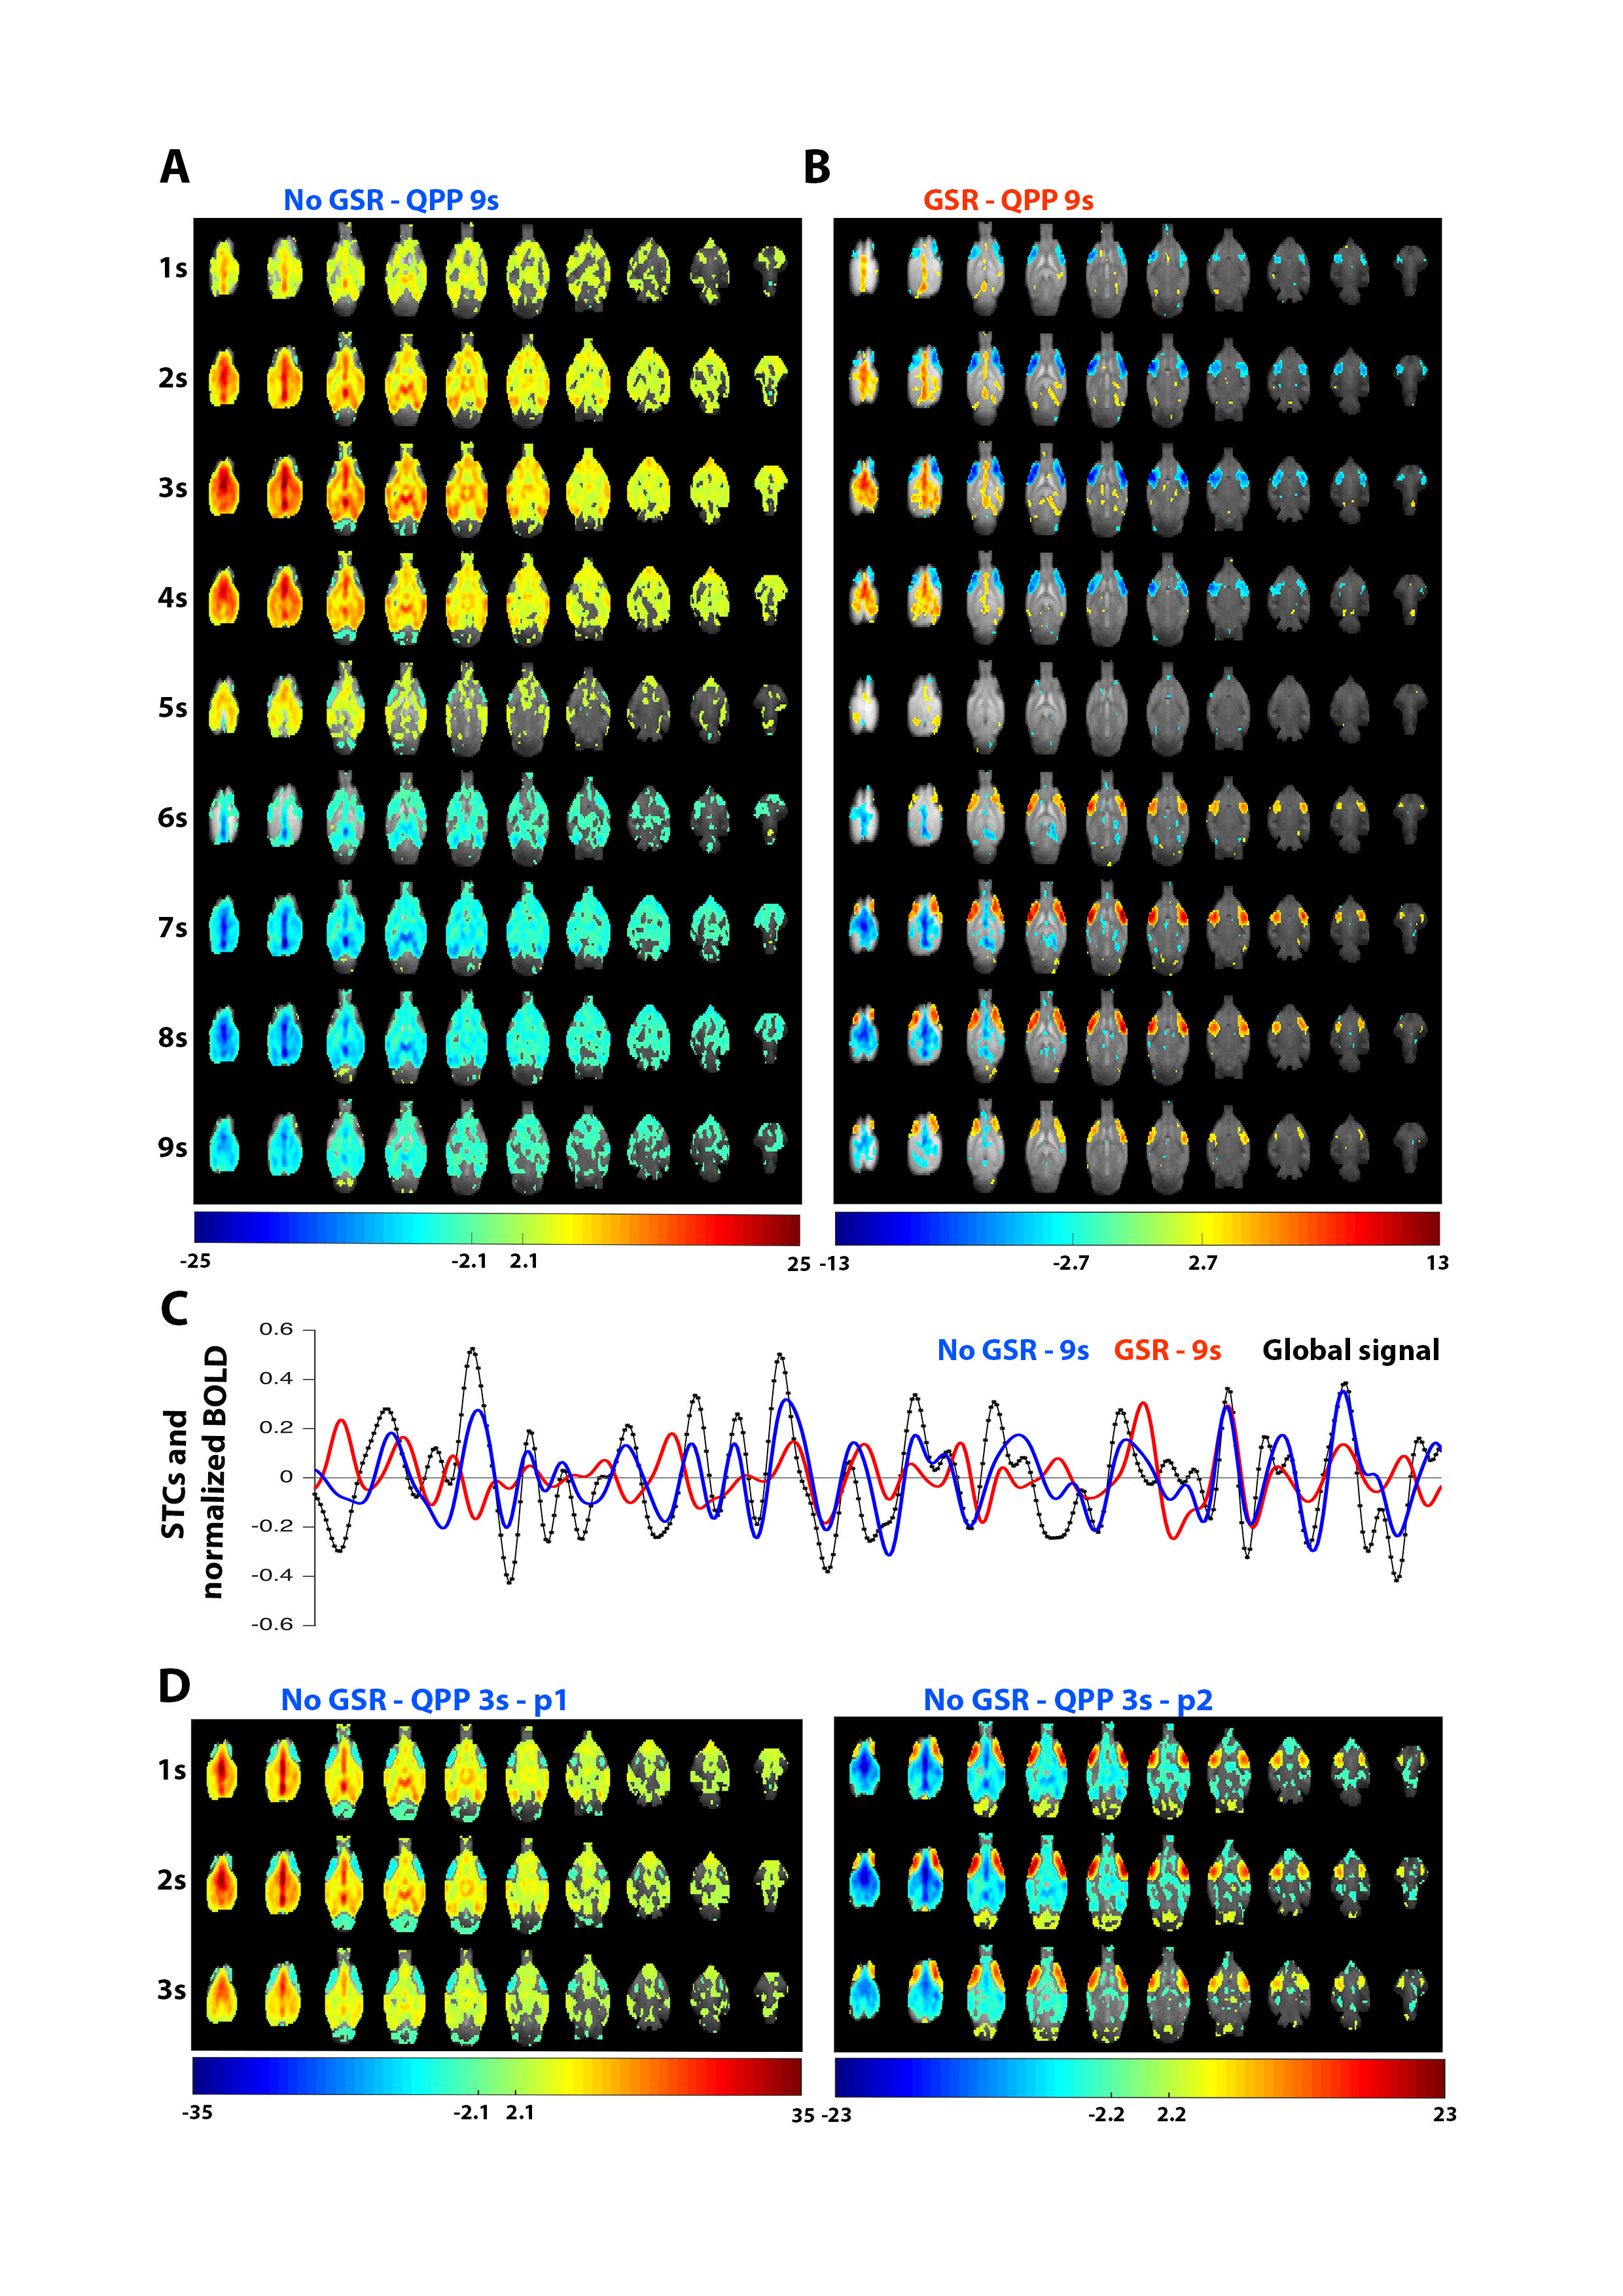
Without GSR, a single QPP was observed at longer window sizes, which displays high overlap with the global signal (Fig.2C) and involvement of mouse DMN-like brain regions (Fig.2A). After GSR, again a single QPP was detected, displaying involvement of similar DMN-like cortical midline regions, which now additionally show strong anti-correlation with the lateral cortical network (Fig.2B). Both QPPs overlap with a temporal offset of 0.5s (STC cc: 0.32).
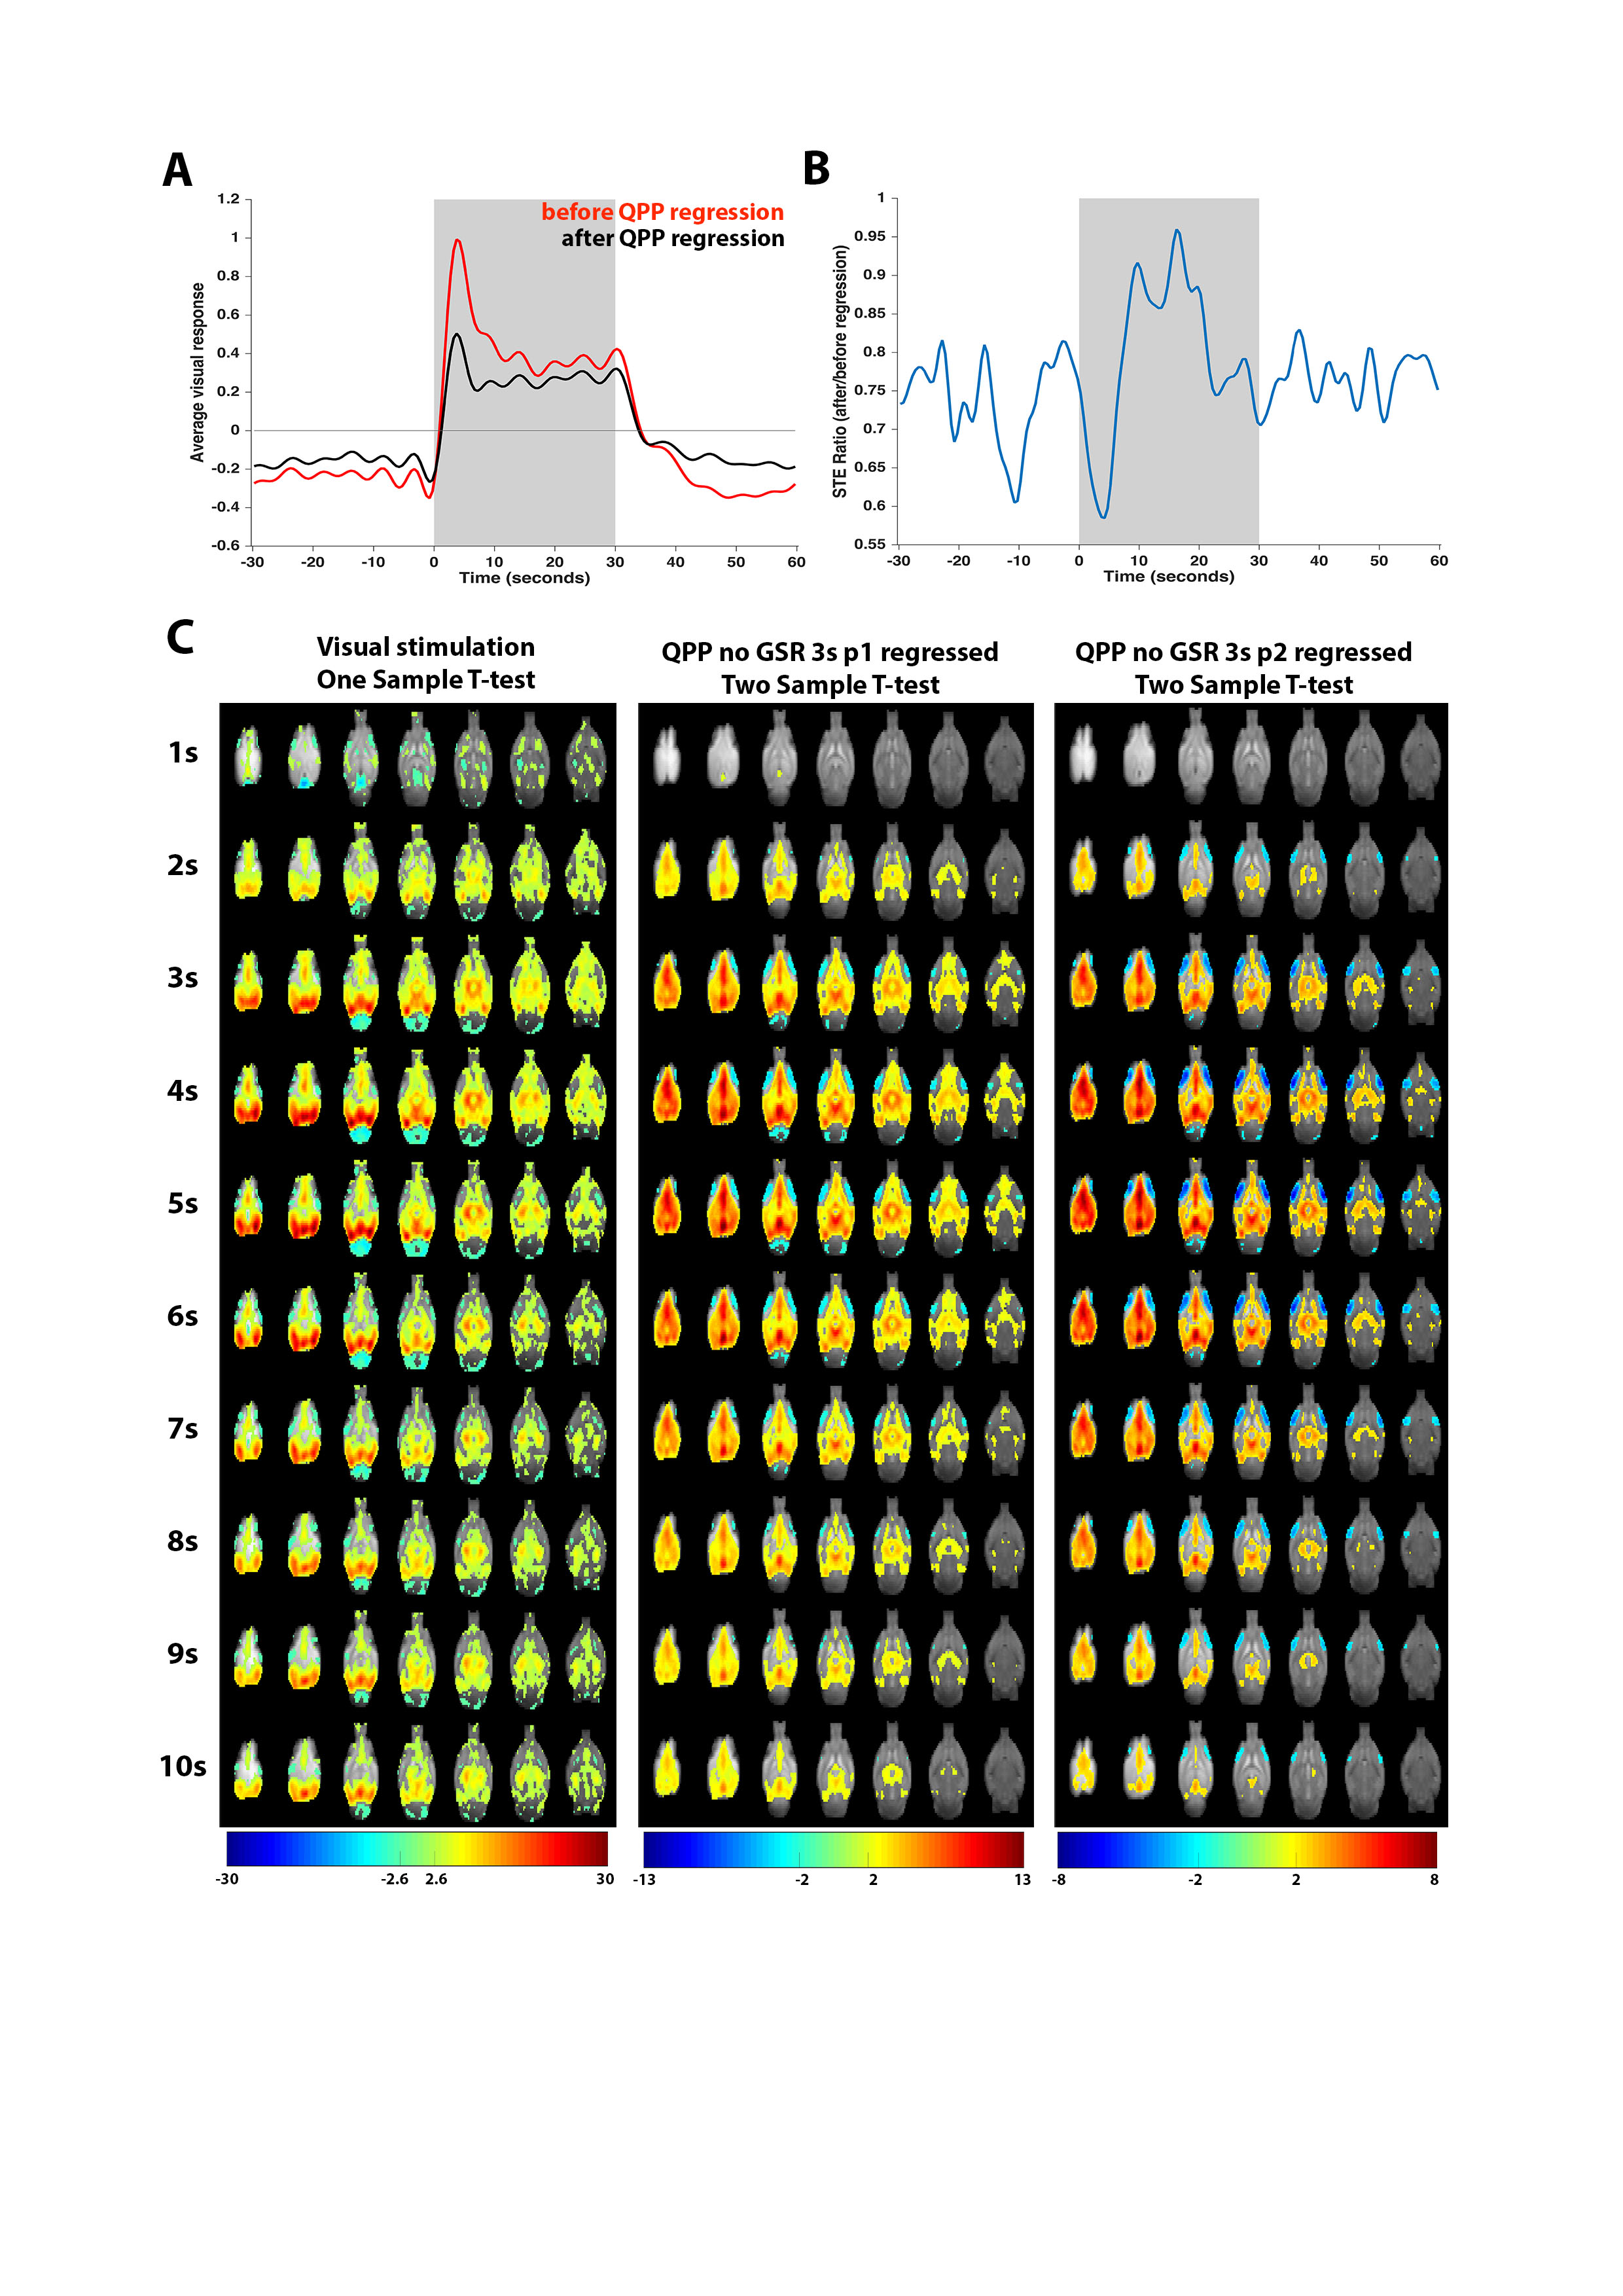
At short 3s window sizes, two QPPs could be observed in the non-GSR time series, displaying similar anti-correlated structures as described above and respectively showing similarity to the first (p1) and second (p2) intensity phase of the long GSR-derived QPP (Fig.2B&D). Their timings respectively overlap with start (STC cc:0.63, lag:+1s) and end (STC cc:0.40; lag:+6s) of the long non-GSR derived QPP. These short QPPs highlight how the observed midline-lateral cortical anti-correlation is not induced by GSR.
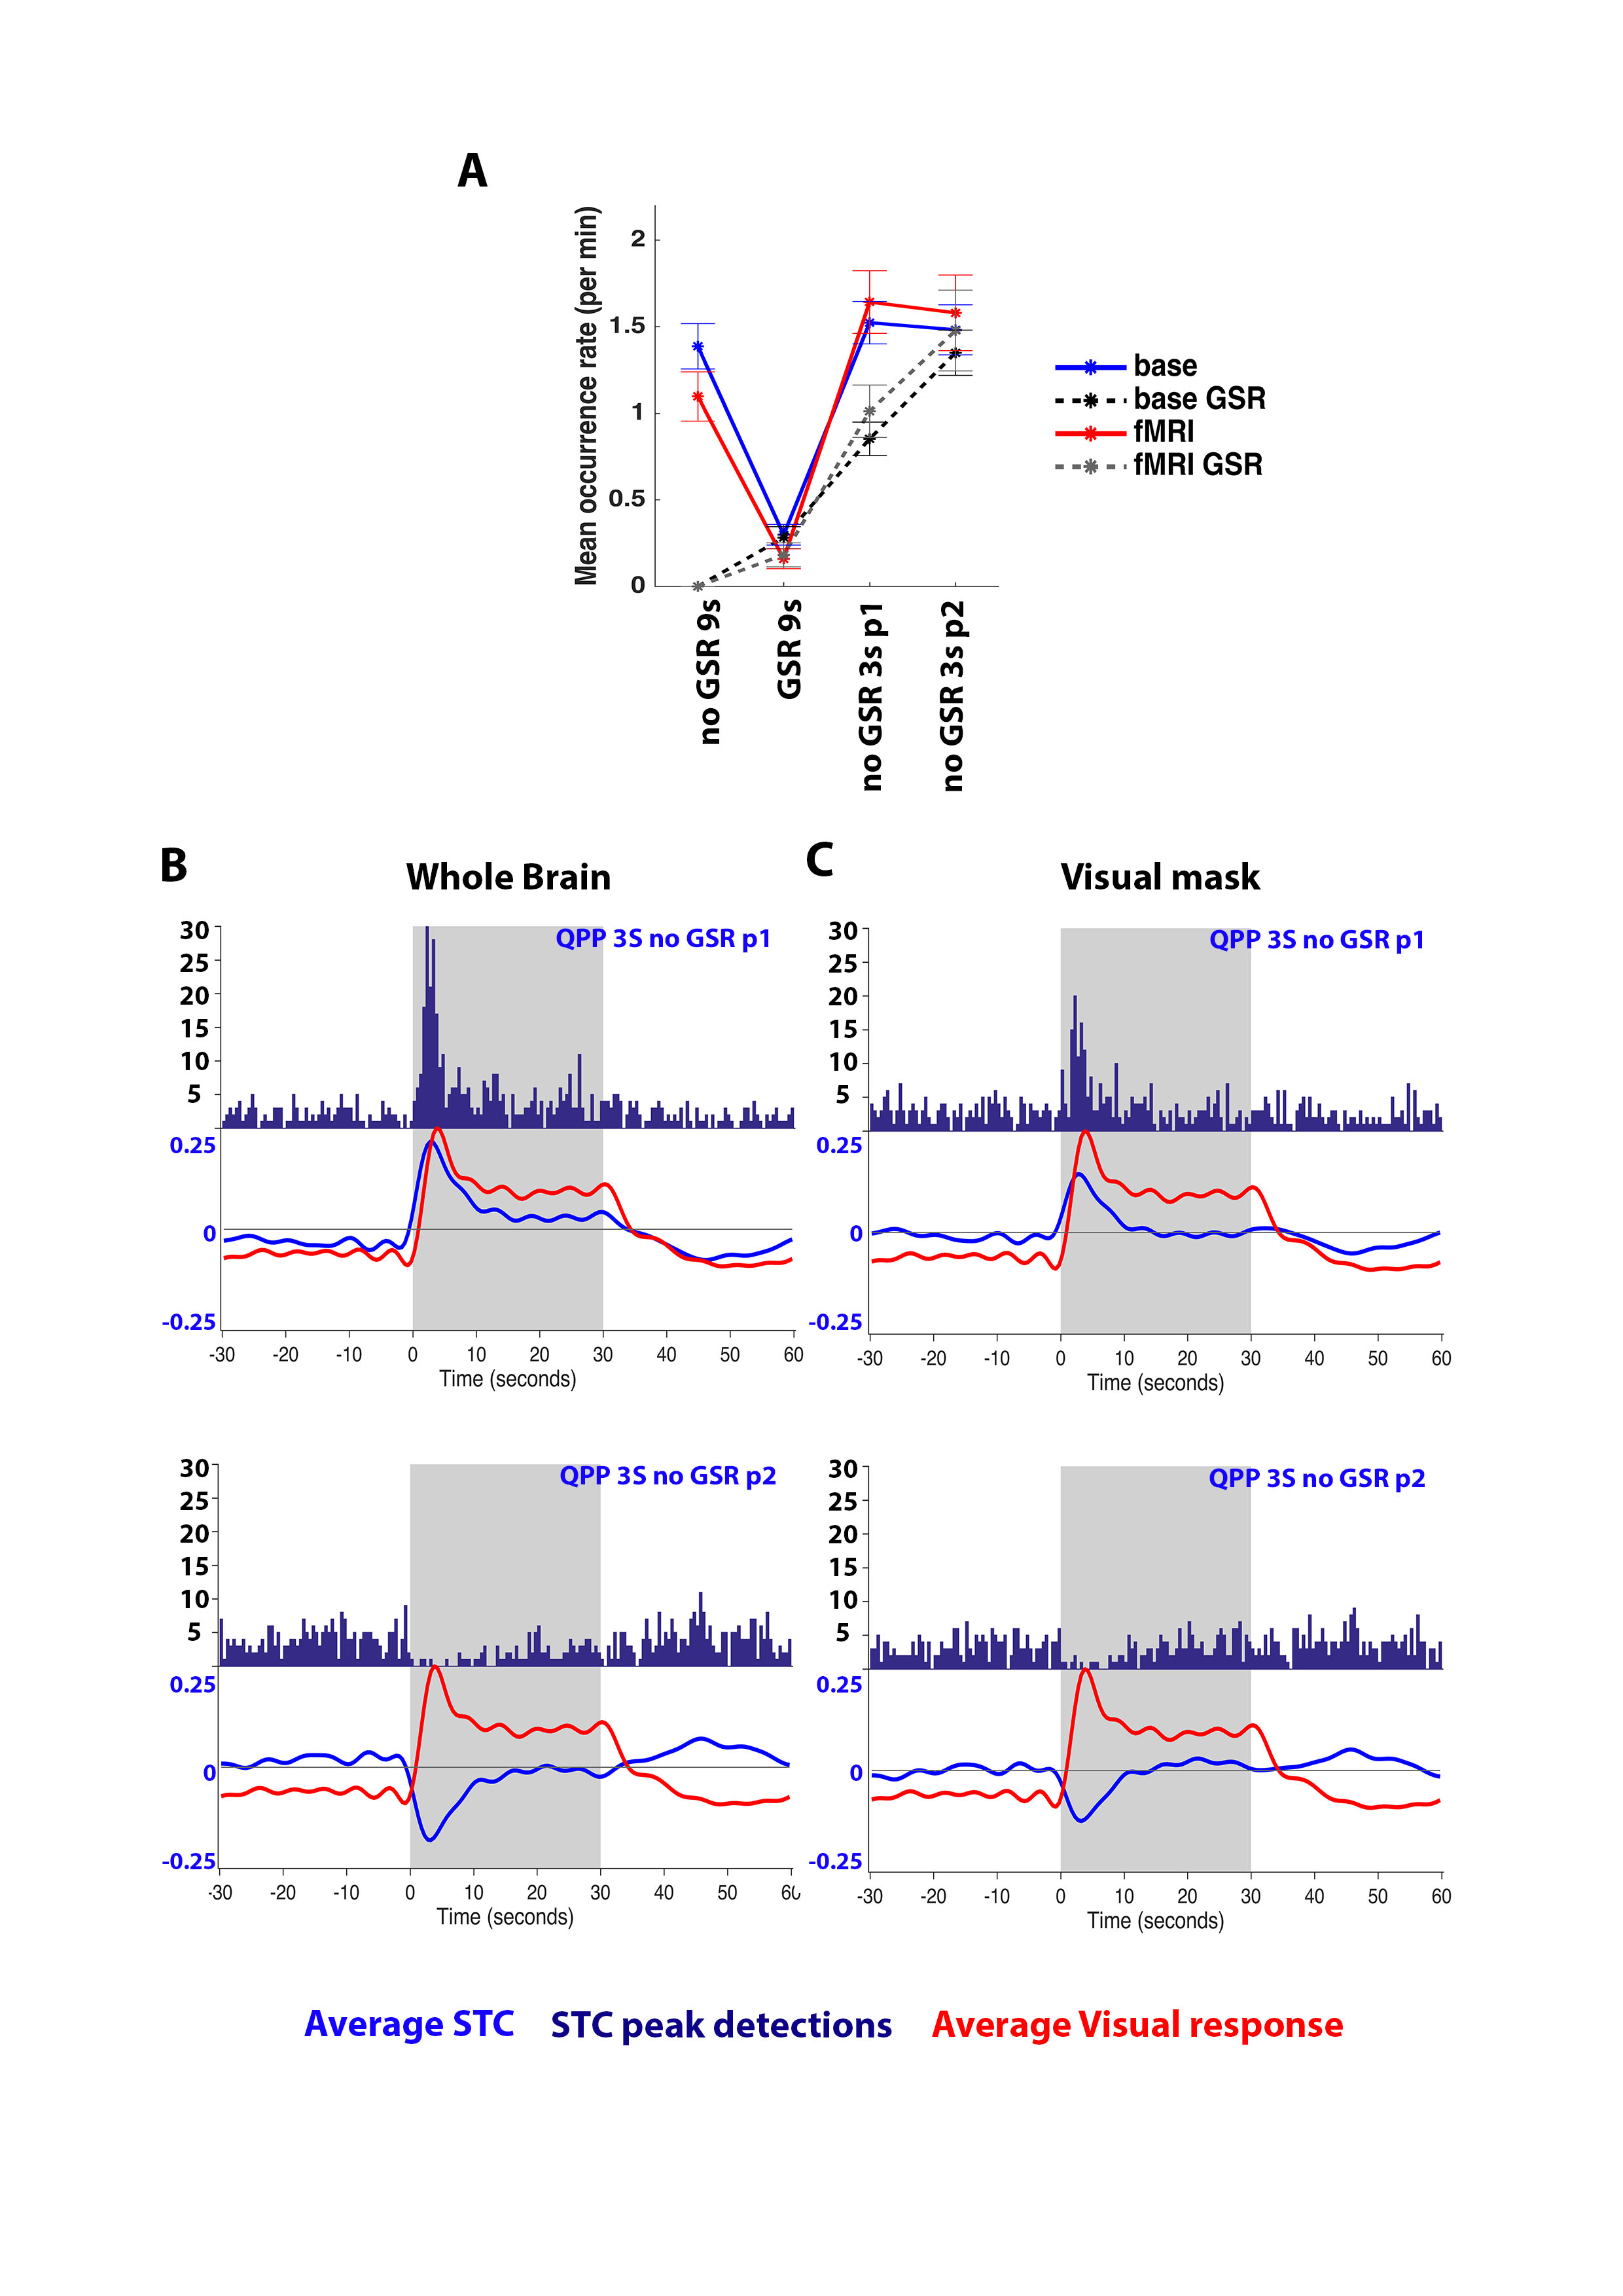
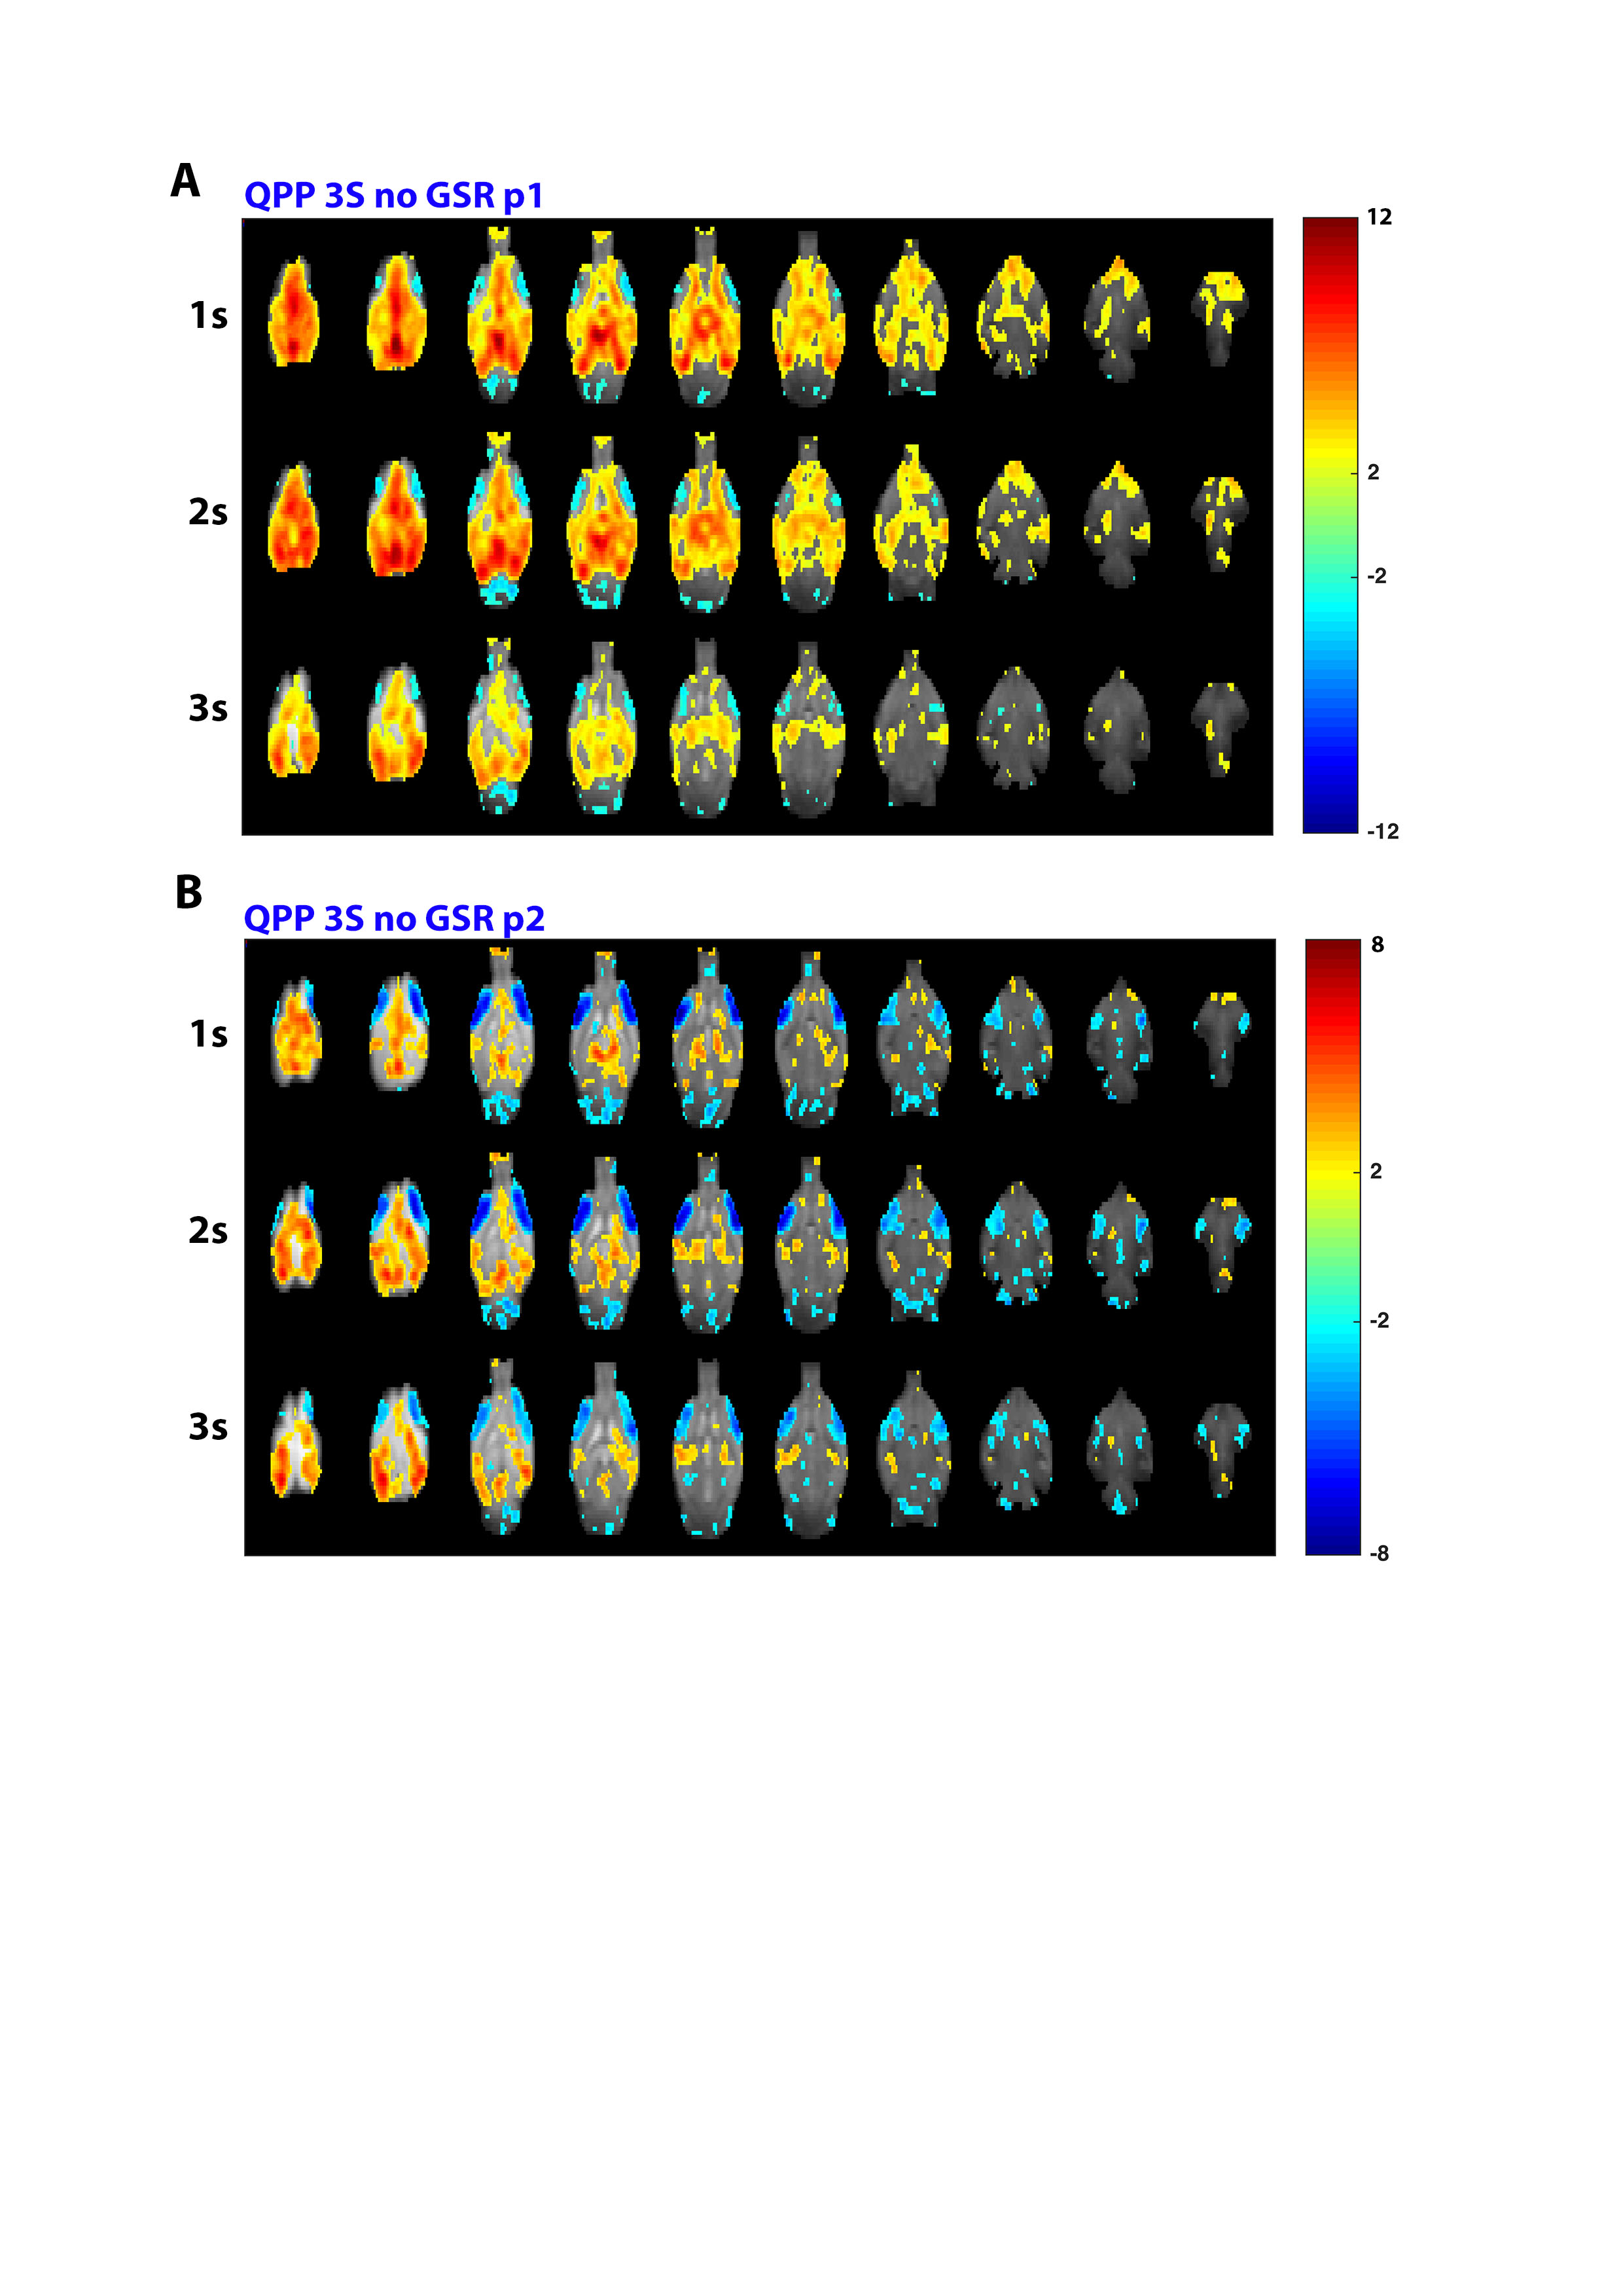
When rsfMRI-derived QPPs were projected onto visual fMRI scans, this showed that detection rates were not significantly altered (Fig.3A). Peri-event time histograms (PETH) of projection STC peaks and average STC time traces illustrate how QPP occurrence could be increased or diminished, depending on the QPP’s phase (Fig.3B). When the visual system was masked out of the brain to calculate STCs, a similar effect was observed, suggesting that activity in visual areas was not solely underlying the observed correlation (Fig.3C). Furthermore, T-value contrast maps between image frames of QPPs detected in the first 7s of visual stimulation versus all images frames in the same period, revealed the significant addition of QPPs on top of overall visual responses (Fig4A-B).
Finally, regression of QPPs illustrated how they can account for a substantial fraction of both the magnitude and variance of visual responses (Fig.5A-B). T-value contrast maps of visual responses before versus after QPP regression confirmed both that QPPs contributed to visual responses and that they were successfully regressed out of the fMRI images (Fig.5C).
Discussion
We describe the first detection of whole brain rodent QPPs, illustrating how global signal like QPPs unveil an underlying coincident dynamic anti-correlation between components of the DMN-like network and the lateral cortical network, which we conjecture might represent a mouse TPN-like network, inspired on similar findings in humans and earlier speculations of its existence in mice2,3,7.
Given the apparent large-scale brain-orchestrating nature of QPPs and their suggested implication in attention and task performance4–6, we investigated their interaction with visual stimulation processing. We showed how QPPs can be modulated by visual stimulation and confirmed that this was not a result of induced correlations. Regressions of QPPs out of the fMRI images revealed that they account for a substantial fraction of visual response magnitude and variance. Their stimulation-induced timing suggests that QPPs might play a role in processing of sensory stimuli.
Acknowledgements
This work was supported, in part, by the ISMRM Research Exchange Program.
This work was further supported by the interdisciplinary PhD grant (ID) BOF DOCPRO 2014 and partially supported by funding received from: the European Union’s Seventh Framework Programme (INMiND) (grant agreement 278850, granted to AVdL), the molecular Imaging of Brain Pathohysiology (BRAINPATH) and the Marie Curie Actions-Industry-Academia Partnerships and Pathways (IAPP) program (grant agreement 612360, granted to AVdL), Flagship ERA-NET (FLAG-ERA) FUSIMICE (grant agreement G.0D7651N), and the Flemish Impulse funding for heavy scientific equipment (granted to AVdL).
References
1. Belloy, M. et al. Dynamic resting state fMRI in mice: detection of Quasi‐Periodic Patterns. Proceeding Int. Soc. Magn. Reson. Med. p.0961. (2017).
2. Yousefi, B., Shin, J., Schumacher, E. H. & Keilholz, S. D. Quasi ‐ Periodic Patterns of Intrinsic Brain Activity in Individuals and their Relationship to Global Signal. Biorvix pre-print. (2017).
3. Majeed, W. et al. Spatiotemporal dynamics of low frequency BOLD fluctuations in rats and humans. Neuroimage 54, 1140–1150 (2011).
4. Abbas, A., Majeed, W., Thompson, G. J. & Keilholz, S. D. Phase of quasiperiodic pattern predicts performance on vigilance task in humans. Proc Int Soc Magn Reson Med 1192 (2016).
5. Monto, S., Palva, S., Voipio, J. & Palva, J. M. Very slow EEG fluctuations predict the dynamics of stimulus detection and oscillation amplitudes in humans. J. Neurosci. 28, 8268–8272 (2008).
6. Fox, M. D., Snyder, A. Z., Vincent, J. L. & Raichle, M. E. Intrinsic Fluctuations within Cortical Systems Account for Intertrial Variability in Human Behavior. Neuron 56, 171–184 (2007).
7. Liska, A., Galbusera, A., Schwarz, A. J. & Gozzi, A. Functional connectivity hubs of the mouse brain. Neuroimage 115, 281–291 (2015).
Figures