1122
Voxel-wise mapping of spontaneous brain network dynamics in the mouse brain1Neural Computation Laboratory, Istituto Italiano di Tecnologia, CNCS@UNITN, Rovereto, Italy, 2CIMEC, University of Trento, Rovereto, Italy, 3Functional Neuroimaging Laboratory, Istituto Italiano di Tecnologia, CNCS@UNITN, Rovereto, Italy
Synopsis
Resting-state fMRI has been widely used to map brain network dynamics via sliding-window correlations between regional functional signals. Using frame-wise clustering of spontaneous BOLD fMRI, here we map the dynamics of brain-wide network activity in the mouse brain with voxel-resolution, at the subject and group level, without the need to use pre-imposed regional parcellation or correlation windows. This approach revealed a reproducible set of recurrent brain states encompassing previously defined functional connectivity networks, which happen at specific phases of global fMRI signal oscillations. Our results provide a novel interpretative framework for the emergence and organization of brain-wide network dynamics.
Introduction
Resting-state fMRI (rsfMRI) is widely used to map macroscale functional network organization via spatial clustering of spontaneous low-frequency fluctuations of BOLD signals1. By using temporally-windowed correlations, numerous studies have reported that brain activity shows recurrent dynamic reconfigurations entailing variations in previously characterized distributed networks of the human brain2. However, major questions about the origin and significance of this phenomenon remain open. For example, it is yet unclear whether this dynamic behavior is stochastic and temporally unstructured or whether it reflects partly regular or oscillatory interactions between brain systems2. Moreover, a fine-grained description of these brain states is lacking, owing to the widespread use of brain-parcellation schemes to reduce data dimensionality in rsfMRI dynamic mapping.
Recent work suggests that coordinated macroscale spontaneous brain activity may be dominated by brief traces of activity at critical time-points, termed “co-activation patterns” (CAPs)3,4. Building on this framework, here we employed selective averaging of whole-brain fMRI time-frames to map brain-wide patterns of spontaneous activity at the voxel-scale in the living mouse brain. We report the presence of robust and reproducible brain states (CAPs) that can be mapped at the group and subject level, and that recapitulate previously described rsfMRI networks. By using a novel common temporal reference determined by global fMRI signal oscillations, we further show that transitions between brain-wide states are characterized by weakly-coupled oscillatory activity entailing gradual assembly and disassembly. Our approach provides a novel interpretative framework for the emergence and organization of brain-wide network dynamics.
Methods
Resting-state fMRI. 40 male C57BI6/J-mice were scanned under shallow halothane anesthesia (0.75%) and artificial ventilation5 on a 7T-MRI scanner using single-shot EPI sequence (TR/TE-1200/15ms, flip-angle 30°, FOV 2×2 cm2, matrix 100×100, thickness 0.5 mm, 500-volumes). Data was pre-processed as previously described6.
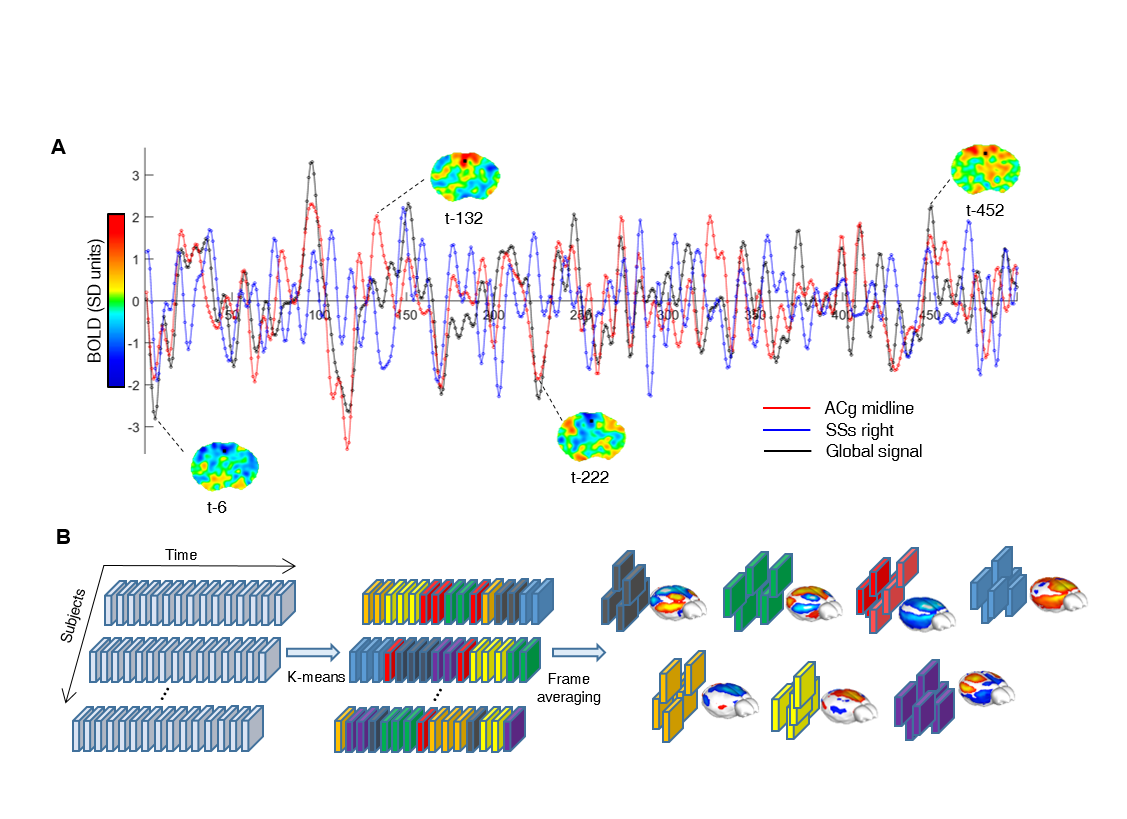
Data analysis. We employed a clustering analysis to identify BOLD fMRI frames exhibiting congruent patterns of spontaneous BOLD-activity (CAPs). Concatenated frames were clustered according to their spatial-similarity using k-means++7 using 500 iterations and k=4:12. We incrementally assessed each solution, based on reproducibility of the identified clusters in an independent dataset (41 subjects, 500)8. We chose k=7 as the most reproducible and stable solution across datasets.
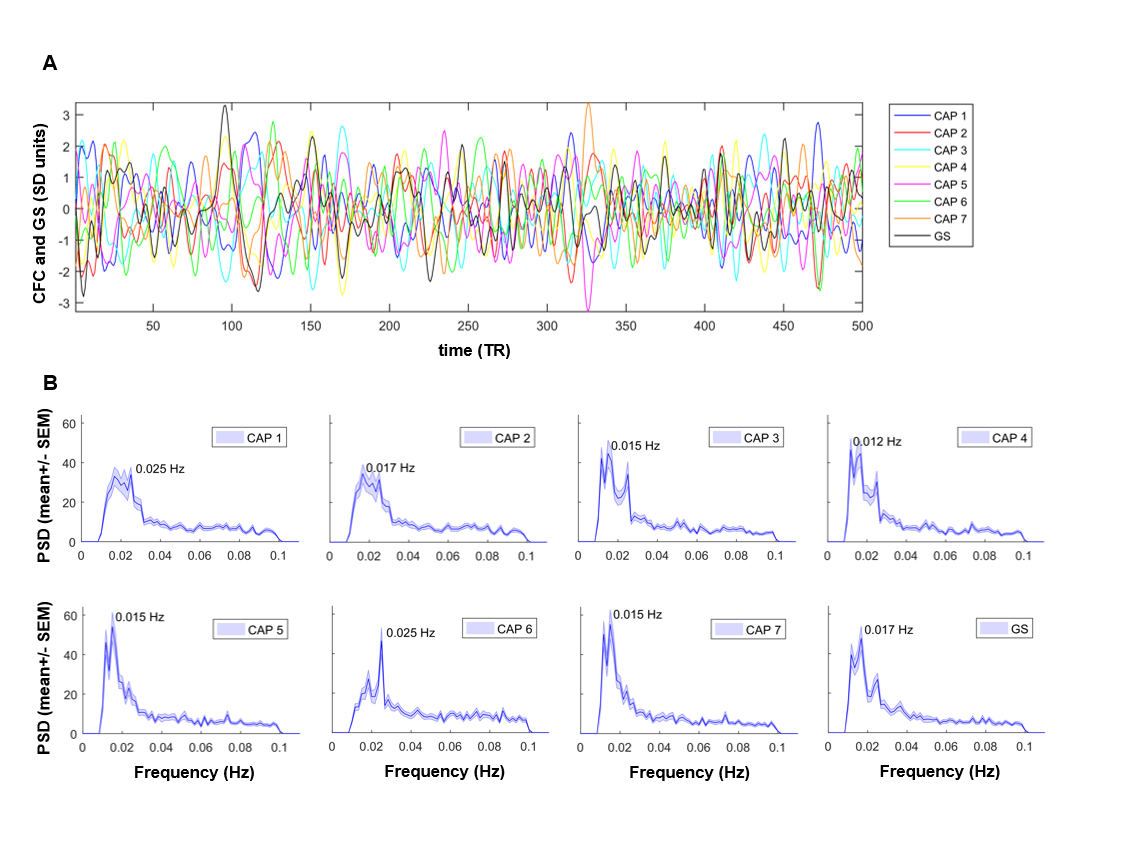
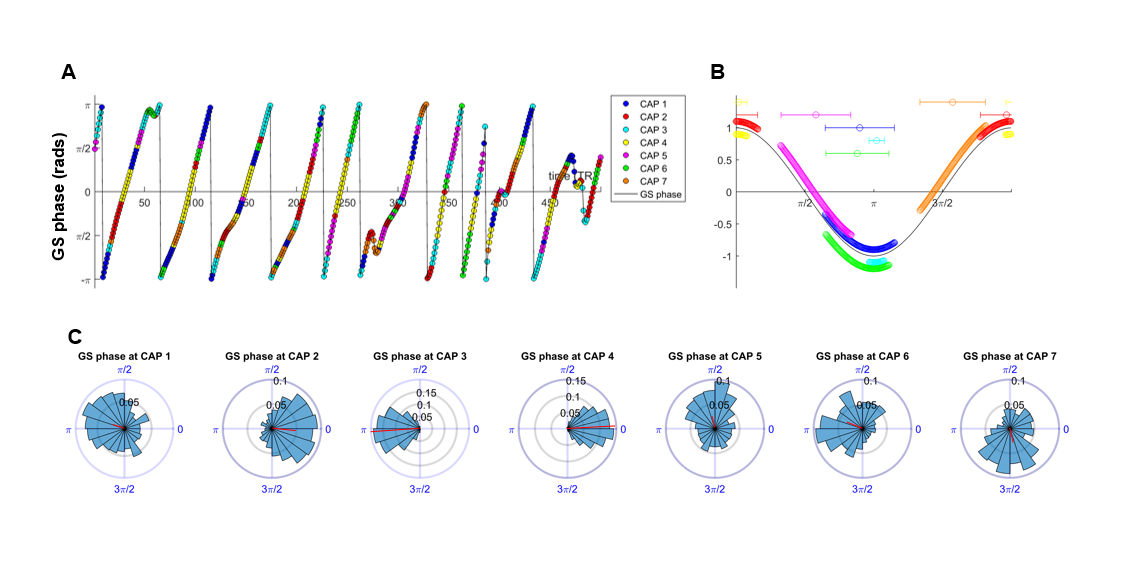
CAP dynamics. For each CAP template (mean BOLD-map), we computed its spatial correlation with each fMRI-frame to obtain CAP-to-frame correlations (CFC) time-series for each subject. We next computed the power-spectrum of these correlations. CAP occurrence within GS oscillations were assessed by computing the GS’s instantaneous phase with the Hilbert-Transform9 and used circular statistics to measure the probability distribution of GS-phases at each CAP’s occurrence10.
Results and Discussion
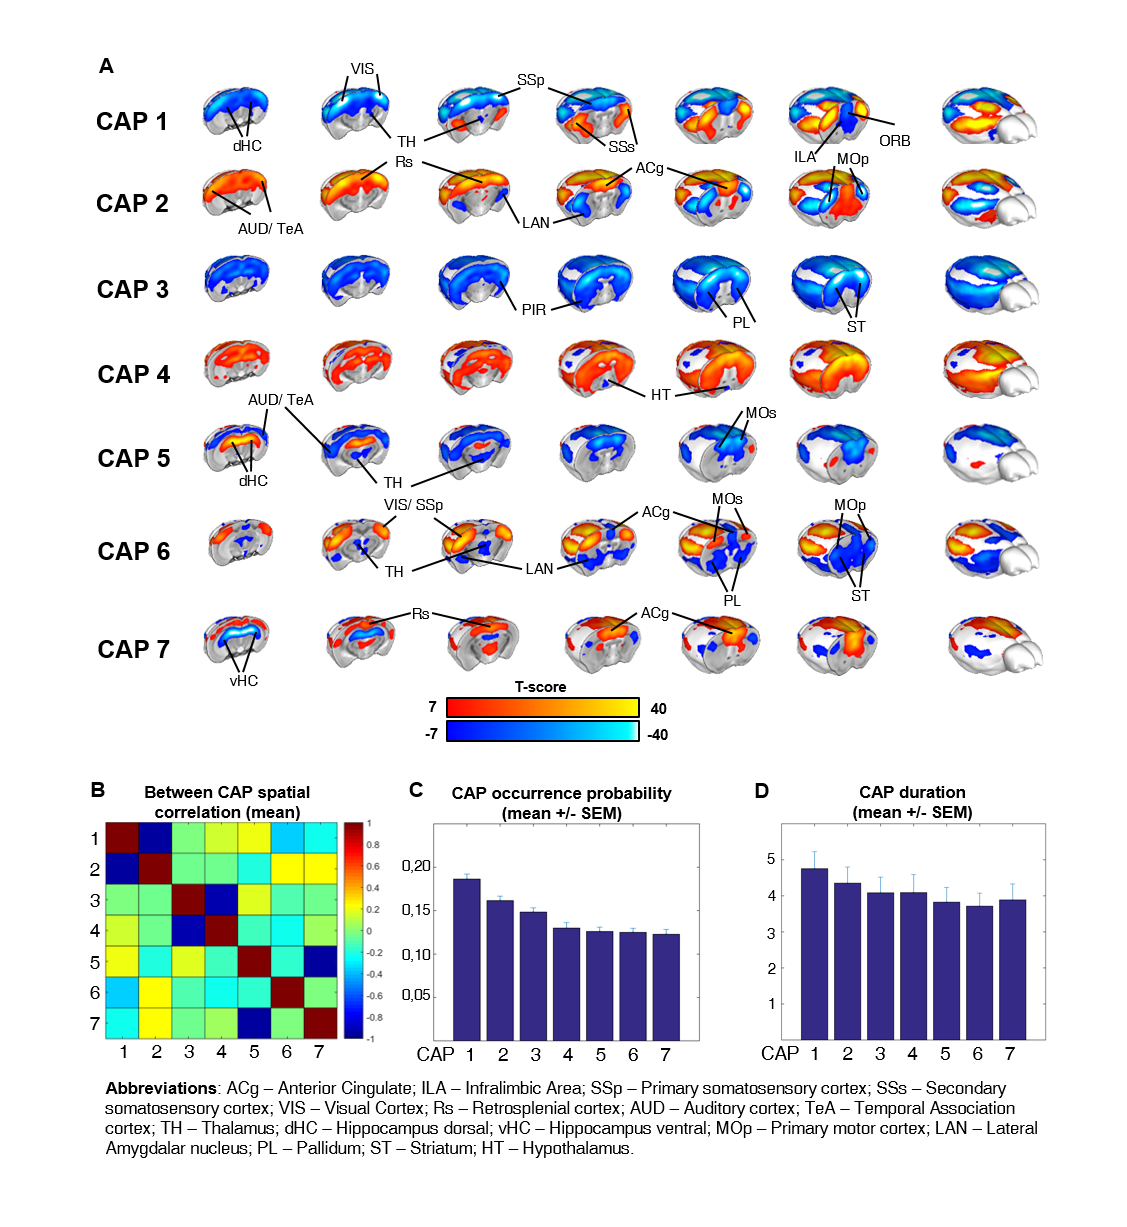
To identify the presence of reproducible macro-scale brain functional states, we identified clusters of spatially-congruent rsfMRI-frames using a k-means algorithm (Fig. 1). The approach led to the identification of seven stable states encompassing large cortical and sub-cortical districts (Fig. 2). The identified CAPs recapitulate combinations of previously described functional connectivity networks of the mouse brain5,8, including higher-order cortical regions (default-mode) as well as motor- sensory, hippocampal and sub-cortical networks (Fig. 2). All the CAPs were also reliably identified at the subject level when using extended fMRI time-series (> 60 min).
Notably, six of the seven identified states could be classified into CAP and anti-CAP pairs characterized by opposing patterns of BOLD activity. Inverse co-occurrence of default-mode and lateral cortical network activity was especially prominent, highlighting periods of competing relationship between these two functional networks. The observation of states and anti-states suggests the presence of macroscale oscillatory dynamics, which was confirmed by spectral analysis (Fig. 3). To probe this hypothesis, we mapped CAP evolution dynamics. We found that all CAPs are characterized by gradual assembly/disassembly, and exhibit clear oscillatory behavior. Anti-correlation was prominent between CAPs and their corresponding anti-CAPs (Fig. 3). We next expressed CAP activity with respect to the fMRI global signal (GS), which we selected as putative reference “clock” for macroscale oscillatory dynamics. This analysis revealed clear and significant phase-locking of these states to GS oscillations (Fig. 4).
Conclusions
In conclusion, we describe an approach for mapping recurrent brain states in the mouse brain with voxel-wise resolution, without the need to use pre-imposed regional parcellations, or correlation windows. Our findings reveal that brain-wide functional states of the mouse brain encompass previously defined connectivity networks, and are characterized by weakly-coupled oscillatory activity. These results provide a novel interpretative framework for the emergence and organization of brain-wide network dynamics.Acknowledgements
A.G. acknowledges funding from the Simons Foundation (SFARI 314688 and 400101, A.G.) and Brain and Behavior Foundation (2017 NARSAD independent Investigator Grant).References
1. Hutchison, R. M., Womelsdorf, T., Gati, J. S., Everling, S. & Menon, R. S. Resting-state networks show dynamic functional connectivity in awake humans and anesthetized macaques. Hum. Brain Mapp. 34, 2154–2177 (2013).
2. Hutchison, R. M. et al. Dynamic functional connectivity: Promise, issues, and interpretations. Neuroimage 80, 360–378 (2013).
3. Liu, X. & Duyn, J. H. H. Time-varying functional network information extracted from brief instances of spontaneous brain activity. Proc. Natl. Acad. Sci. 110, 4392–4397 (2013).
4. Liang, Z., Liu, X. & Zhang, N. Dynamic resting state functional connectivity in awake and anesthetized rodents. Neuroimage 104, 89–99 (2015).
5. Sforazzini, F., Schwarz, A. J., Galbusera, A., Bifone, A. & Gozzi, A. Distributed BOLD and CBV-weighted resting-state networks in the mouse brain. Neuroimage 87, 403–415 (2014).
6. Liska, A. et al. Homozygous Loss of Autism-Risk Gene CNTNAP2 Results in Reduced Local and Long-Range Prefrontal Functional Connectivity. Cereb. Cortex 1–13 (2017). doi:10.1093/cercor/bhx022
7. Arthur, D. & Vassilvitskii, S. K-Means++: the Advantages of Careful Seeding. Proc. eighteenth Annu. ACM-SIAM Symp. Discret. algorithms 1027–1025 (2007). doi:10.1145/1283383.1283494
8. Liska, A., Galbusera, A., Schwarz, A. J. & Gozzi, A. Functional connectivity hubs of the mouse brain. Neuroimage 115, 281–291 (2015).
9. Montemurro, M. A., Rasch, M. J., Murayama, Y., Logothetis, N. K. & Panzeri, S. Phase-of-Firing Coding of Natural Visual Stimuli in Primary Visual Cortex. Curr. Biol. 18, 375–380 (2008).
10. Eschenko, O., Magri, C., Panzeri, S. & Sara, S. J. Noradrenergic neurons of the locus coeruleus are phase locked to cortical up-down states during sleep. Cereb. Cortex 22, 426–435 (2012).
Figures