1121
Orthonasal versus retronasal glomerular activity in rat olfactory bulb by fMRIBasavaraju G Sanganahalli1,2,3, Garth J Thompson1,2, Peter Herman1,2,3, Gordon M Shepherd4, Justus V Verhagen5, and Fahmeed Hyder1,2,3,6
1Radiology and Biomedical Imaging, Yale University, New Haven, CT, United States, 2Magnetic Resonance Research Center (MRRC), Yale University, New Haven, CT, United States, 3Quantitative Neuroscience with Magnetic Resonance (QNMR) Core Center, Yale University, New Haven, CT, United States, 4Neuroscience, Yale University, New Haven, CT, United States, 5The John B. Pierce Laboratory, Yale University, New Haven, CT, United States, 6Biomedical Engineering, Yale University, New Haven, CT, United States
Synopsis
Animals perceive their olfactory environment not only from odors originating in the external world (orthonasal route), but also from odors released in the oral cavity while eating food (retronasal route). We delivered odorants via the orthonasal and retronasal routes and measured whole olfactory bulb (OB) glomerular activity responses by fMRI. Our fMRI BOLD activation maps from the whole OB revealed gross spatial activation patterns that are largely independent of stimulus route, except for lower efficacy of retronasal stimuli as compared to orthonasal stimuli. This different encoding likely alters the odor perception for food vs. smelling.
INTRODUCTION
Odorants can reach the
olfactory receptor neurons (ORNs) by two routes: orthonasally, when volatiles
enter the nasal cavity during inhalation/sniffing; and retronasally, when food
volatiles released in the mouth pass into the nasal cavity during
exhalation/eating. Previous work in humans has shown that orthonasal and
retronasal delivery of the same odorant can evoke distinct perceptions and
patterns of neural response1. Recent studies using optical calcium
imaging in rats were restricted only to dorsal part of the OB2.There
is need for a methodical study of glomerular activity patterns of the entire OB
evoked by both orthonasal and retronasal stimulation. In this study, using fMRI
of entire OB the responses to two similar food odorants, we tested the
hypothesis that distinct spatiotemporal glomerular activity patterns exist for
orthonasal versus retronasal routes of the same odorant.METHODS
Adult male Sprague-Dawley rats (n=12,) weighing 250–300 g were used. Rats were anesthetized with urethane (1.5 g/kg intraperitoneal). Odors were delivered orthonasally and retronasaly through a custom-built olfactometer with TTL-controlled solenoid valves (Cole-Parmer, Vernon Hills, IL), synchronized with an MRI acquisition computer3, 4. All fMRI data were obtained on a modified 9.4T Bruker horizontal-bore spectrometer (Billerica, MA) using a 1H resonator/surface coil RF probe4, 5, 6.RESULTS
The process of converting 3D MRI data to a flatmap of the glomerular sheet (GS) is shown in Figure 1. The relative change in fMRI BOLD activation maps in the entire GS for methyl valerate (MV) and ethyl butyrate (EB) odors during orthonasal and retronasal stimulation are shown in Figure 2. We observed reproducible spatio-temporal fMRI activation maps in the GS of the entire OB during both orthonasal and retronasal stimuli. As expected, retronasal stimuli required higher odor concentration (40%) as compared to orthonasal (20 %) to obtain reproducible fMRI BOLD spatio-temporal activation. Figure 3 compares activation over time in regions of the left and right OB’s GS which have >0% mean activation during stimulation, for the MV and EB odors during orthonasal and retronasal stimulation (averaged across six rats in each case). The mean ± SD of BOLD signal changes for MV and EB during orthonasal vs. retronasal are as follows: Ortho-MV; 3.8 ± 1.17 %, Ortho-EB; 3.51 ± 1.52 %, Retro-MV; 3.47 ± 1.07 %,and Retro-EB; 3.74 ± 1.61 %, respectively. No statistically significant differences between odors and across methods were observed. Although we did not find differences in the BOLD signal amplitude, there were significant differences in the temporal delay and shape of the BOLD response curve. Retronasal BOLD time courses show slower temporal dynamics than orthonasal responses. We next compared the similarity and dominance maps for retronasal and orthonasal stimulations (Figure.4).DISCUSSION
We investigated the effect of odor route on both spatial and temporal glomerular response patterns in the entire GS of the rat OB by fMRI. These results revealed gross spatial activation patterns are largely independent of stimulus route except that we do require more concentration of odors during retronasal stimuli as compared to orthonasal stimuli. Although previous study using optical calcium imaging found that at a physiologically relevant flow rate, retronasal odorants can effectively reach the olfactory receptor neurons, eliciting glomerular response patterns that grossly overlap with those of orthonasal responses, but differ from the orthonasal patterns in the response amplitude and temporal dynamics2. But those studies were optically limited to the dorsal OB. fMRI BOLD time courses showed that retronasal responses generally have a longer latency to onset and peak than orthonasal responses. Not only are retronasal fMRI BOLD responses slower to start, but also take more time to reach their peak level relative to this response onset (Figure 3B). Reported temporal analysis of odorant-evoked (orthonasal) input to the dorsal OB in rodents indicate that odorants can evoke diverse temporal patterns across activated glomeruli in an odorant-specific manner8, 9. Orthonasal and retronasal fMRI BOLD response patterns in majority shows large overlap as well as some dominance (Figure 4). Orthonasal maps were more located in dorsal-medial regions, whereas retronasal maps were more located in caudal and lateral regions.CONCLUSION
These results establish the relationships between orthonasal and retronasal odor representation of the rat whole OB. This different encoding likely alters the odor perception for food during ingestion vs. during sniffing. Future experiments measuring OB and more caudal brain simultaneously may reveal how olfactory and other brain regions (like somatosensory cortex) integrate this information. These studies have important consequences for understanding the perception and neural encoding of food flavor, which is important for feeding behavior and health.Acknowledgements
Authors thank Bei Wang for her help in animal preparation for fMRI. Funding for this research included NIH grants (R01 DC-011286, R01 MH-067528, P30 NS-052519).References
- Small DM, Gerber JC, Mak YE, Hummel T. Differential neural responses evoked by orthonasal versus retronasal odorant perception in humans. Neuron.2005;47(4):593–605
- Gautam SH, Verhagen JV. Retronasal odor representations in the dorsal olfactory bulb of rats.J Neurosci. 2012;32(23): 7949-59.
- Sanganahalli BG, Bailey CJ, Herman P, Hyder F. Tactile and non-tactile sensory paradigms for fMRI and neurophysiologic studies in rodents. Methods Mol Biol. 2009;489:213-42.
- Sanganahalli BG, Rebello MR, Herman P, Papademetris X, Shepherd GM, Verhagen JV, Hyder F. Comparison of glomerular activity patterns by fMRI and wide-field calcium imaging: Implications for principles underlying odor mapping. Neuroimage. 2016;126:208-18.
- Schafer JR, Kida I, Xu F, Rothman DL, Hyder F. Reproducibility of odor maps by fMRI in rodents. Neuroimage. 2006;31(3):1238-46.
- Xu F, Kida I, Hyder F, Shulman RG. Assessment and discrimination of odor stimuli in rat olfactory bulb by dynamic functional MRI.Proc Natl Acad Sci U S A. 2000;97(19):10601-6.
- Liu N, Xu F, Marenco L, Hyder F, Miller P, Shepherd GM. Informatics approaches to functional MRI odor mapping of the rodent olfactory bulb: OdorMapBuilder and OdorMapDB. Neuroinformatics. 2004;2(1):3-18.
- Spors H, Wachowiak M, Cohen LB, Friedrich RW. Temporal dynamics and latency patterns of receptor neuron input to the olfactory bulb. J Neurosci 2006;26(4):1247–1259
- Junek S, Kludt E, Wolf F, Schild D. Olfactory coding with patterns of response latencies. Neuron 2010;67(5):872–884.
Figures
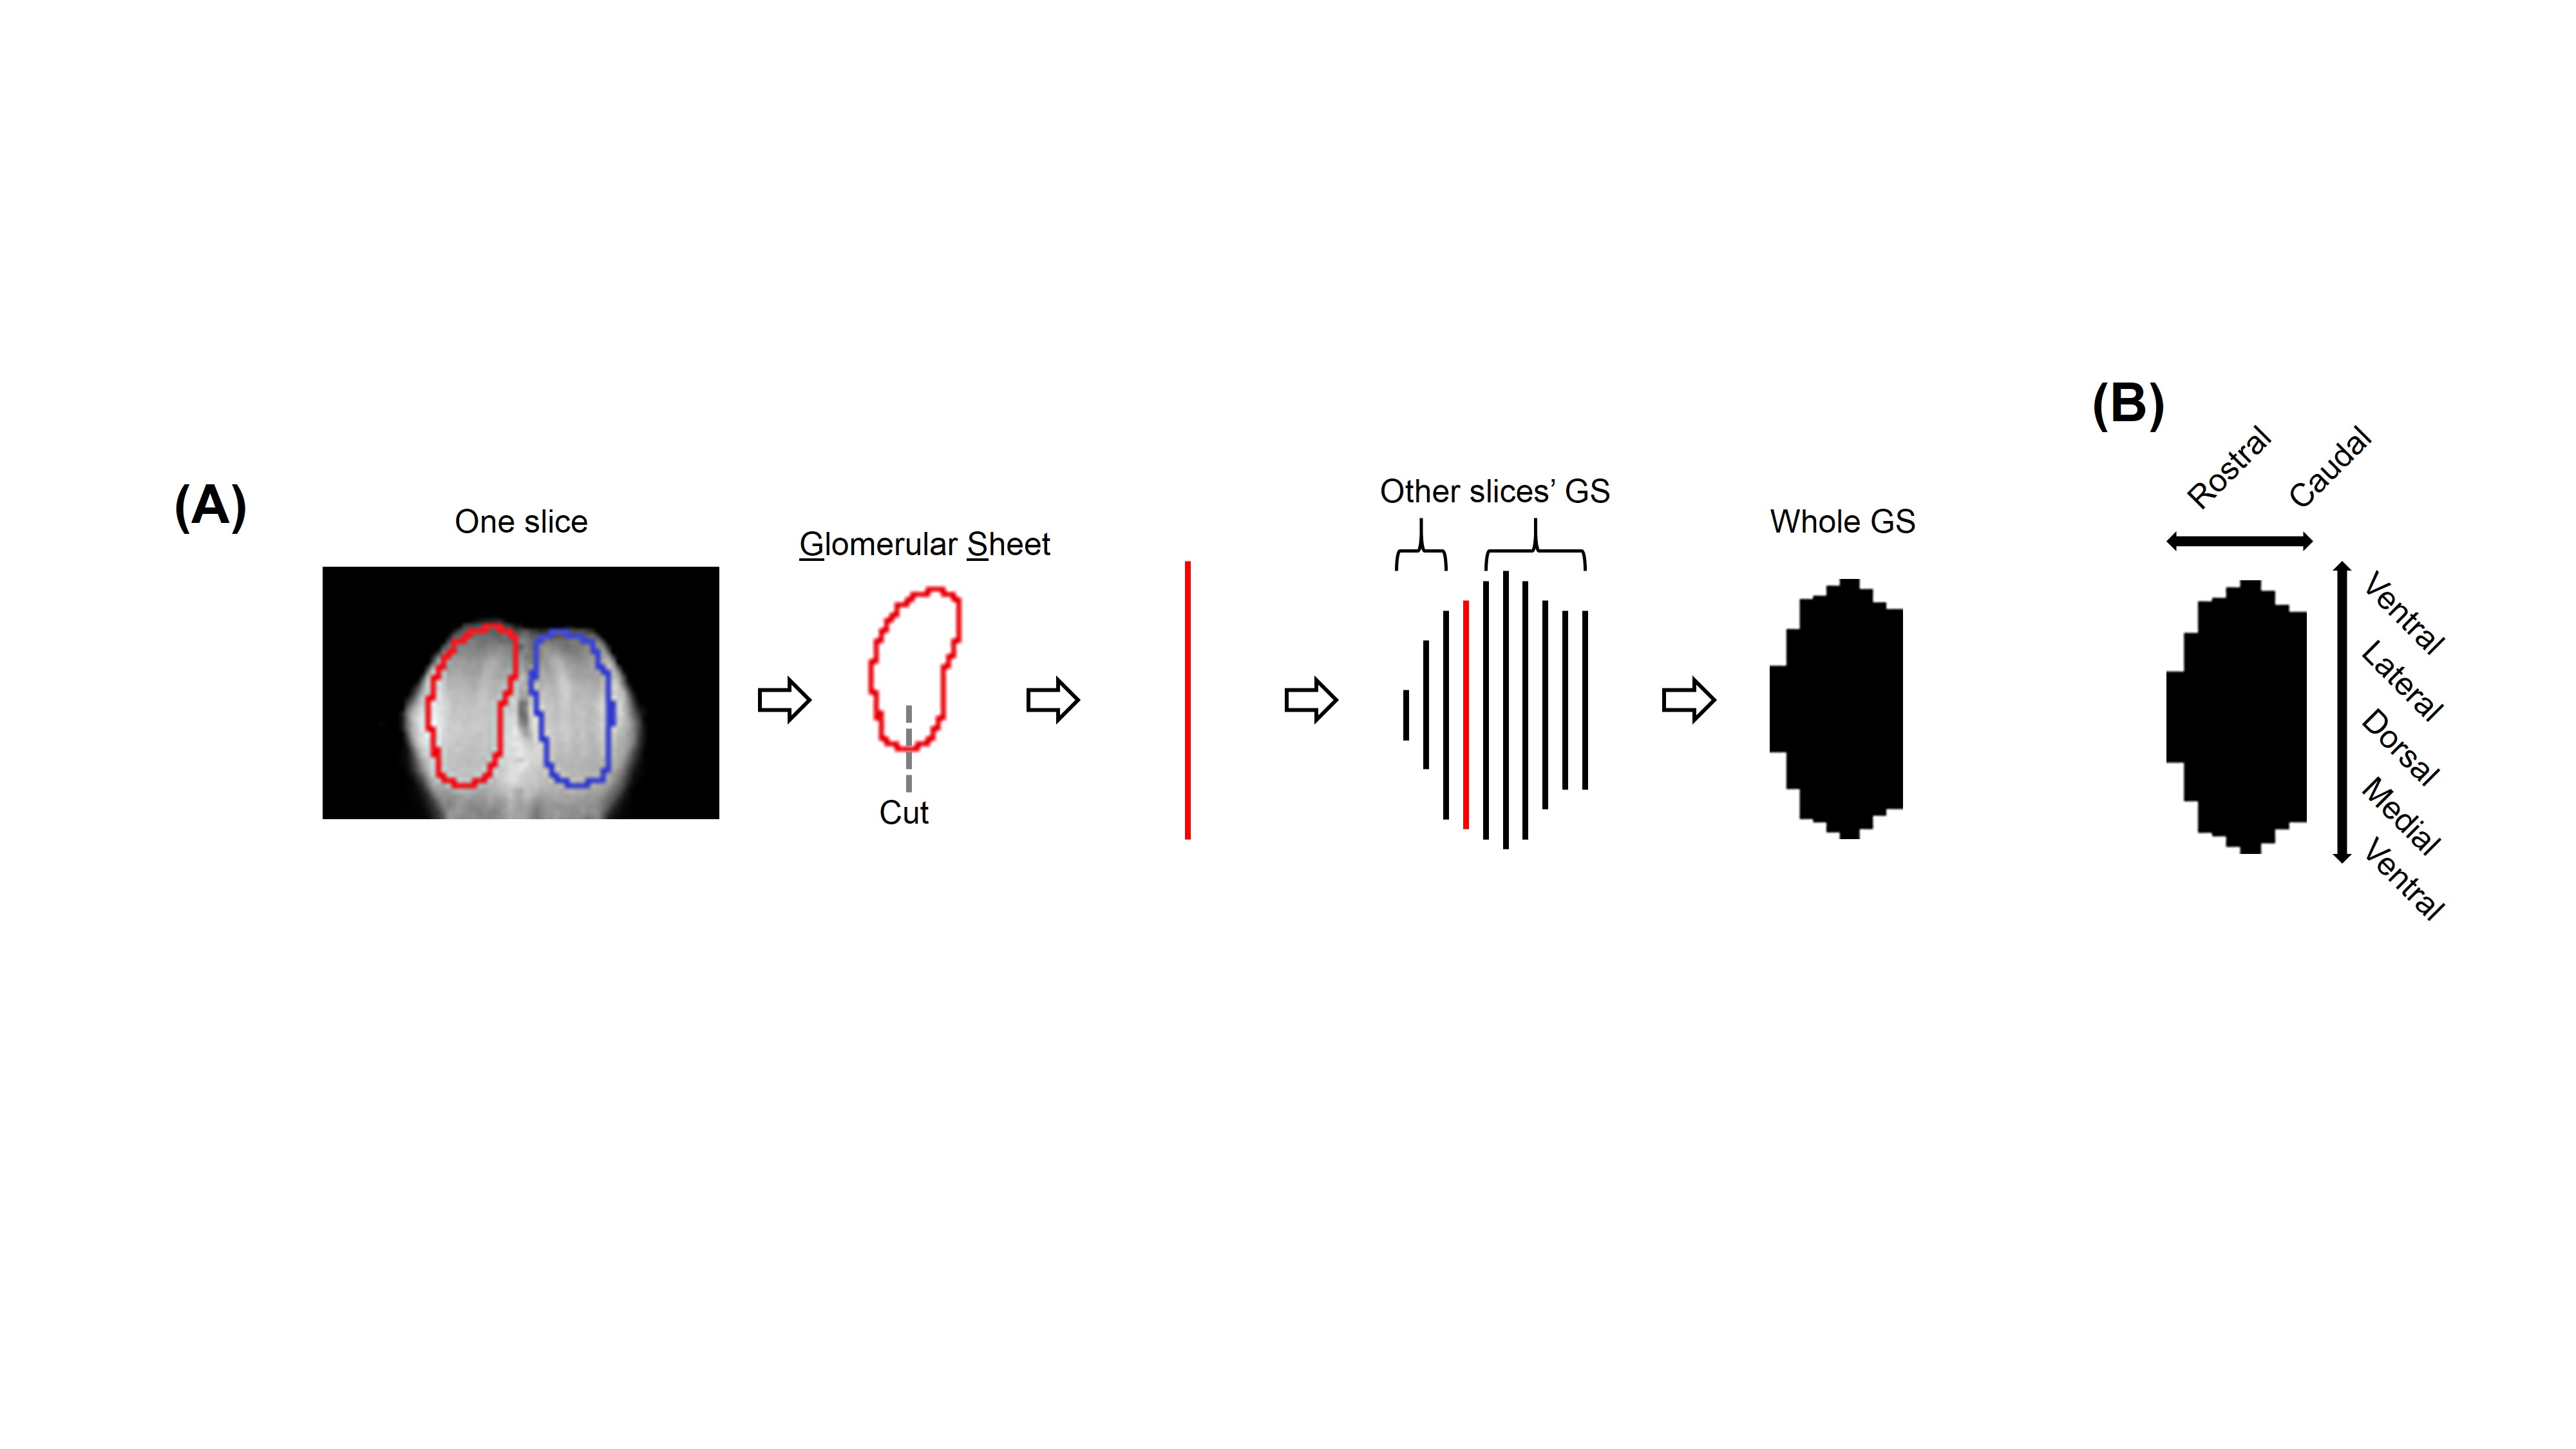
(A)
Process of converting 3D MRI data to a flatmap of the glomerular sheet (GS).
The glomerular layer is traced on each slice, the trace is cut at the bottom
and flattened to a row, and then all such rows are combined to form the
flatmap. (B) Orientation of each
flatmap. To convert the glomerular sheet from a mask within 3D MRI data to a 2D
image, a custom function was written to extract “flatmaps,” images of flattened
layers in the OB. This function was inspired by OdorMapBuilder7, but
is highly simplified.
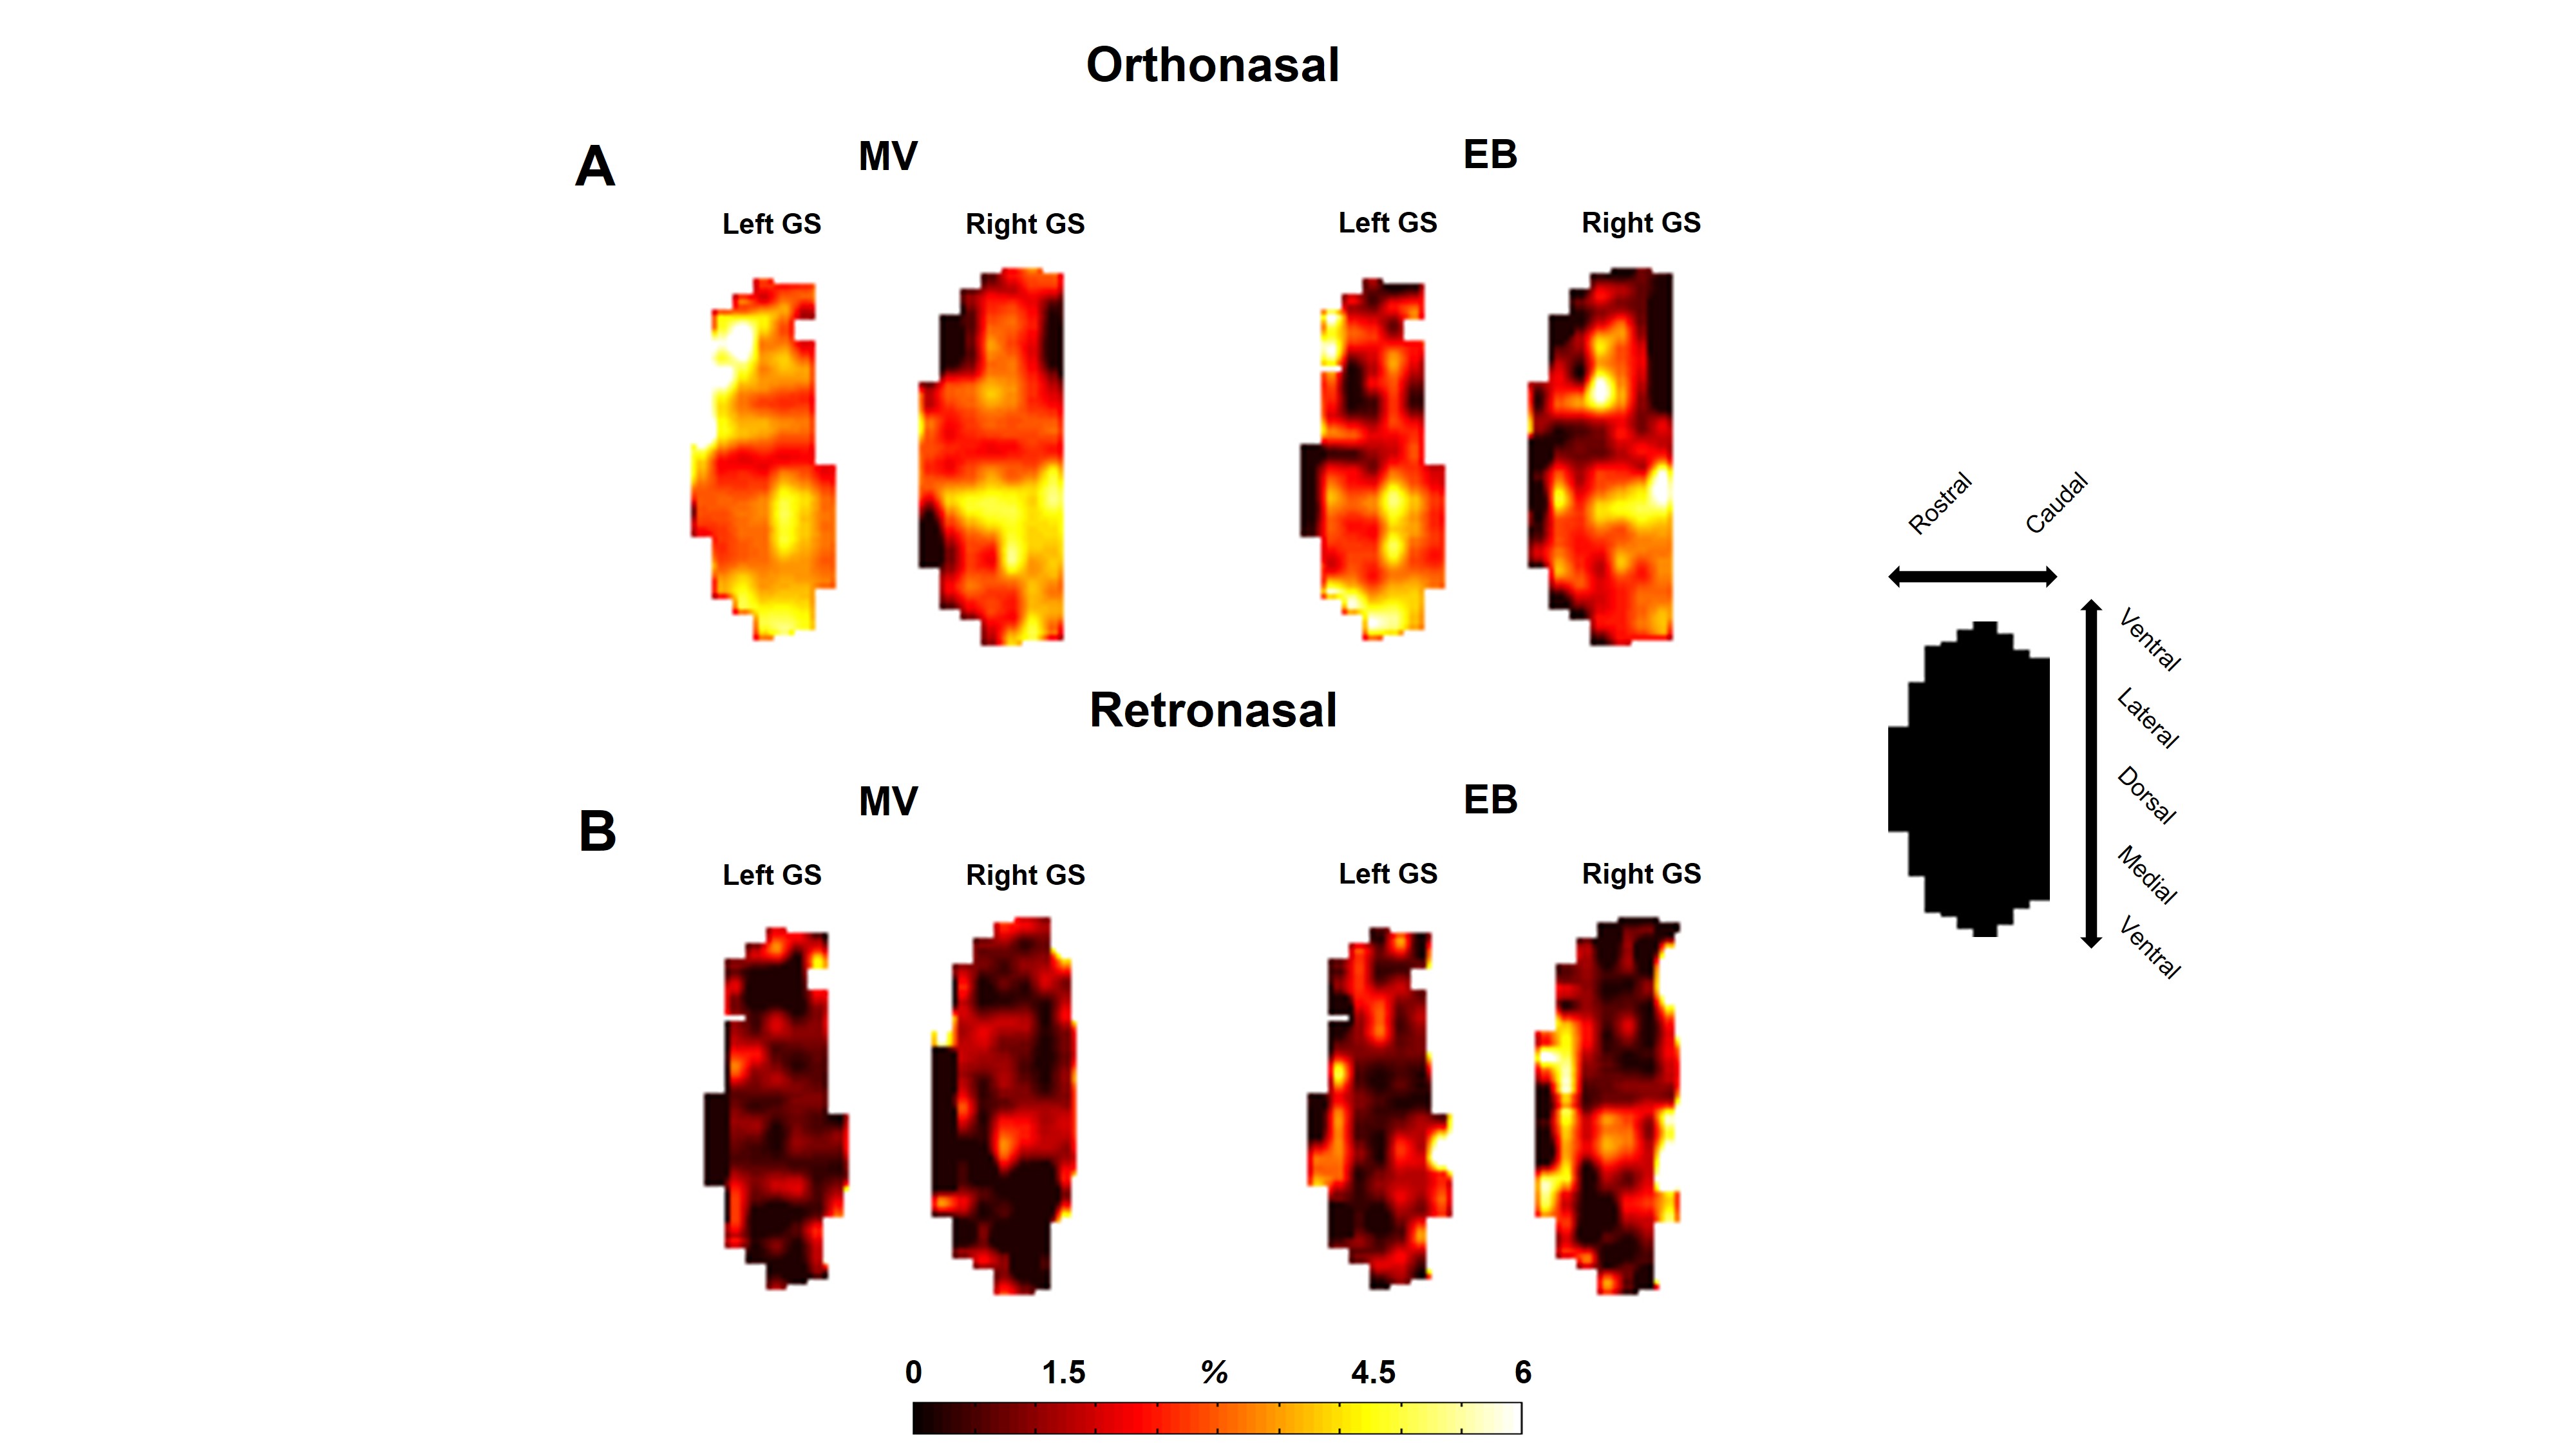
(A)
Glomerular sheet (GS) activation for methyl valerate (MV) and ethyl butyrate
(EB) odor during orthonasal stimulation. Percentage change in fMRI BOLD
activation maps was calculated between rest (60s) versus odor stimulation (60s)
(B) As A, except retronasal stimulation. While all odors are similar
(all are esters, fruit-like odors), there are slight differences in the
activation patterns between them. Odor concentration were different for ortho
(20 %) versus (40 %) retro stimulation. Orientation of each flat map is shown
separately on the right side.
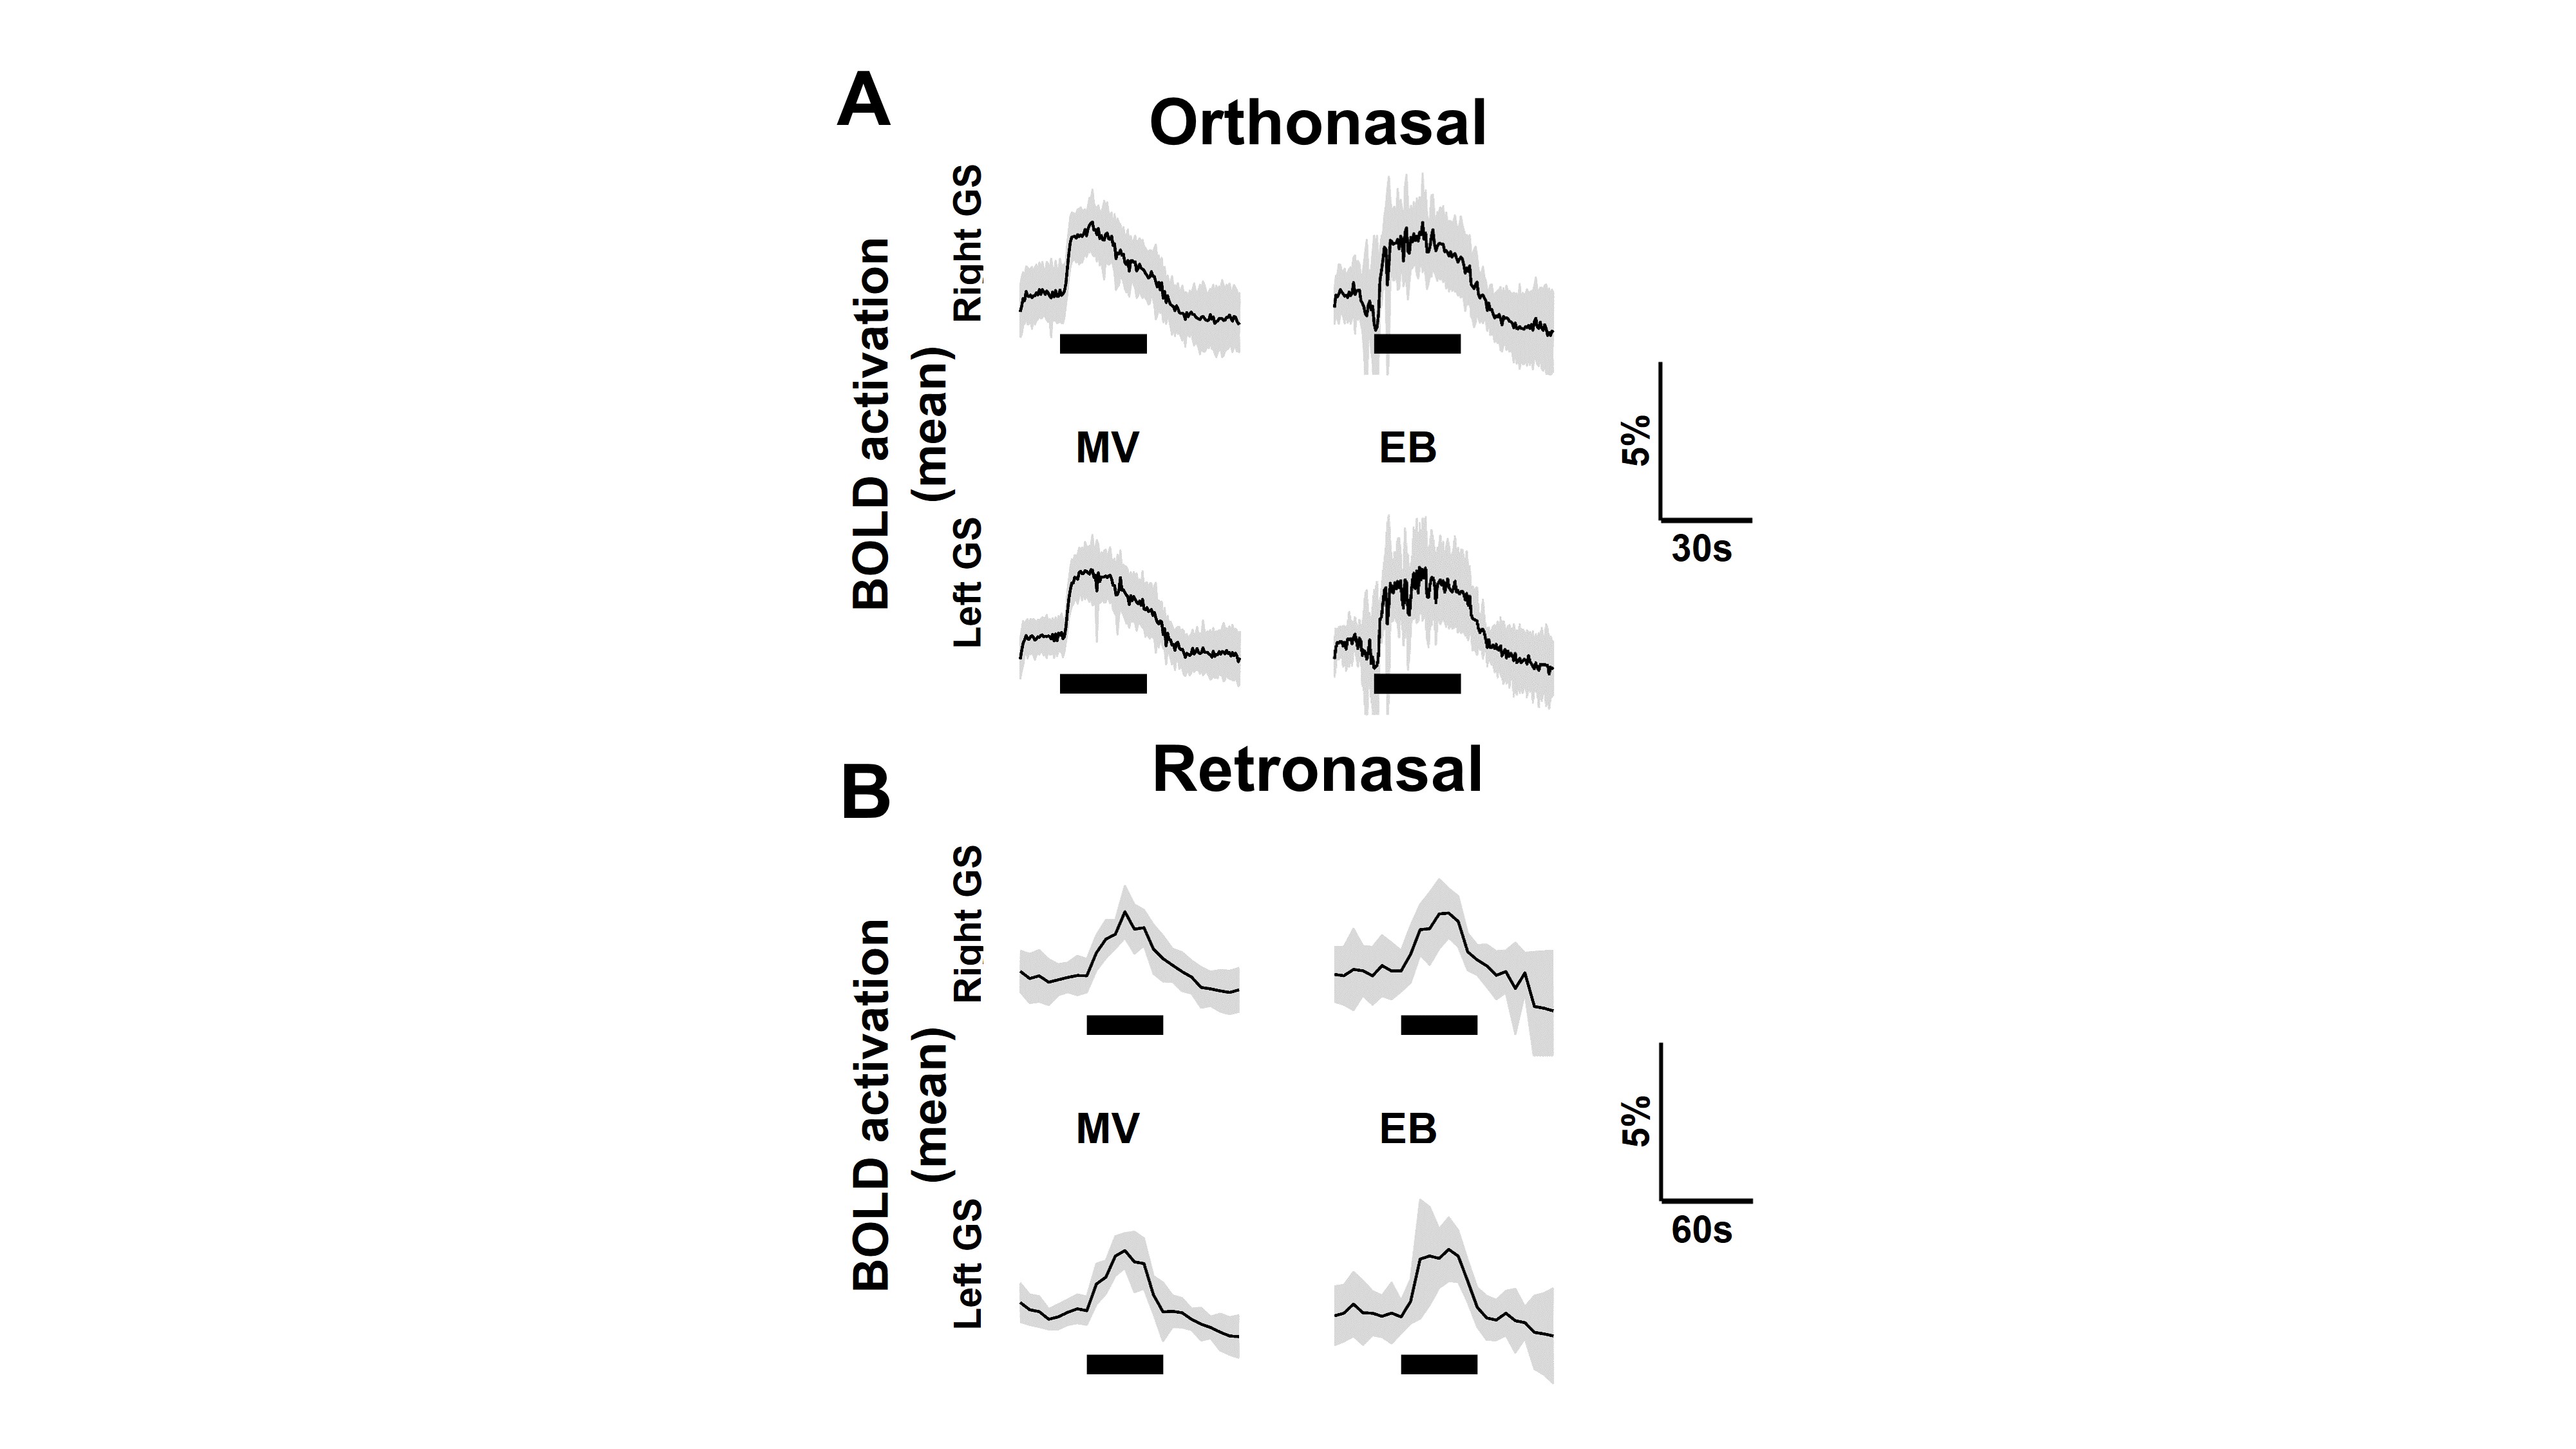
Activation over time in regions of the left and right olfactory bulb’s glomerular
sheet which have >0% mean activation during orthonasal (A) and retronasal (B) stimulation,
for the methyl valerate (MV) and ethyl butyrate (EB) odors during orthonasal
stimulation. Thin black line is mean of all trials, gray shading ±1 S.D., thick
black line is time of stimulation.
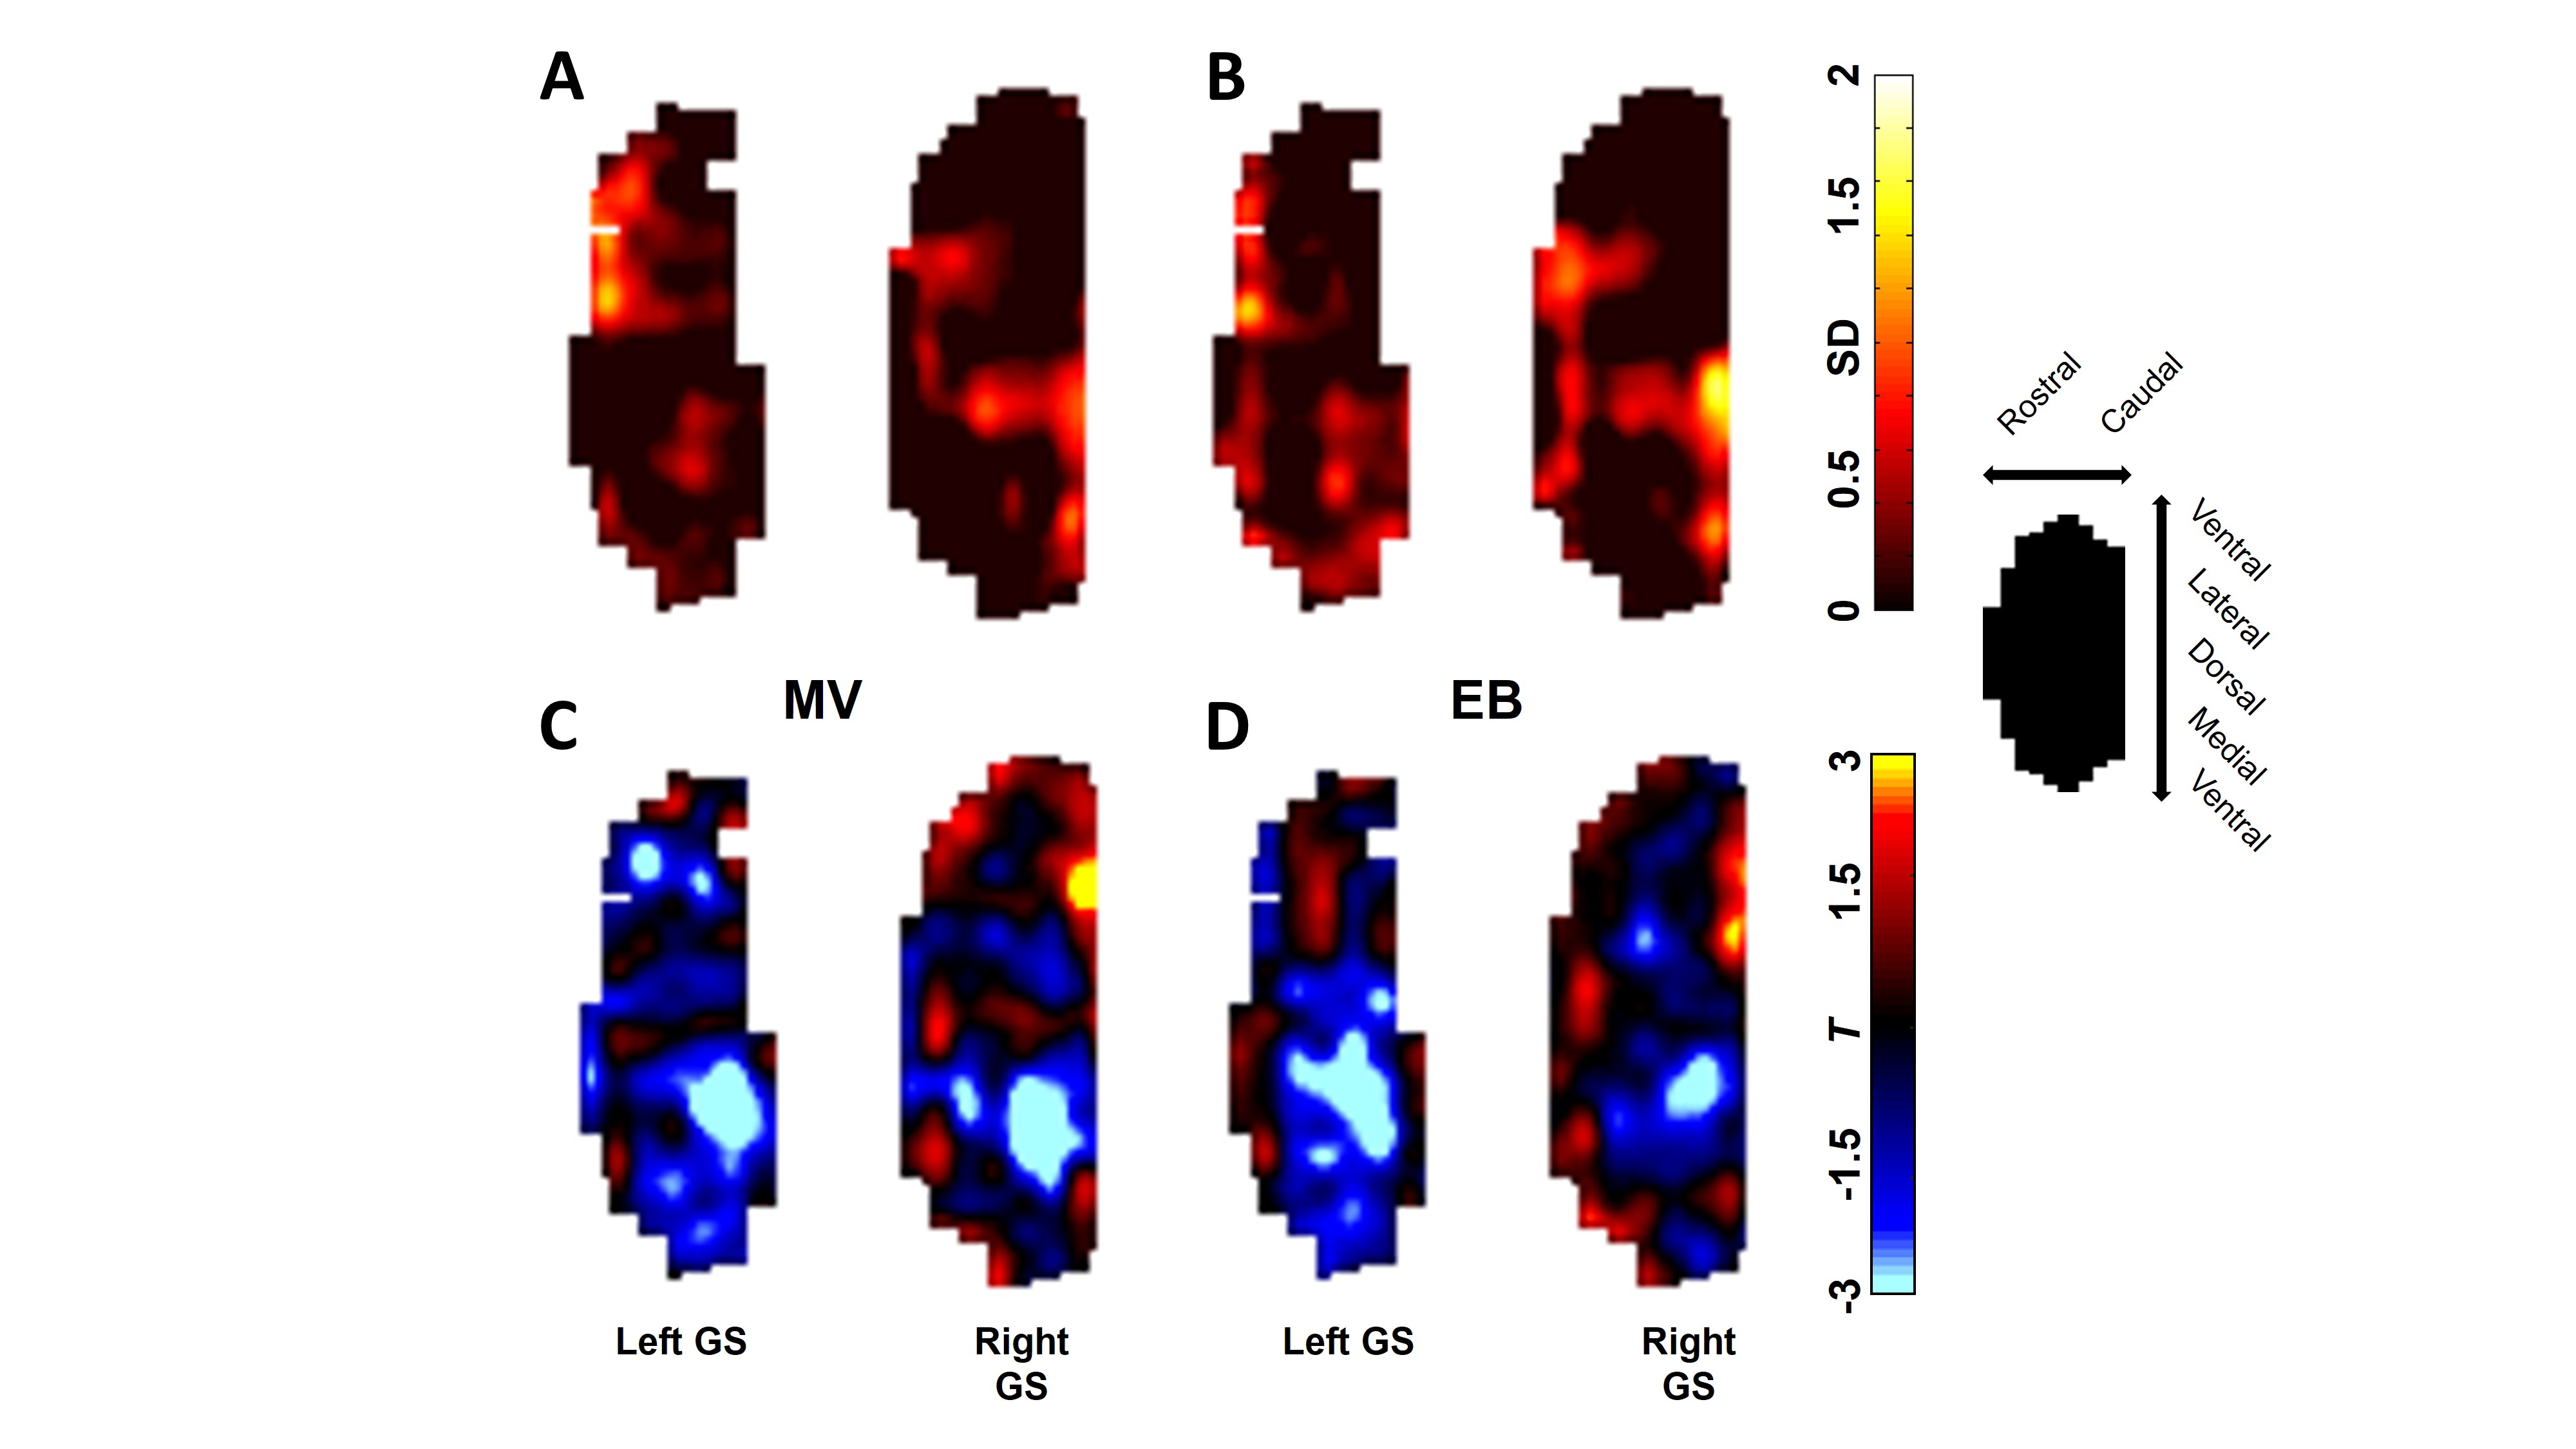
Upper panel shows similarity maps. The orthonasal maps for all trials
were averaged and summed to the average of the retronasal maps for all trials
under MV (A) and EB (B) stimulations. High values indicate
co-activation between the two methods. Lower
panel shows dominance maps. A two-sample, equal-variance,
two-tailed T-test was performed between orthonasal trials and retronasal trials
for MV (C) and EB (D) stimulations. Resultant T values are
shown with orthonasal > retronasal as < 0 / blue and retronasal >
orthonasal as > 0 / red.