1120
Diffusion fMRI reveals thalamo-cortical circuitry using forepaw stimulation in rats1Champalimaud Research, Champalimaud Centre for the Unknown, Lisbon, Portugal, 2Department of Computer Science, Centre for Medical Image Computing, London, United Kingdom
Synopsis
Diffusion fMRI (dfMRI) has been suggested as an alternative means for mapping activity more directly than its BOLD fMRI counterpart. However, it remains unclear whether dfMRI can deliver information not revealed by BOLD. Here, isotropic diffusion encoding dfMRI was used for mapping activity elicited by electrical forepaw stimulation. Data-driven analysis revealed that active voxels are localized within functionally distinct cortical units in dfMRI, while BOLD maps only evidenced widespread signals in the primary somatosensory cortex. Furthermore, dfMRI extracted the expected thalamocortical brain circuitry whereas BOLD fMRI did not, suggesting a potential role for dfMRI in direct detection of activity.
Introduction
Diffusion fMRI (dfMRI) has been proposed as an interesting approach for mapping brain activity1 more directly and with closer relationship to the underlying neural activity compared to its BOLD counterpart2-4. Here, we harnessed isotropic diffusion encoding dfMRI5 to avoid potential directionality bias, and data-driven analyses6,7 to probe neural activity, and compared spatial and temporal characteristics of dfMRI and BOLD signals in the electrically stimulated rat forepaw model.Methods
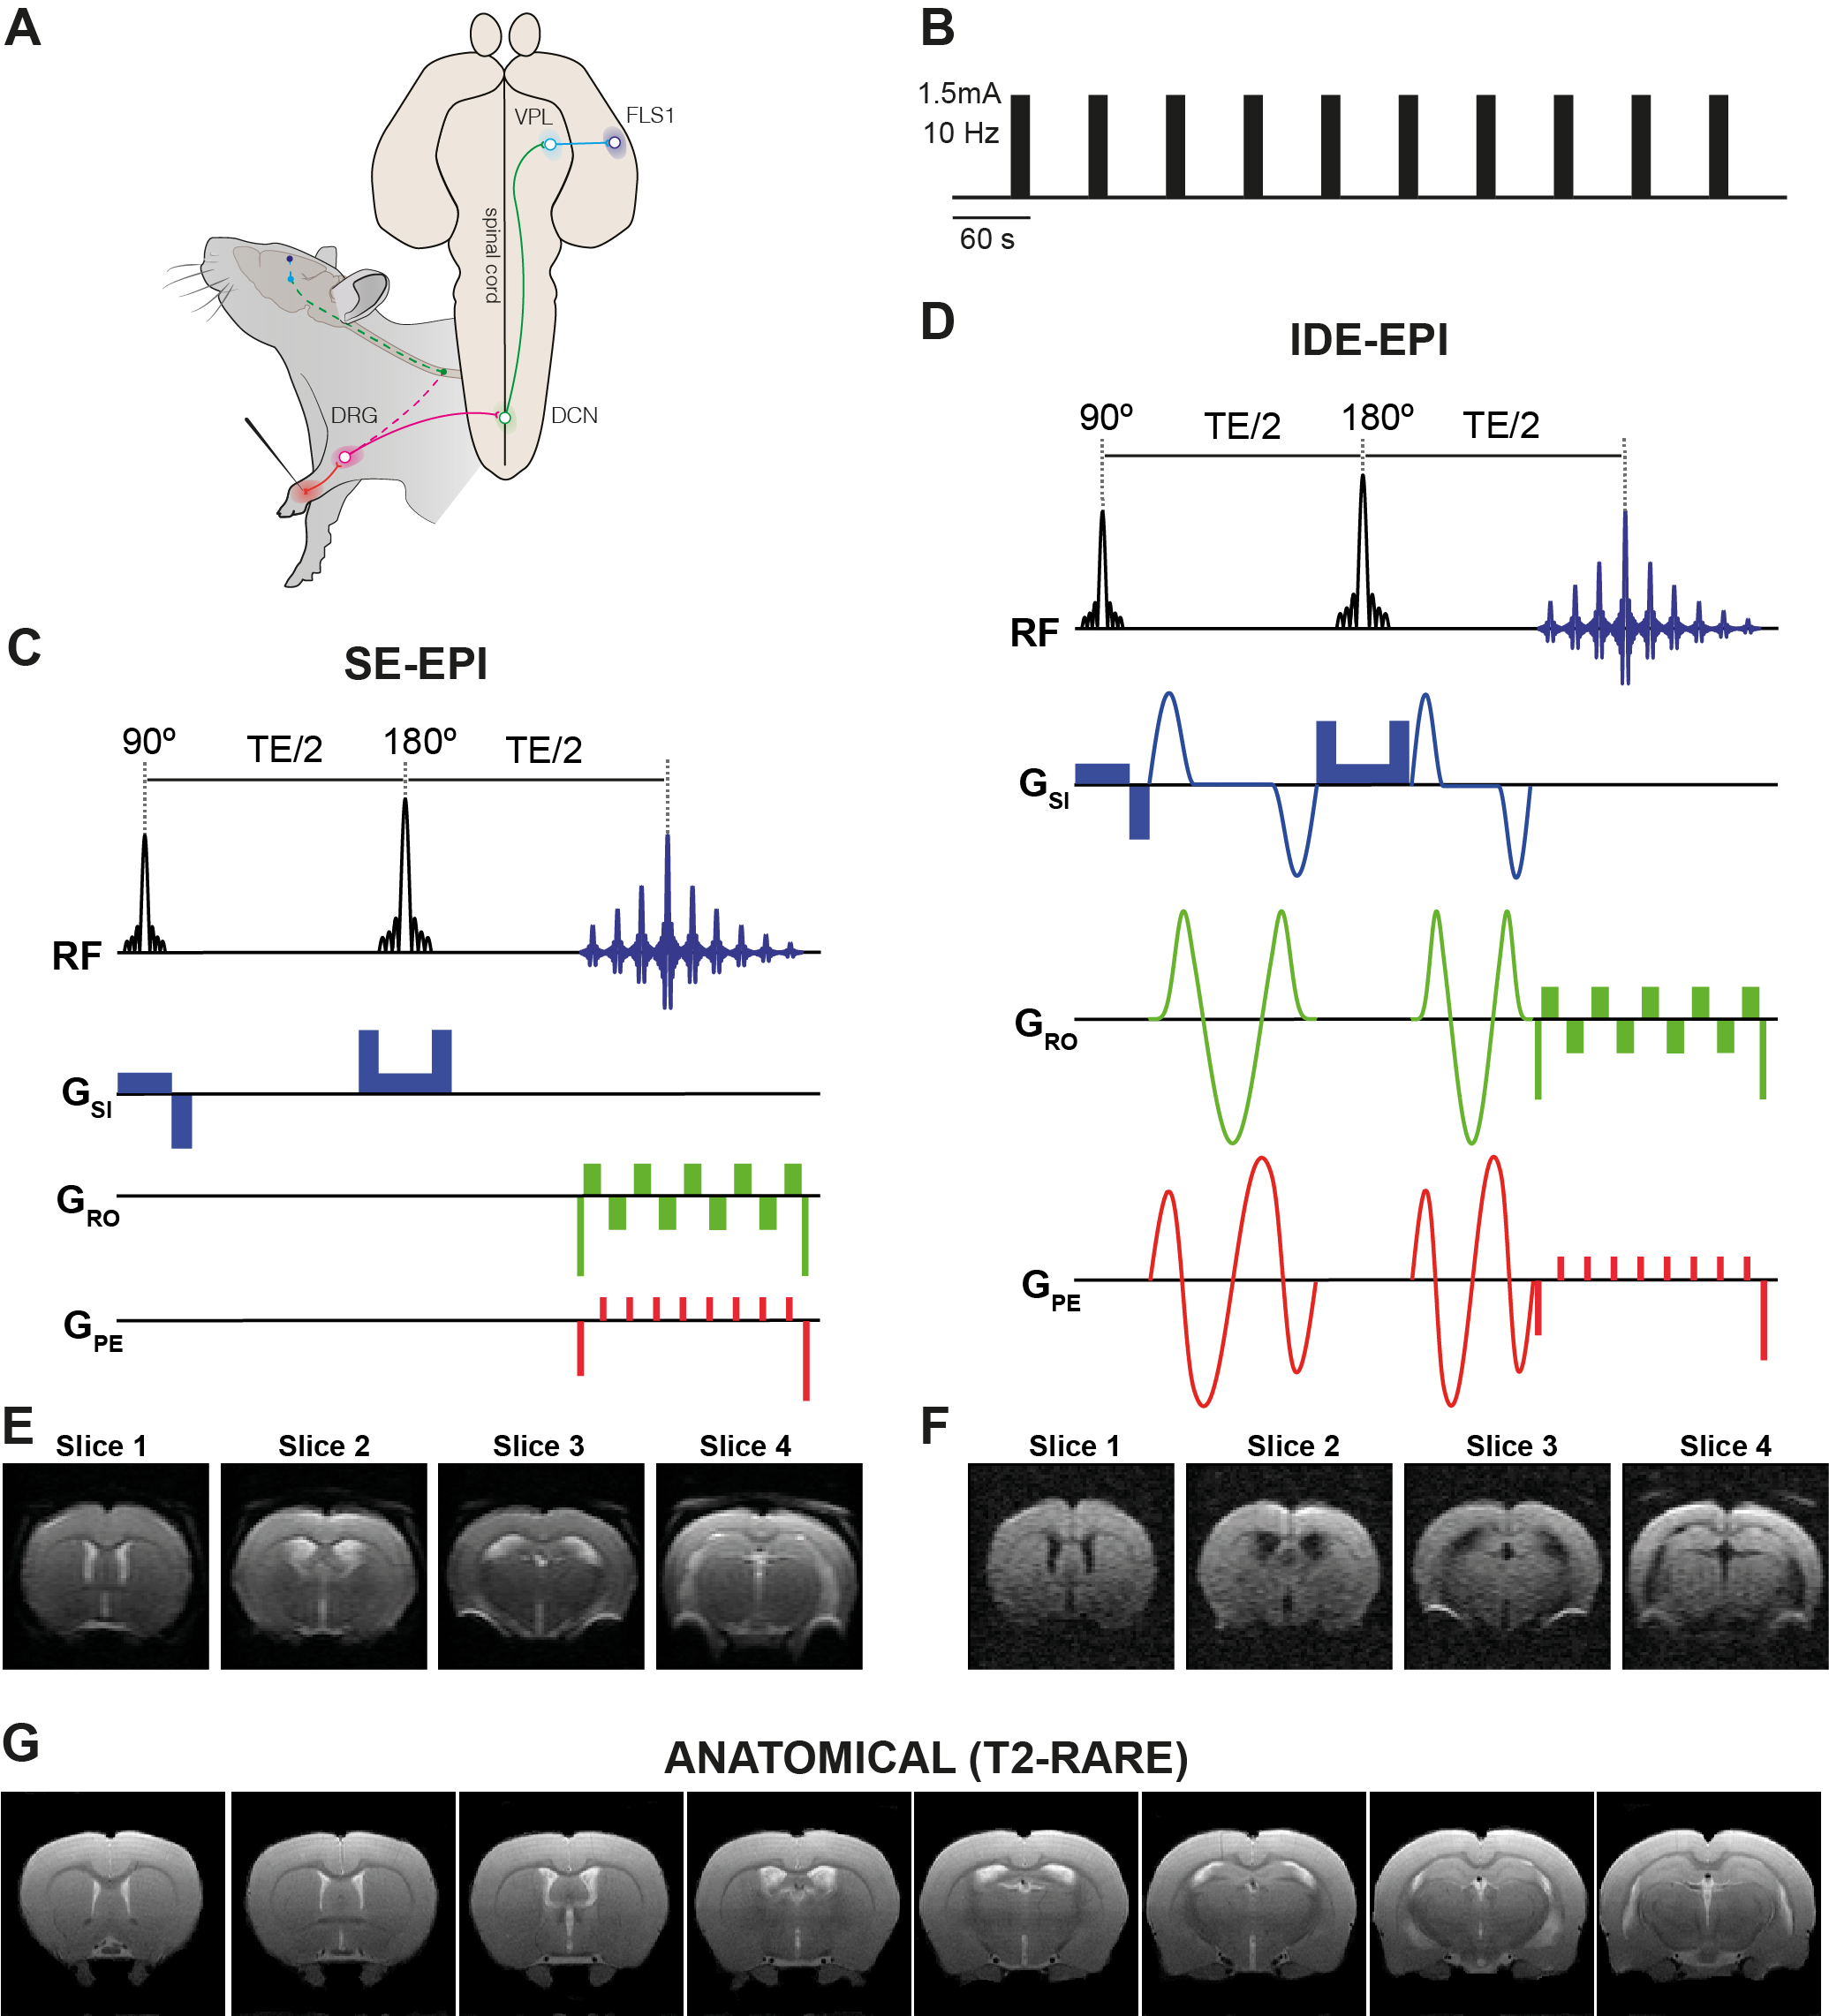
Animal preparation and setup: All experiments were preapproved by the local animal ethics committee operating under local and EU laws. Long Evan rats, 8-10 weeks old (n=5), were induced into deep anesthesia with 5% isoflurane and maintained under 2.5% isoflurane while two needles were inserted into the left forepaw’s digits 1-2 and 4-5 (Figure 1A). Animals were then switched to medetomidine sedation (bolus: 0.05mg/ml/kg, constant infusion: 0.1mg/ml/kg). The animal’s temperature, respiration rate and pCO2 were continuously monitored and remained constant during the imaging session.
Stimulation paradigm: Following 45 seconds of rest, electrical pulses were delivered to the forepaw with a square waveform comprising 1.5mA, 10Hz and 3ms stimulus duration, for 15 seconds followed by 45 seconds of rest (Figure 1B) for a total of 10 stimulation periods.
Functional Imaging: All experiments were performed using a 9.4T Bruker BioSpec scanner equipped with a gradient system producing up to 66 G/cm isotropically. An 86 mm quadrature resonator was used for transmittance, while a 4-element cryoprobe was used for reception. Four coronal slices of interest were placed between +1.68 and -4.36 mm from bregma. A spin-echo echo-planar imaging sequence (SE-EPI) (TR/TE=1500/40 ms, FOV=16.1 x 16.1 mm, matrix size of 70x70, partial Fourier 1.75, interpolation in read direction 1.1, slice thickness 1.5 mm, in-plane resolution 230µmx230µm), was used to impart BOLD contrast (Figure 1C); the same sequence, but now overlaid with isotropic diffusion encoding gradients5 was used for diffusion-weighted contrasts (Figure 1D) with b=1500 s/mm2 (Δ/δ = 19.5/14.2 ms, b tensor {zeta,theta,phi} = {54.73,0,0} deg, respectively.
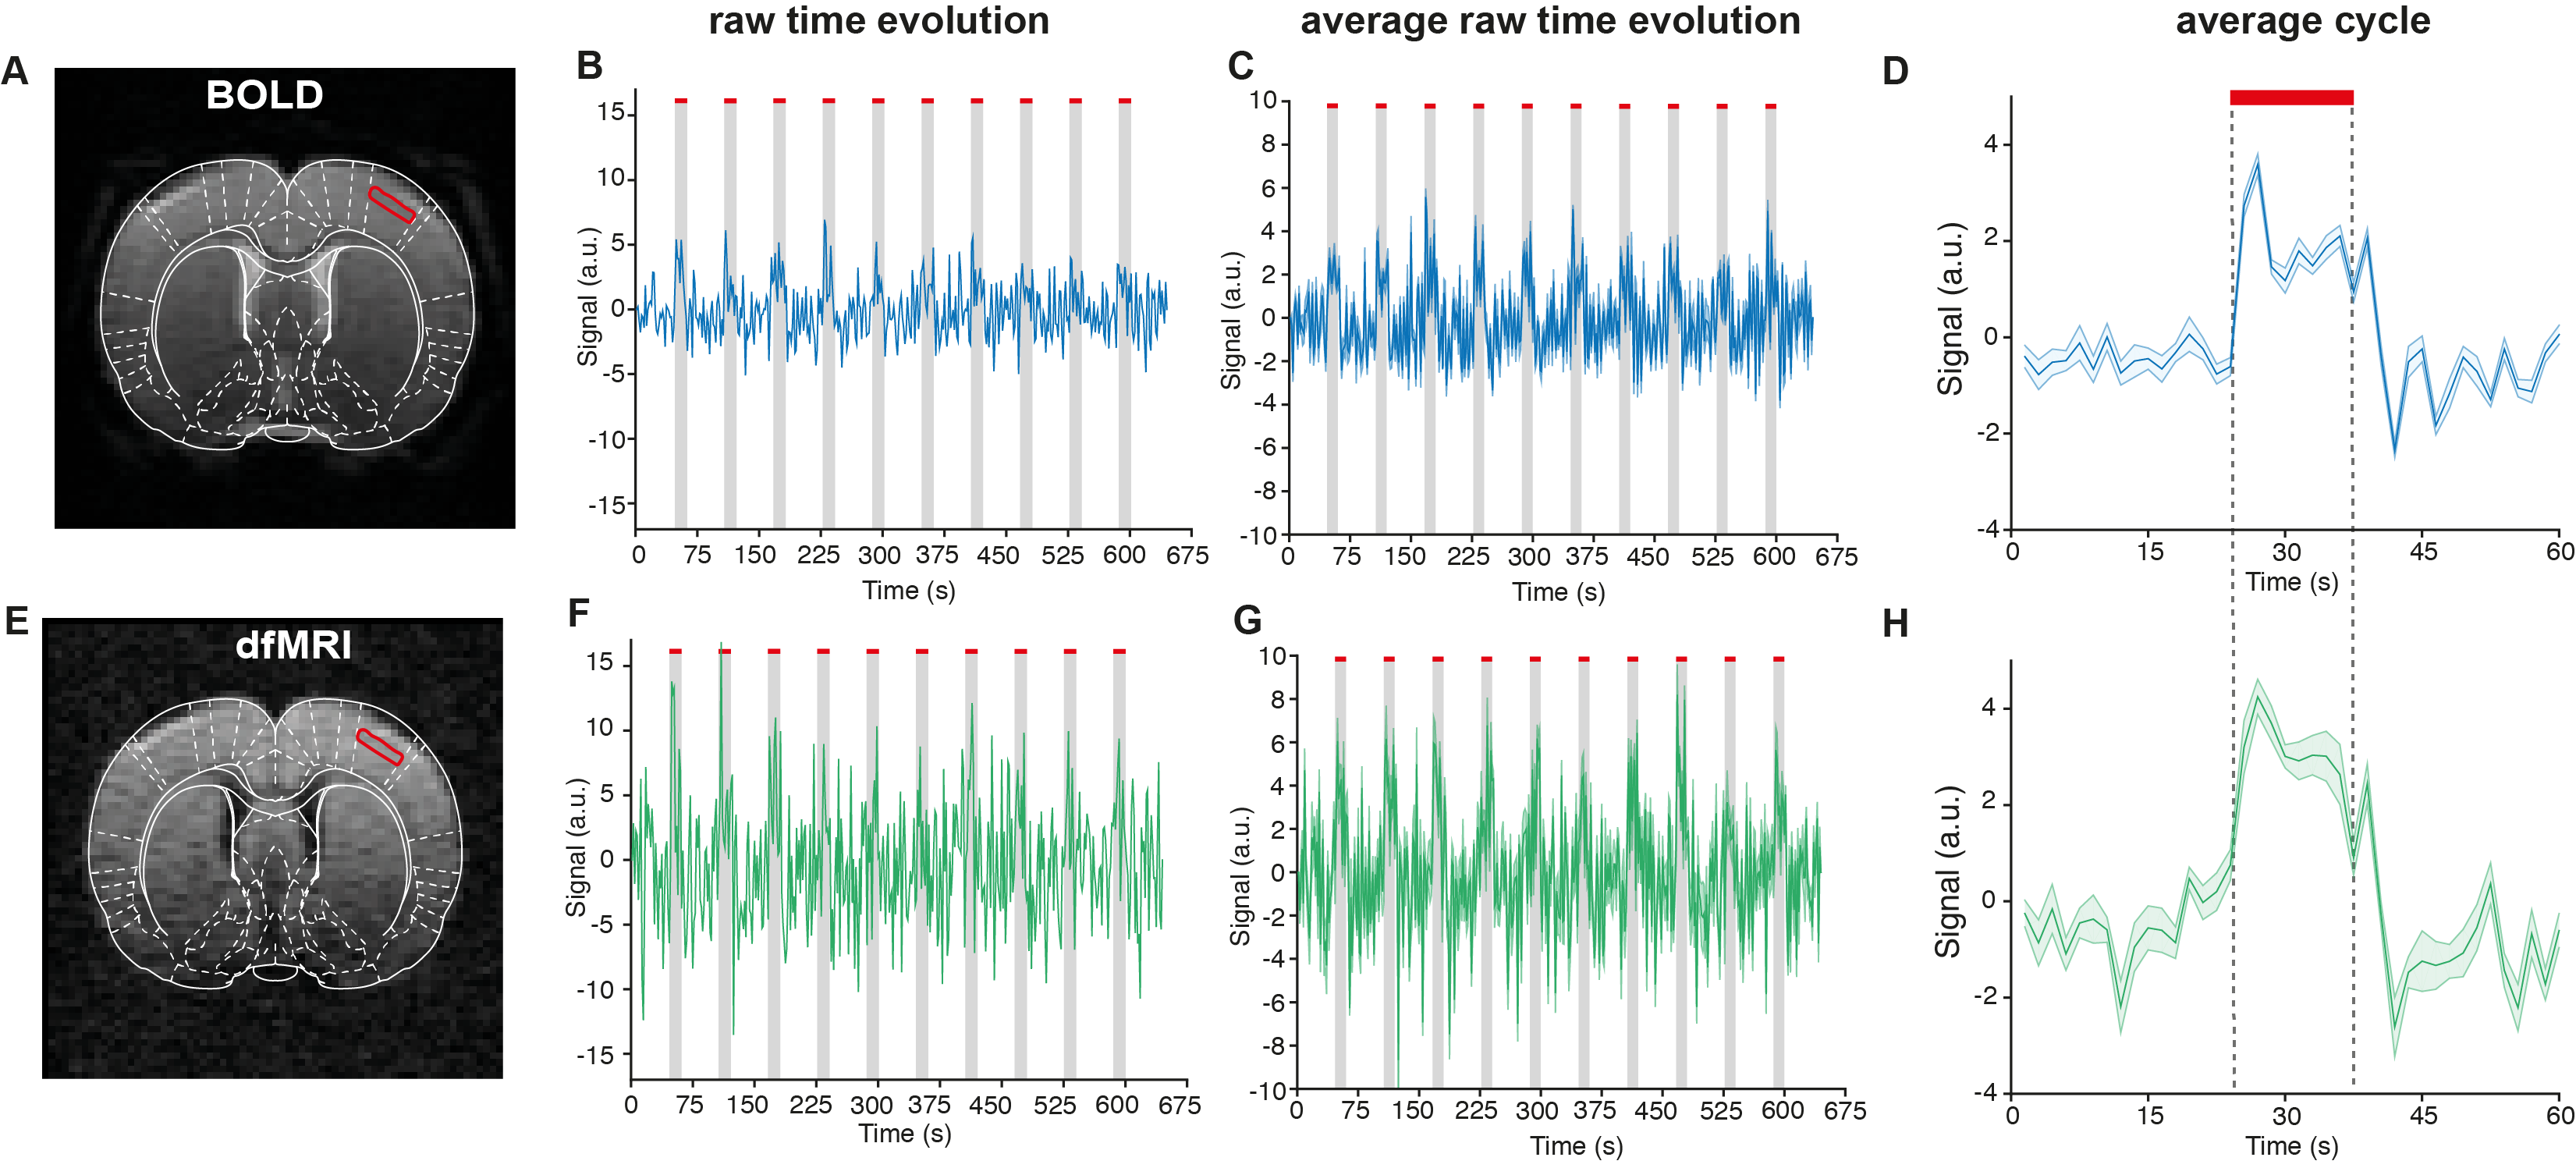
Data analysis: Images were first spatially realigned using SPM in Matlab (The Mathworks, Nattick, USA). Then, regions of interest (ROIs) were drawn and their mean±standard error of the mean signals were extracted and drift-corrected. The average cycle was calculated by averaging all stimulation epochs from all animals. The spectral and coherence analyses were implemented as previously described7. All anatomical information was inferred from the Paxinos&Watson rat brain atlas8.
Results
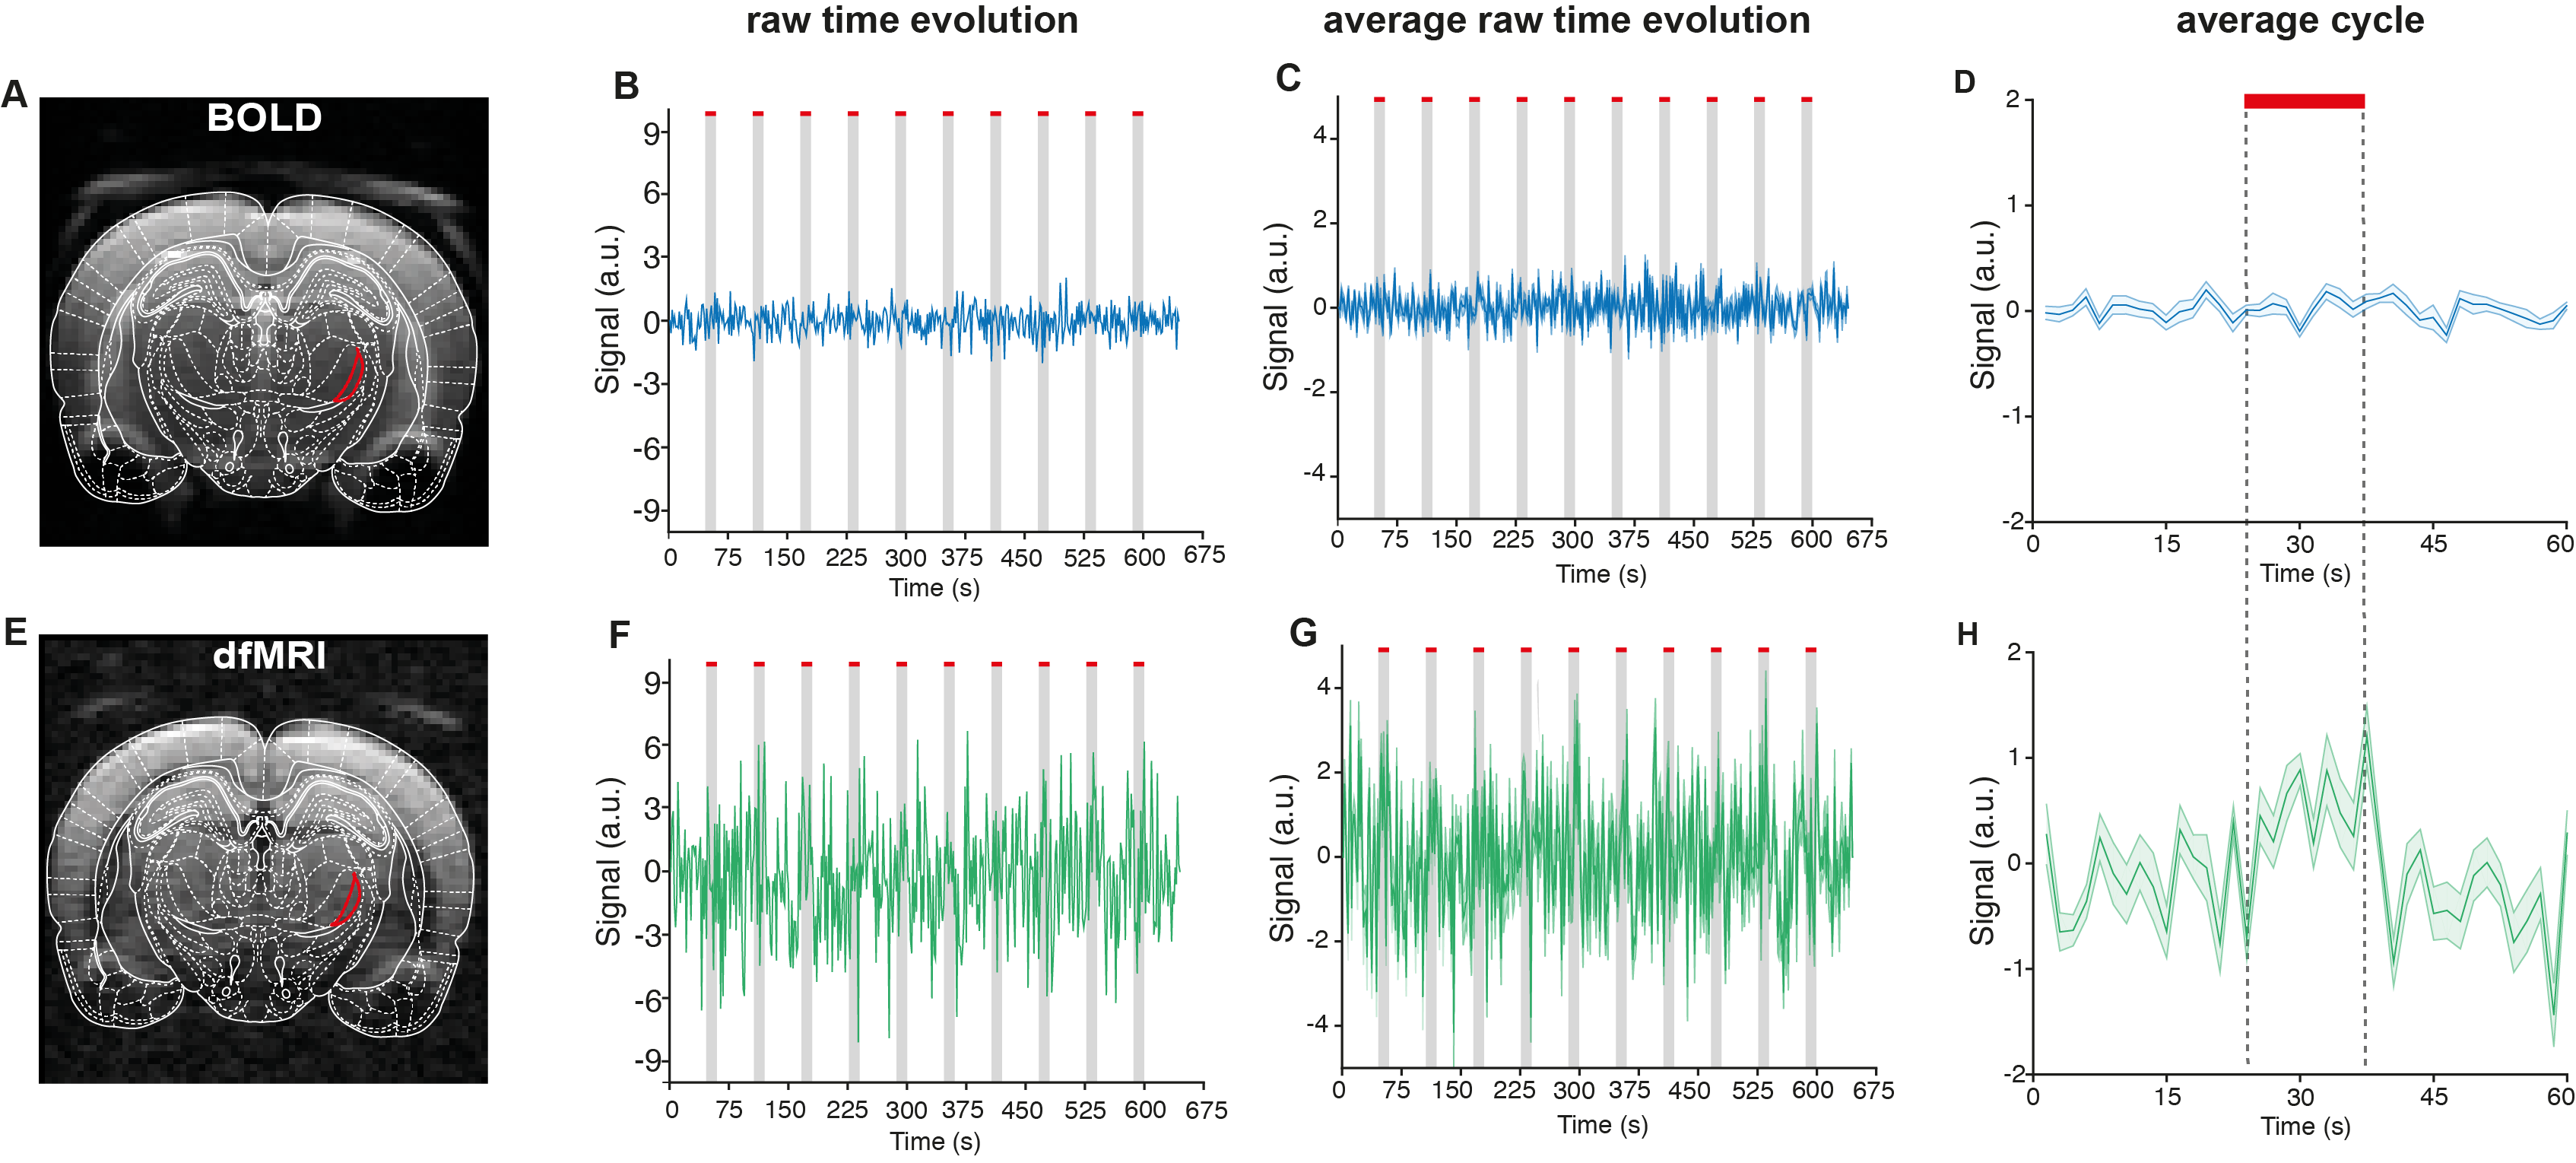
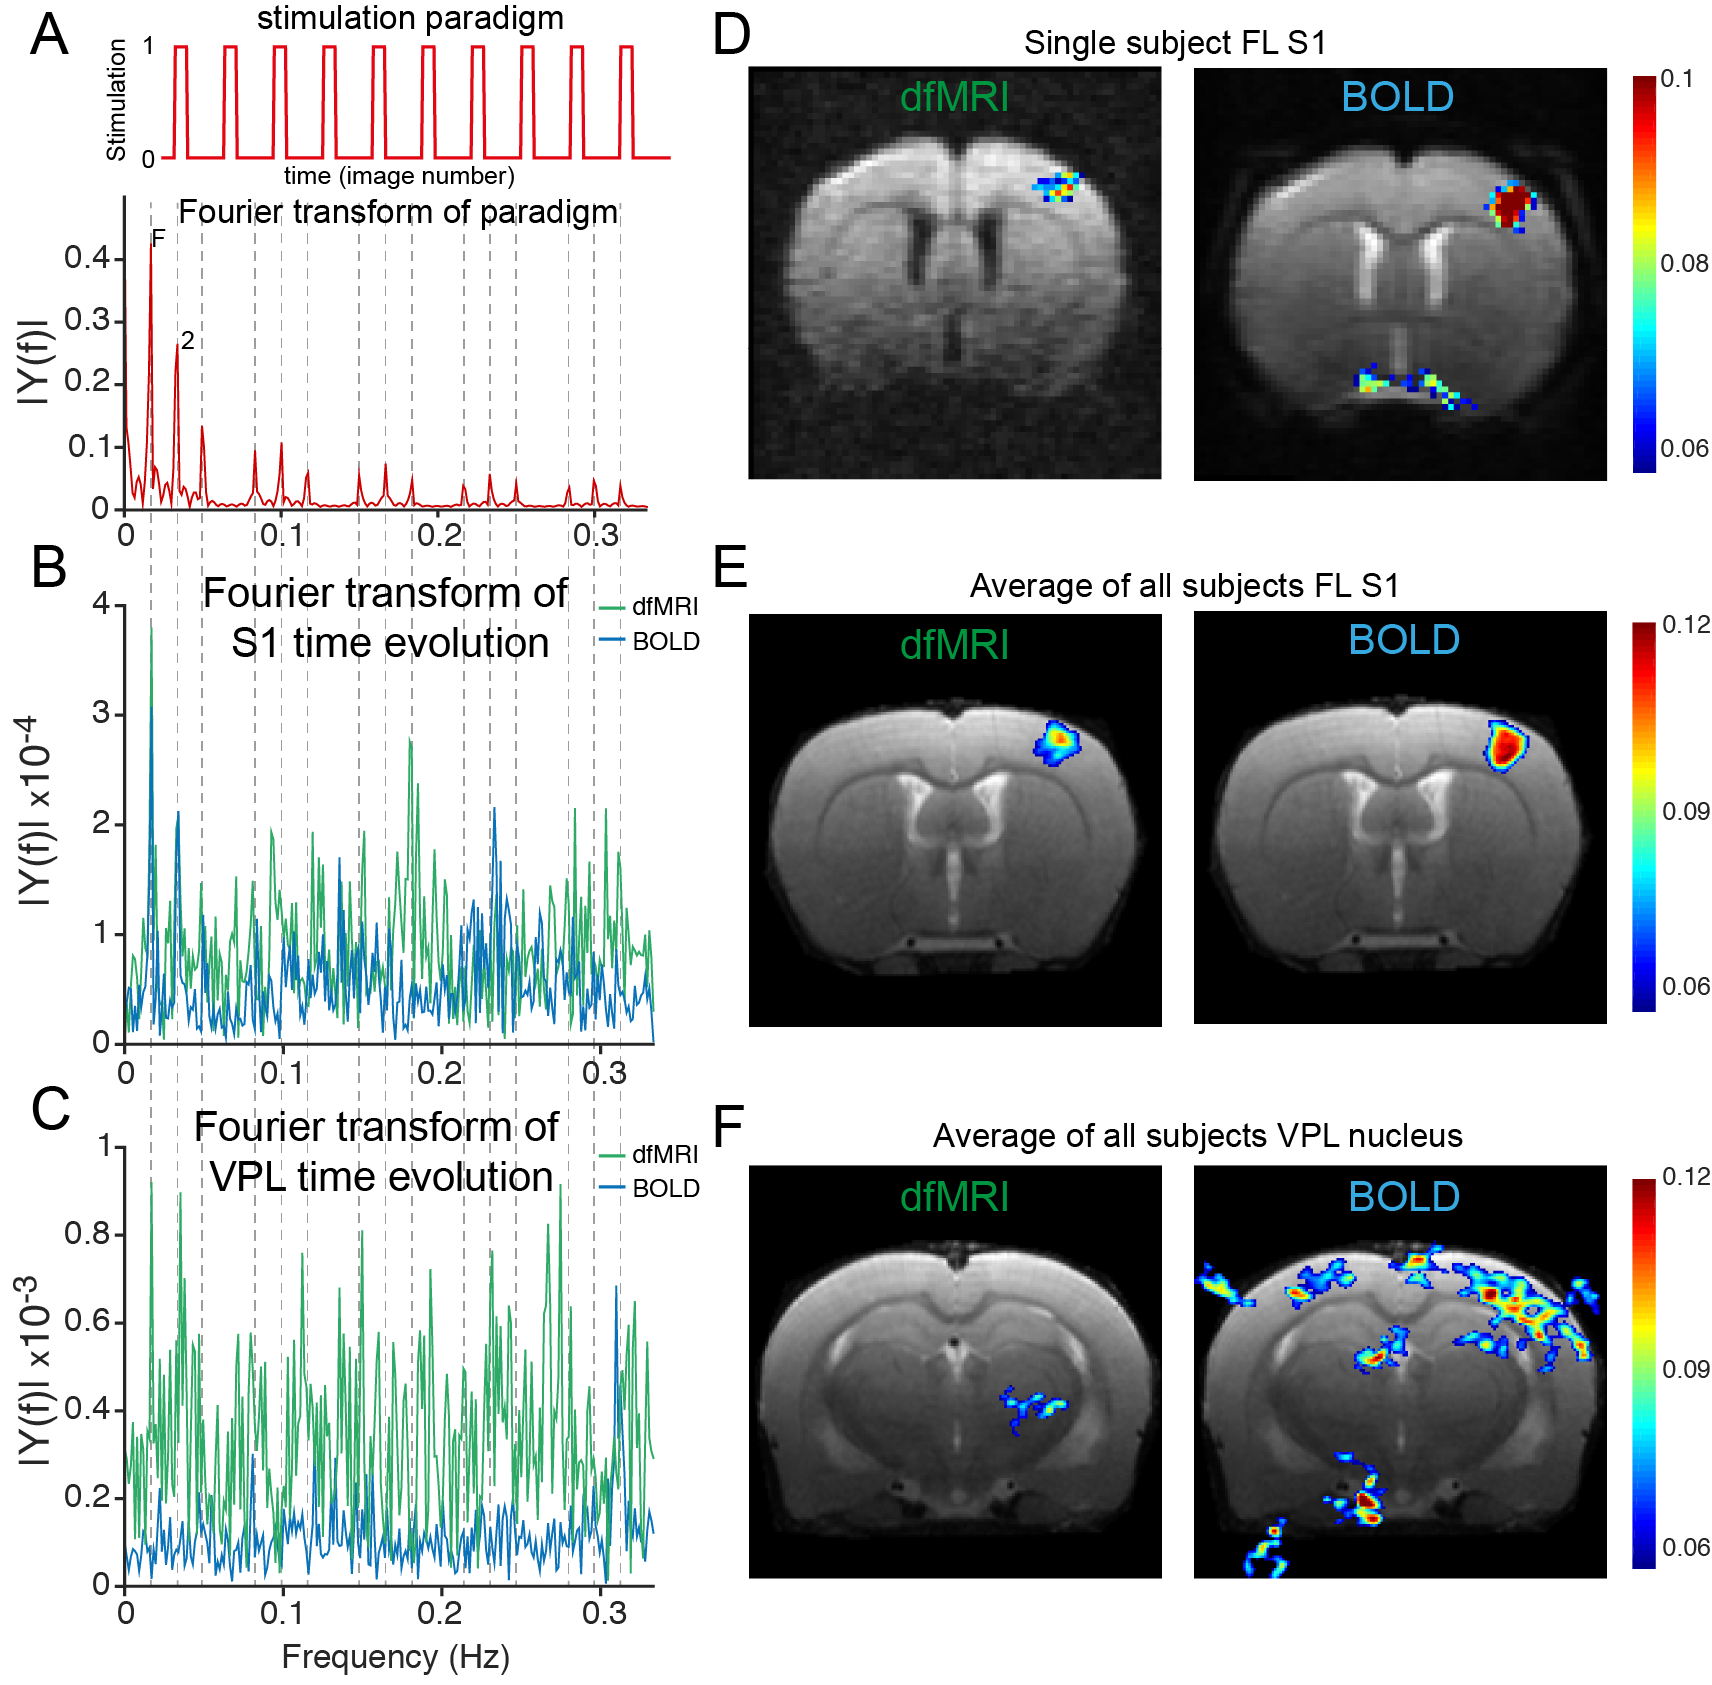
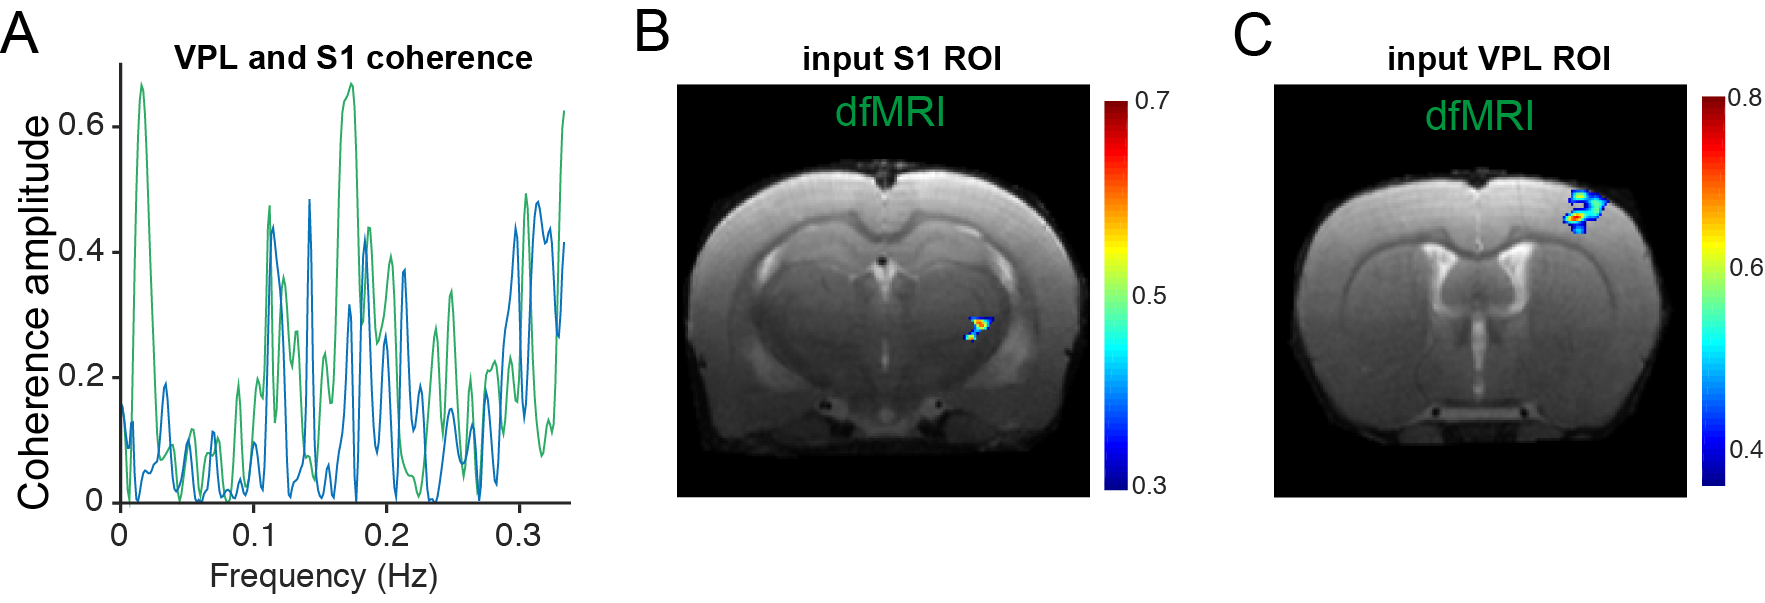
The neuronal pathway known to be activated during electrical stimulation of the forepaw in rats9 is shown in Figure 1A. Raw data for both dfMRI and BOLD fMRI shows exquisite signal-to-noise-ratio (SNR) due to the cryogenic coil (Figs 1E-F). BOLD and dfMRI temporal profiles from S1 layer IV are shown for a single representative subject (Figure 2B and 2F) and for all subjects averaged (Figure 2C and 2G), as well as averaged cycle signals (Figs 2D and 2H), respectively. While the BOLD and dfMRI signals are quite similar in S1, more insight can be gained from examining the ventro-posterior lateral nucleus (VPL), which is known to gate sensorial information of the limbs to the cortex (Figure 3). BOLD signals did not evidence any activity in VPL, while dfMRI showed clear activation (p<0.001). Spectral analysis revealed frequency peaks at the stimulation frequency (0.016Hz) and its harmonics (Figure 4A-C). A voxel-by-voxel spectral analysis then clearly revealed the dfMRI activity in VPL and S1 (Figure 4D-F). To better evaluate whether the VPL signal would be related to the cortical signal in dfMRI, we used spectral coherence analysis7 (Figure 5) with S1 as the seed area. VPL was the only brain region coherent with the S1 signal at a frequency of 0.016Hz. Correspondingly, the dfMRI coherence maps with VPL as input showed signals only in S1, highest at the input level, as expected (Figure 5).Discussion
The spatial distribution of active voxels in dfMRI is more structured and closer to the physiologically known cortical processing across layers10,11. In BOLD, signals occupied homogenously most S1 voxels, suggesting homogeneous activation; however, it is known from neurophysiology that the input layers IV and V should be both most active and most coherent with the paradigm in such experiments10, exactly as manifested in the dfMRI maps. Additionally, the VPL – Layer IV connection expected to operate at the level of forepaw stimuli, was delineated using coherence analysis. All these suggest that dfMRI is indeed more closely related with the underlying activity.Conclusion
dfMRI activation maps are more spatially distinct than corresponding BOLD maps and reveal anatomically connected brain regions. These results are promising for future direct neural activity mapping.Acknowledgements
This study was supported by funding from the European Research Council (ERC) under the European Union’s Horizon 2020 research and innovation programme (Starting Grant, agreement No. 679058) and one of the authors was supported by EPSRC grant number M507970.References
1. Jasanoff A. Bloodless FMRI. Trends Neurosci. 2007;30(11):603-610.
2. Tsurugizawa T, Ciobanu L, Le Bihan D. Water diffusion in brain cortex closely tracks underlying neuronal activity. Proc Natl Acad Sci U S A. 2013;110(28):11636-11641.
3. Abe Y, Tsurugizawa T, Le Bihan D. Water diffusion closely reveals neural activity status in rat brain loci affected by anesthesia. PLoS Biol. 2017;15(4):e2001494.
4. Spees WM, Lin TH, Song SK. White-matter diffusion fMRI of mouse optic nerve. Neuroimage. 2013;65:209-215.
5. Westin CF, Knutsson H, Pasternak O, et al. Q-space trajectory imaging for multidimensional diffusion MRI of the human brain. Neuroimage. 2016;135:345-362.
6. Mitra PP, Pesaran B. Analysis of dynamic brain imaging data. Biophys J. 1999;76(2):691-708.
7. Sun FT, Miller LM, D'Esposito M. Measuring interregional functional connectivity using coherence and partial coherence analyses of fMRI data. Neuroimage. 2004;21(2):647-658.
8. Paxinos G, Watson C. The Rat Brain in stereotaxic coordinates. 7th edition. Academic Press; 2014. 9. Lee LJ, Erzurumlu RS. Altered parcellation of neocortical somatosensory maps in N-methyl-D-aspartate receptor-deficient mice. J Comp Neurol. 2005;485(1):57-63.
10. de Kock CP, Sakmann B. Spiking in primary somatosensory cortex during natural whisking in awake head-restrained rats is cell-type specific. Proc Natl Acad Sci U S A. 2009;106(38):16446-16450. 11. Guo ZV, Li N, Huber D, et al. Flow of cortical activity underlying a tactile decision in mice. Neuron. 2014;81(1):179-194.
Figures