1119
Validation of spinal cord fMRI with LFP and spike activity in non-human primates1Vanderbilt University Institute of Imaging Science, Nashville, TN, United States, 2Biomedical Engineering, Vanderbilt University, Nashville, TN, United States, 3Radiology and Radiological Sciences, Vanderbilt University Medical Center, Nashville, TN, United States
Synopsis
Stimulus-driven and resting-state fMRI BOLD signals have previously been reported in the spinal cord to delineate its functional architecture. However, validation of these resting-state findings has yet to be performed. In this study, we compared spinal fMRI results with electrophysiology (LFP and spike activity) in non-human primates and found that 1) signals elicited by stimulation occur predominantly in the ipsilateral dorsal horn and only in the appropriate segments 2) resting-state dorsal-dorsal functional connectivity is significantly greater than that in dorsal-to-intermediate-gray-matter, and 3) resting-state functional connectivity is spatially constrained to two spinal segments.
Background
To date, the functional organization of the spinal cord (SC) remains relatively unexplored compared to the brain despite its importance serving as a conduit for motor outputs from the brain, peripheral inputs to the brain and as a center for coordinating certain reflexes. This is partly due to its small physical size and the presence of pronounced physiological noise and distortions from magnetic field inhomogeneities [1]. Stimulus-driven fMRI has been reported for over a decade [2], but only recently have resting-state networks within cord grey matter been reliably found in both humans and animals [3]–[5]. Specifically, dorsal-dorsal and ventral-ventral resting-state BOLD correlations have been shown to be significantly more robust when compared to connectivity between other pairs of regions (horns). However, validation of these resting-state findings has yet to be performed. Thus in this study, we combined measurements of local field potentials (LFPs) and spiking activity in non-human primates (NHPs) to validate findings from stimulus-driven and resting-state fMRI.Methods
Eight adult male squirrel monkeys were included in this study. Four animals underwent laminectomy and subsequent electrophysiology recordings. Resting-state and stimulus-driven (8Hz innocuous tactile, 30s on/off, 10 epochs) MRI acquisitions were obtained on a 9.4T Varian magnet with a saddle-shaped transmit-receive surface coil. Five anatomic axial images were obtained using magnetization transfer contrast (TR/TE=220/3.24ms, 0.25x0.25x3mm3) while BOLD images were acquired using a fast gradient echo sequence (TR/TE=46.9/6.50ms, 0.5x0.5x3mm3). Previously acquired spinal fMRI datasets with a higher temporal resolution (TR=24.0ms) on healthy monkeys were also included in group analyses. Data pre-processing and ROI analysis procedures were standard and were described in our previous publication [3].
A four-shank linear microelectrode-array (Microprobes Blackrock, 16 channels/shank, 150m separation between contacts) covering various depths was used to collect resting-state (15 minutes) and stimulus-evoked (same paradigm design as MRI) recordings; 2-3 runs were collected for each monkey. LFP signals were sampled at 500Hz, notch-filtered at 60 and 120Hz, and 1-150Hz band-pass filtered. Stimulus-driven LFP data were separated into stimulus-on and stimulus-off periods before power differences were computed at the first five harmonics of 8Hz from Welch’s power spectra. Spike activity events were evaluated with rate histograms, raster plots and peri-event histograms. Resting-state LFPs were further de-noised by notch-filtering the first five harmonics of the respiration frequency. Using channels with greatest LFP responses as seeds, resting-state coherences were computed between dorsal horns within and across slices. As controls, coherences between dorsal horns and dorsal-to-intermediate-gray-matter were computed as well.
Results and Discussion
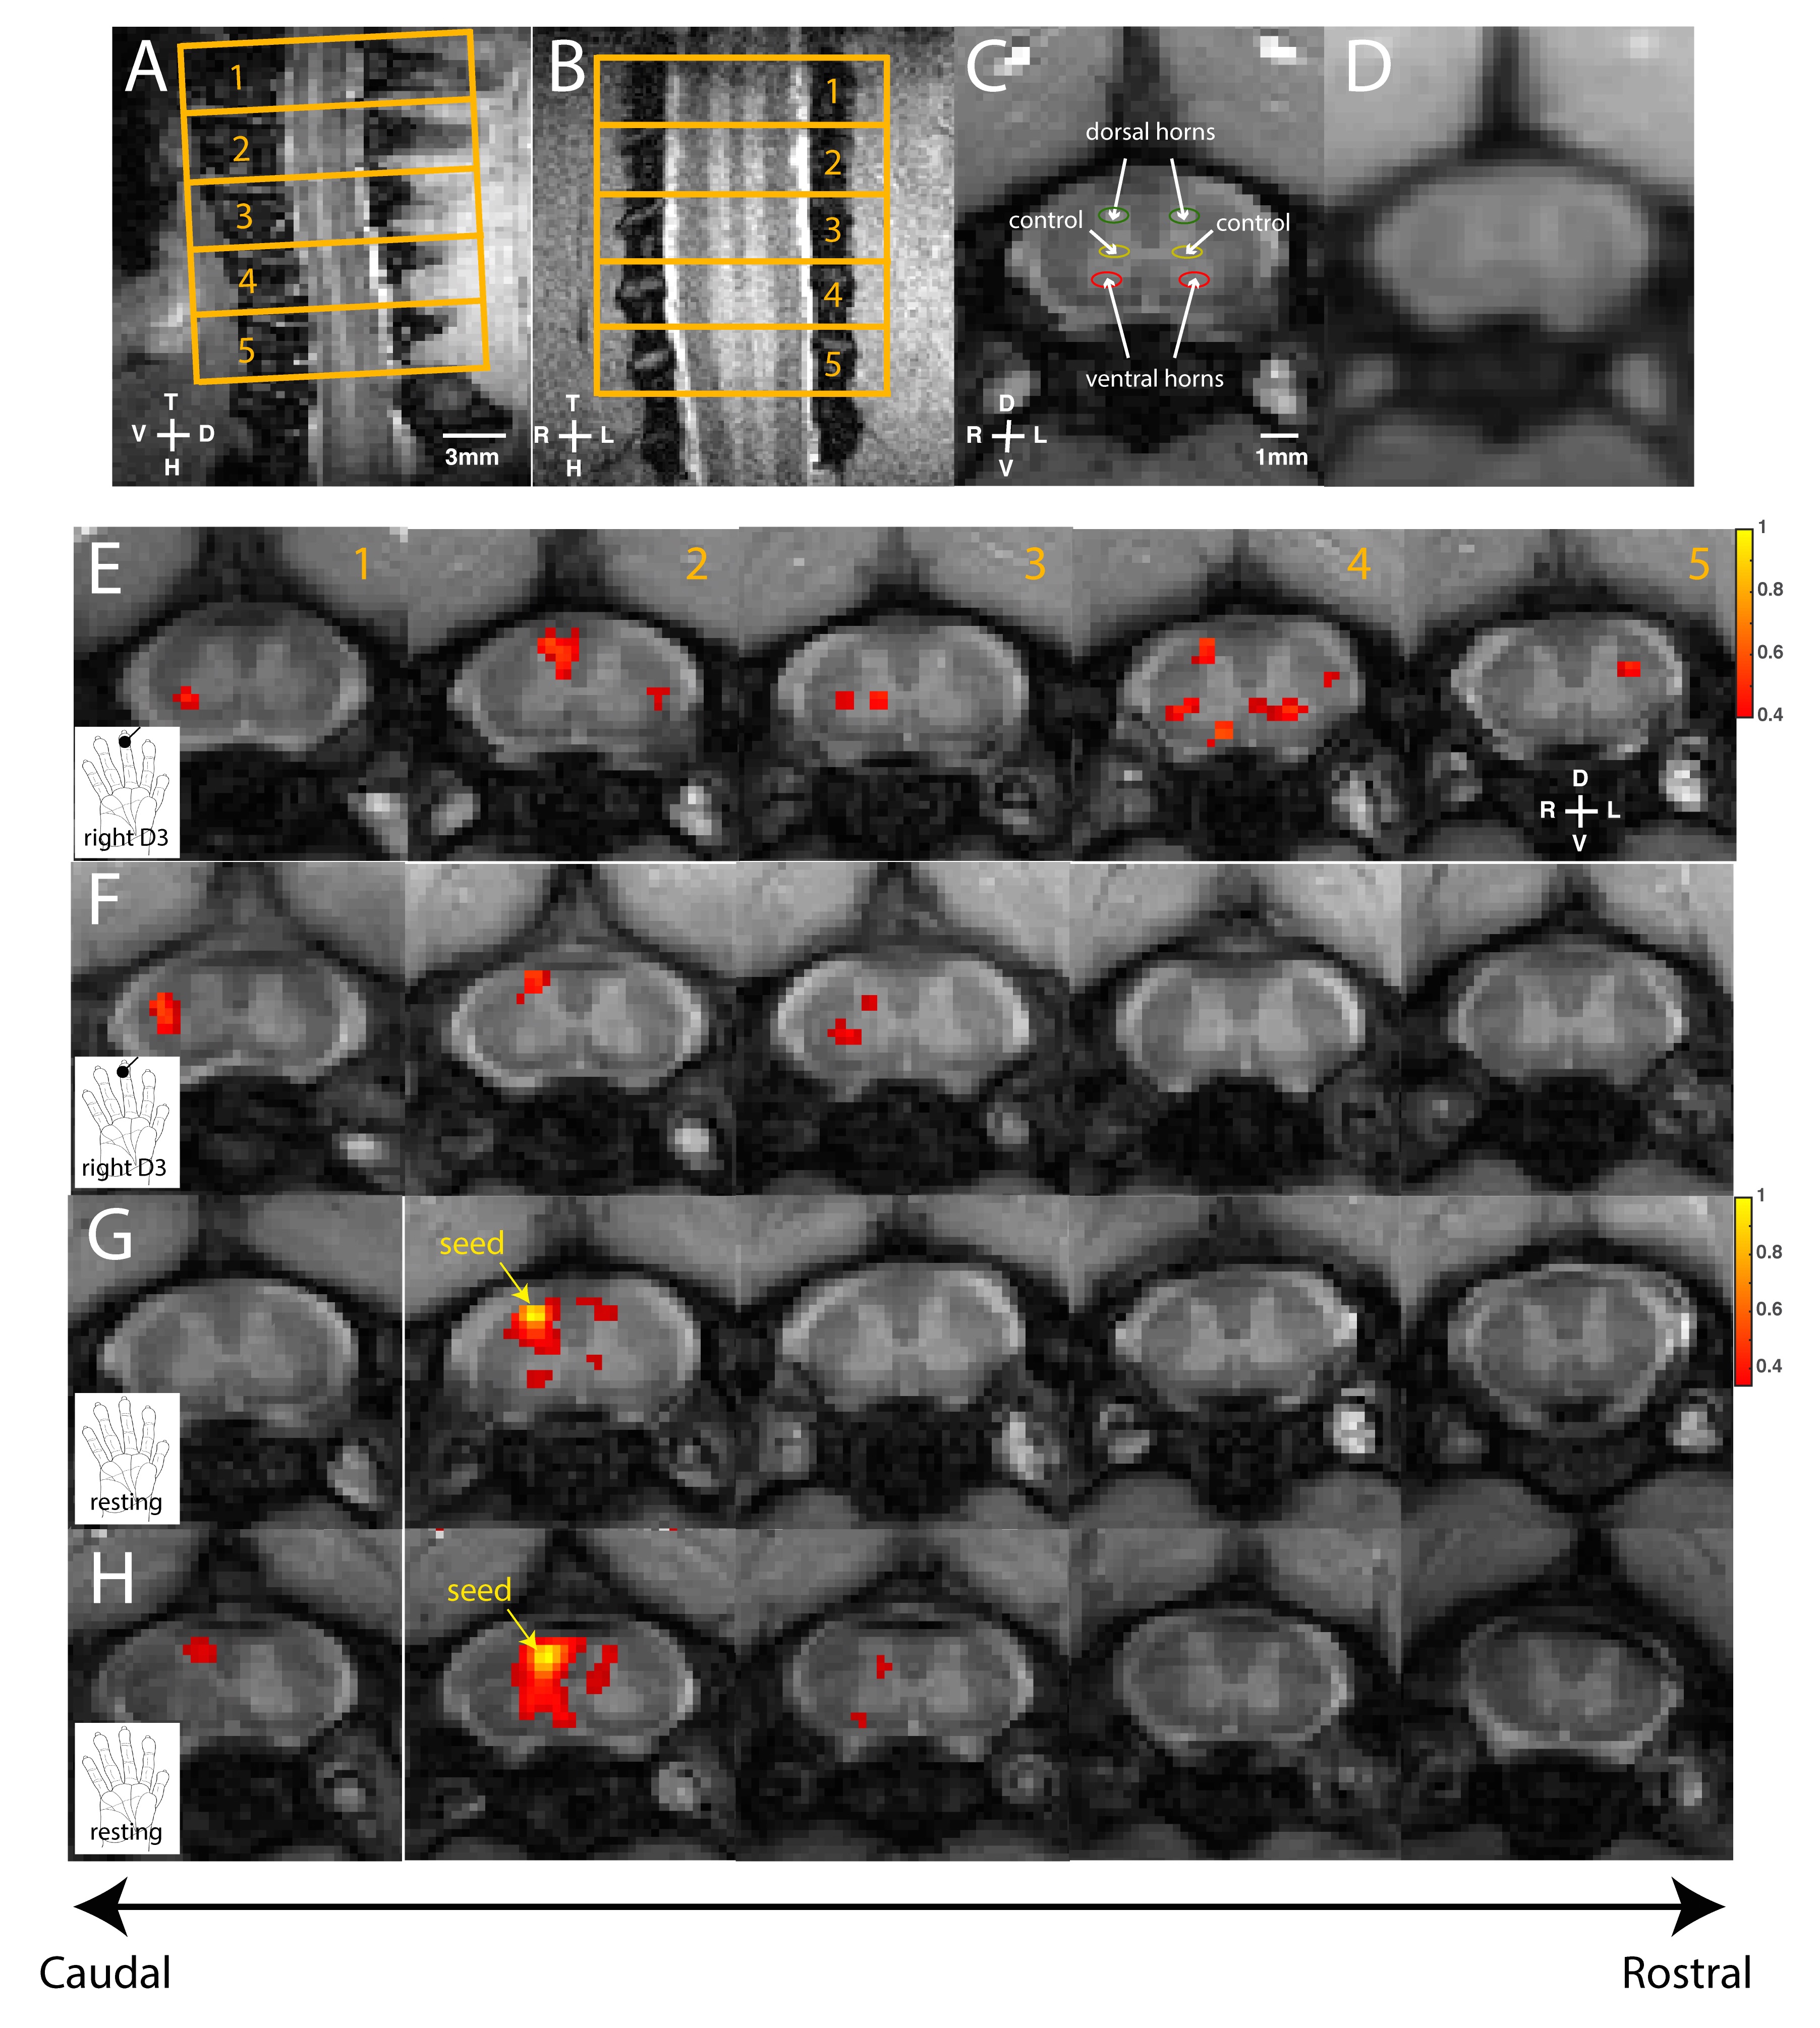
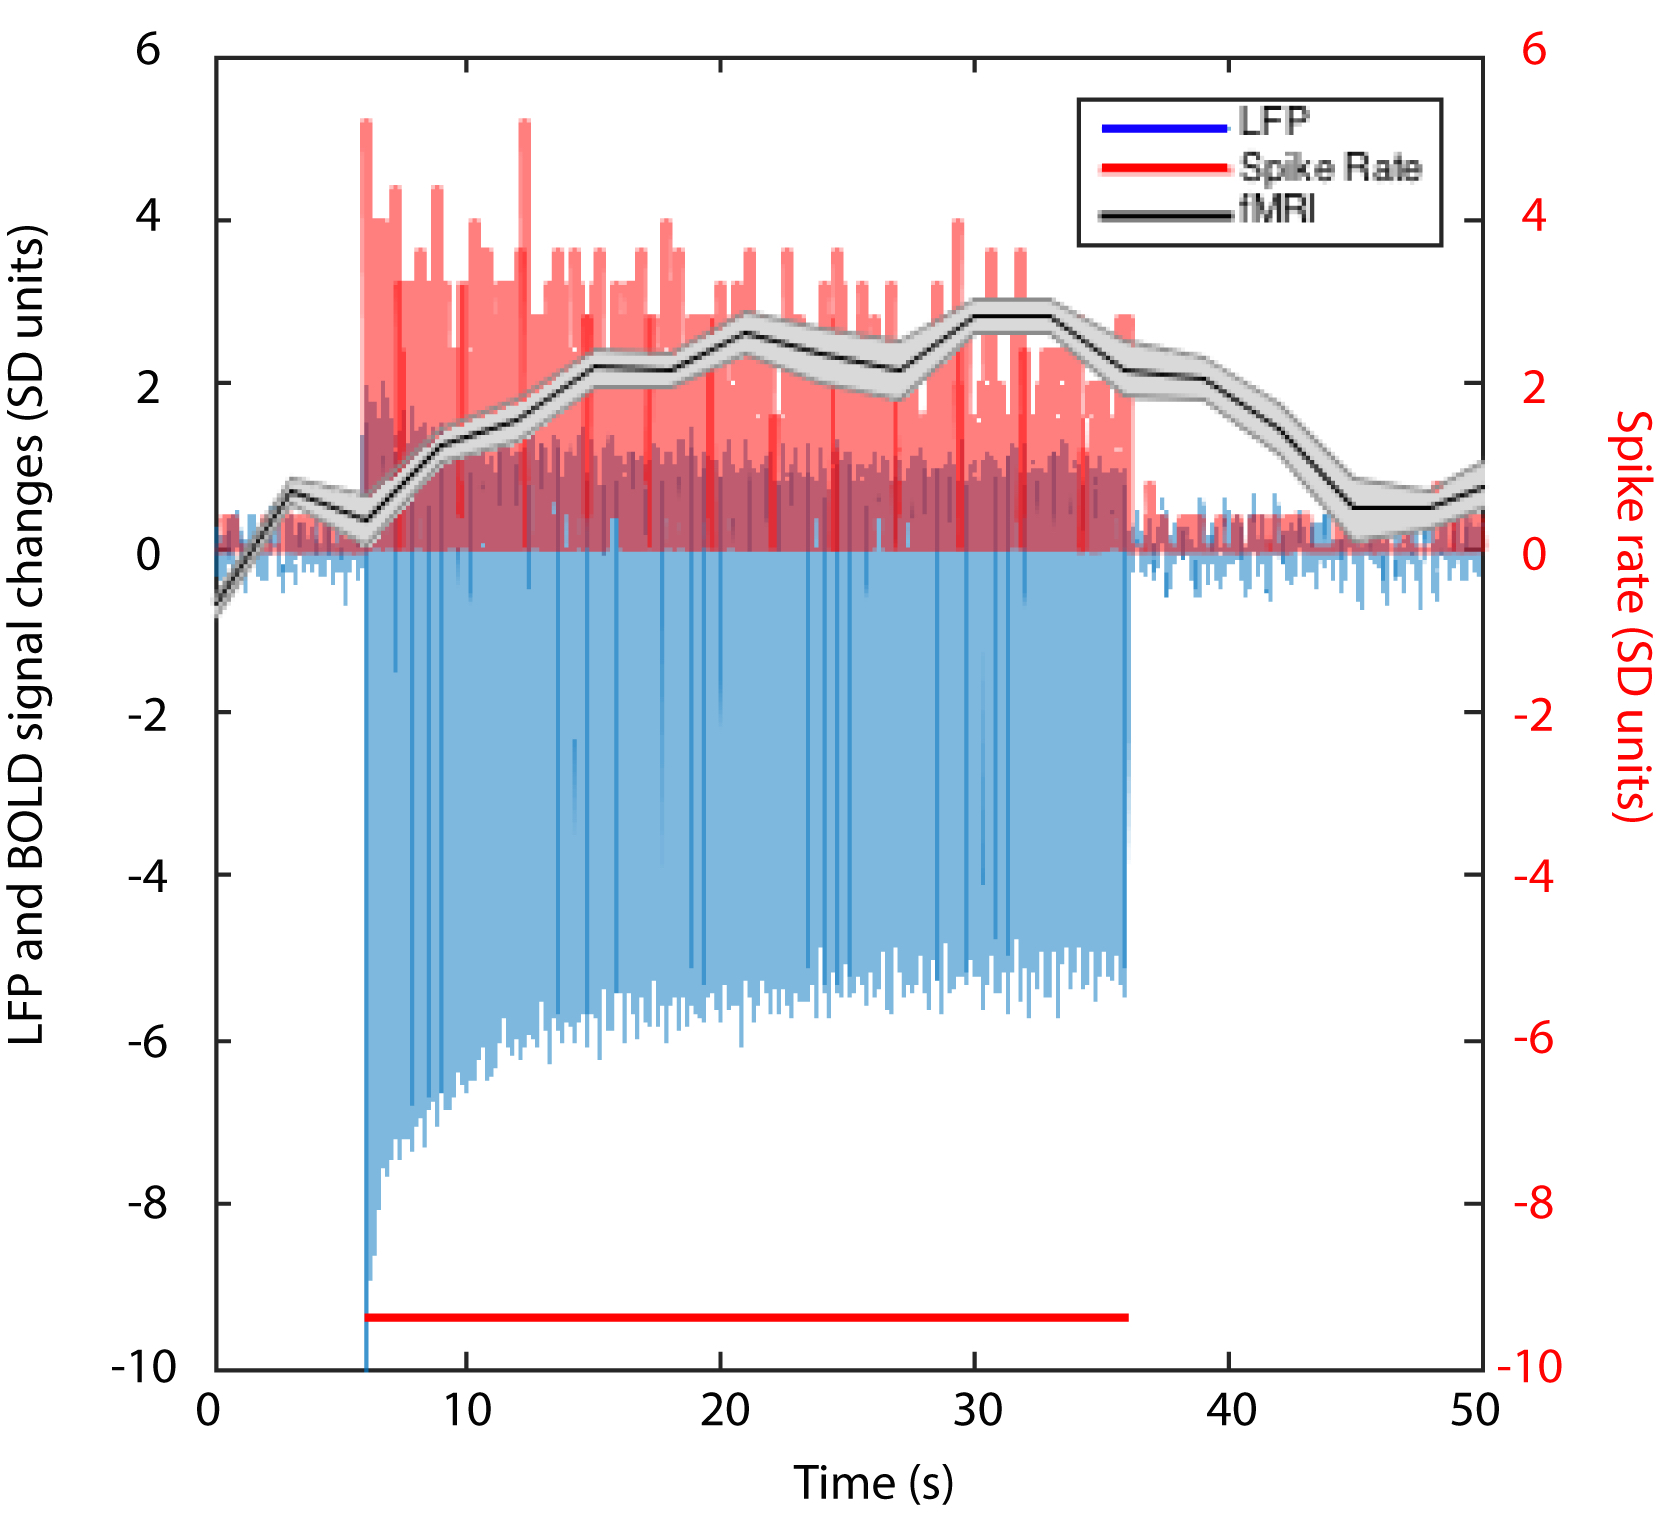
We first reproduced fMRI findings from our previous publications in the four monkeys that underwent electrophysiology (Figure 1): innocuous tactile stimulation elicited strongest signal on the ipsilateral dorsal horn, while within-slice resting state dorsal-dorsal connections were most prominent compared to control regions. Spinal segments for different digits were identified with electrophysiology recordings, based on neurons’ receptive field properties (Figure 2). Targeted recordings at two spinal segments further confirmed neuronal origins of activity evoked by tactile stimuli used in fMRI studies. Specifically, robust LFP activations are evident as synchronous voltage changes with the stimulus paradigm (yellow shades in Figure 3E-H) along with apparent frequency peaks at 8Hz harmonics in the power spectra (Figure 3I-L). Similarly, spike histograms show significantly greater spike rates during stimulus-on while peri-event rasters present consistent firing of neuronal discharges with the stimulus external event (Figure 3M-T). Figure 3A-D presents averaged power changes for stimulation of different digits, and Figure 4 overlays averaged LFP, spike rate and fMRI in one representative monkey, SQM-3815. Overall, significant power changes were observed in the ipsilateral dorsal horn of the appropriate cervical segment, a finding that is congruent with previously reported fMRI studies [2,3].
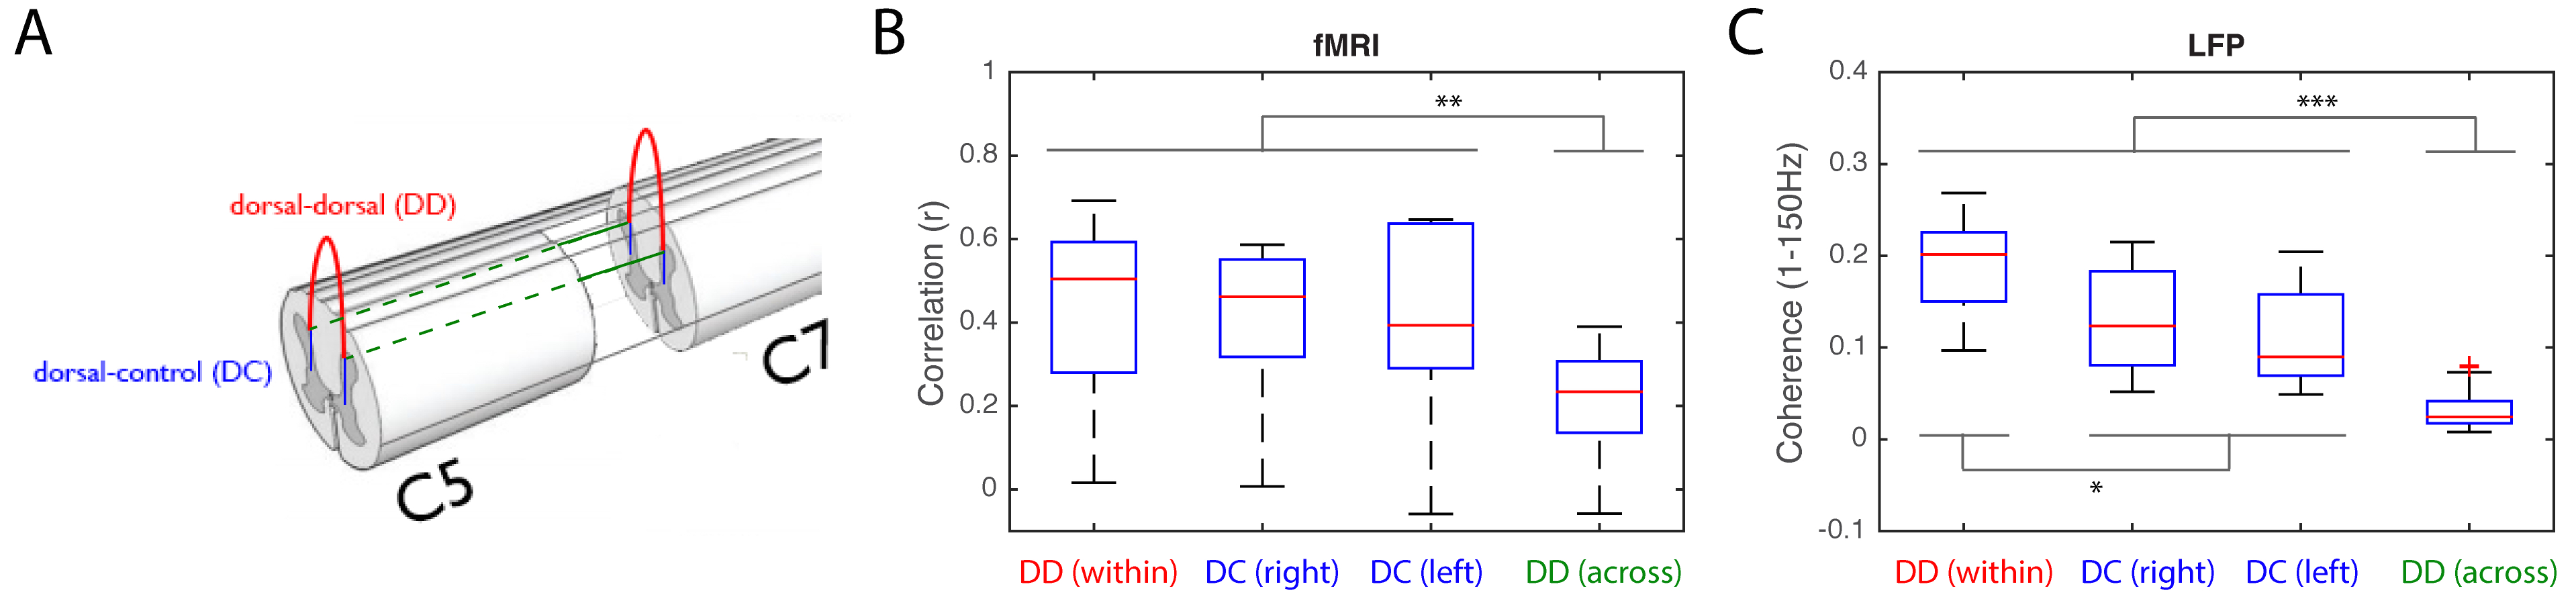
Inter-horn resting-state connectivity patterns observed in fMRI were also validated using LFP coherences (Figure 5). Specifically, within-slice dorsal-dorsal functional connectivity was stronger than in dorsal-to-intermediate-gray-matter for both fMRI and LFP. Moreover, across-segment dorsal-to-dorsal connectivity was significantly weaker than that within-slice, an observation consistent with the bell-shaped correlation profile found in fMRI [3]. Trends of connectivity measures in different ROI pairs were also highly similar between the two (r=0.94, p=0.057) while Bonferonni corrected Mann-Whitney tests between different ROI selections support this observation. Overall, we have validated previously reported fMRI findings in spinal cords with direct invasive measurements of neuronal activity in NHPs.
Conclusion
High agreements between fMRI and electrophysiology findings imply that fMRI can be reliably used to assess functional circuits in the SC and are most likely reflective of neuronal activity. Both modalities point to parallel conclusions, and findings here may lay the foundation to assessing and monitoring SC injuries in patients by using resting-state fMRI.Acknowledgements
We thank Mrs. Chaohui Tang and Mr. George H. Wilson of the Vanderbilt University Institute of Imaging Science for their assistance in animal preparation and data collection.References
[1] F. Eippert, Y. Kong, M. Jenkinson, I. Tracey, and J. C. W. Brooks, “Denoising spinal cord fMRI data: Approaches to acquisition and analysis.,” Neuroimage, 2016.
[2] P. W. Stroman, “Magnetic Resonance Imaging of Neuronal Function in the Spinal Cord: Spinal fMRI,” Clin. Med. Res., vol. 3, no. 3, pp. 146–156, 2005.
[3] L. M. Chen, A. Mishra, P.-F. Yang, F. Wang, and J. C. Gore, “Injury alters intrinsic functional connectivity within the primate spinal cord.,” Proc. Natl. Acad. Sci. U. S. A., vol. 112, no. 19, pp. 5991–6, 2015.
[4] R. L. Barry, S. A. Smith, A. N. Dula, and J. C. Gore, “Resting state functional connectivity in the human spinal cord,” Elife, vol. 2014, no. 3, pp. 1–15, 2014.
[5] T.-L. Wu, F. Wang, A. Mishra, G. H. Wilson, N. Byun, L. M. Chen, and J. C. Gore, “Resting-state functional connectivity in the rat cervical spinal cord at 9.4 T,” Magn. Reson. Med., Sep. 2017.
Figures