1117
Functional connectivity under six anesthesia protocols and the awake condition in rat brain1A.I.V. Institute for Molecular Sciences, University of Eastern Finland, Kuopio, Finland, 2Department of Radiology, Oulu University Hospital, Oulu, Finland
Synopsis
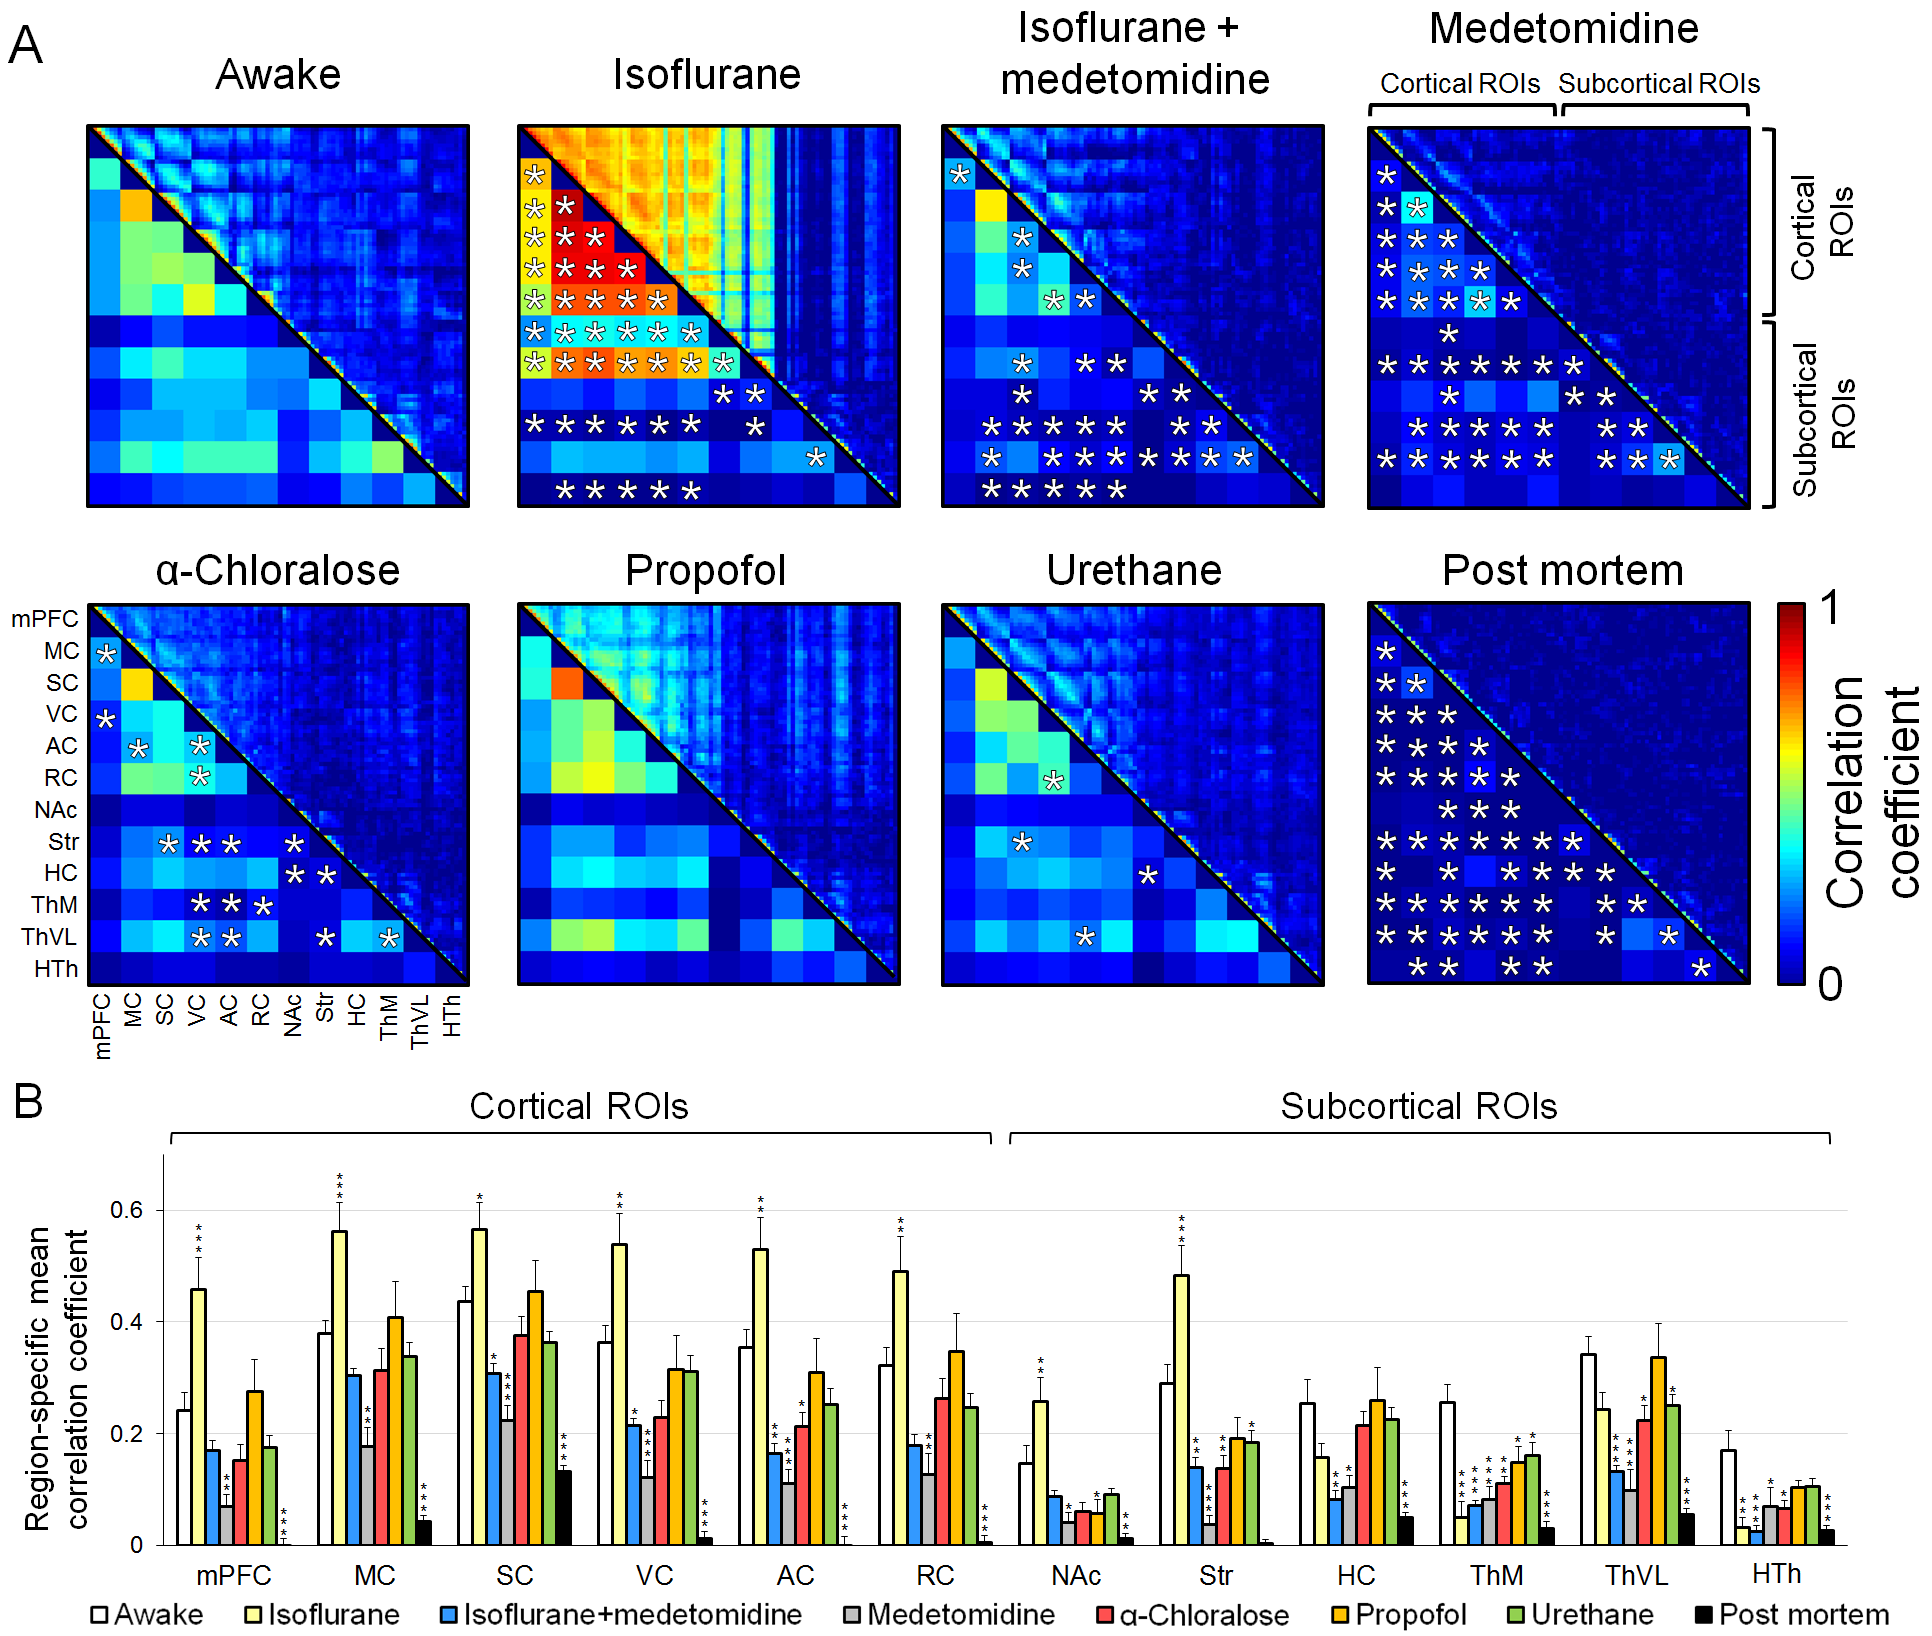
Most preclinical resting-state functional magnetic resonance imaging studies are performed in anesthetized animals, but the confounding effects of anesthesia on the measured functional connectivity (FC) are poorly understood. Therefore, we measured FC under six anesthesia protocols and compared the findings with data obtained from awake rats. Connectivity patterns obtained under propofol and urethane anesthesia were most similar to that observed in awake rats. FC patterns in the α-chloralose and isoflurane-medetomidine combination groups had moderate to good correspondence with that in the awake group. The FC patterns in the isoflurane and medetomidine groups differed most from that in the awake rats.
Introduction
Advances in functional magnetic resonance imaging (fMRI) methods have enabled noninvasive investigations of functional brain networks 1. Importantly, functional connectivity (FC) network structures are observed across species 2, which allows the use of fMRI in controlled preclinical experiments. The majority of preclinical FC experiments are, however, conducted under general anesthesia 3. Anesthetics are likely to disturb neuronal activity, brain metabolism, neurovascular coupling, and FC 4, making it more difficult to determine the effects of disease or treatment on FC. To overcome the confounding effects of anesthetics, fMRI protocols for imaging awake animals have been introduced 5. In these approaches, the animals undergo an 8-10 days habituation protocol, making the method clearly more labor- and time-intensive than the protocols performed under anesthesia. Furthermore, spontaneous movement and stress responses are likely to be present during the imaging. Because both approaches – imaging of either anesthetized or awake subjects – have their advantages and limitations, it is likely that both will remain in use. If the use of anesthesia is unavoidable, it is crucial to characterize the effects of different anesthetics on FC. To our knowledge, no studies have compared FC between awake rats and rats in various anesthetized states. Therefore, we acquired blood oxygenation level dependent (BOLD) FC data from rats under six anesthesia protocols and during the awake state.Methods
The animal procedures were approved by the National Animal Experiment Board. Male Wistar rats were used. The anesthesia groups were the following: α-chloralose (n=9; 60 mg/kg, i.v.), isoflurane (n=8; 1.3 %), medetomidine (n=8; 0.1 mg/kg/h, i.v.), combined isoflurane and medetomidine (n=8; 0.06 mg/kg/h i.v. medetomidine and 0.5-0.6% isoflurane), propofol (n=8; 7.5 mg/kg bolus and 45 mg/kg/h, i.v.), and urethane (n=21; 1.25 g/kg, i.p.). Small cannulas were inserted into femoral artery, and tracheostomy was performed under 2% isoflurane. Mechanical ventilation was adjusted to maintain normal blood gas values. To estimate the influence of noise and drift on FC data, the rsfMRI measurement was repeated in 8 rats 5-10 min after the potassium chloride-induced cardiac arrest. Rest of the rats (n=8) were habituated to the fMRI in a mock scanner at 4 or 8 consecutive days prior to awake imaging. The length of habituation session was gradually increased from 15min to 45min. Breathing, heart rate, movement, weight, and corticosterone levels were followed. The fMRI data (300-750 volumes) were acquired with 7 T Bruker Pharmascan with single-shot spin-echo echo planar imaging (TR 2s, TE 45ms, FOV 2.5x2.5cm2, 64x64 matrix, and 9-11x1.5mm slices). The MRI data were converted to NIfTI (http://aedes.uef.fi), slice-timing corrected, motion-corrected, spatially smoothed, co-registered (SPM8), and band-pass filtered (0.01-0.15Hz). The correlation values between regions of interest were calculated to obtain measures for FC. Graph theory-based complex-network analyses were calculated with Brain Connectivity Toolbox (https://sites.google.com/site/bctnet/), and spectral powers for BOLD signals were calculated by fast-Fourier transform.Results
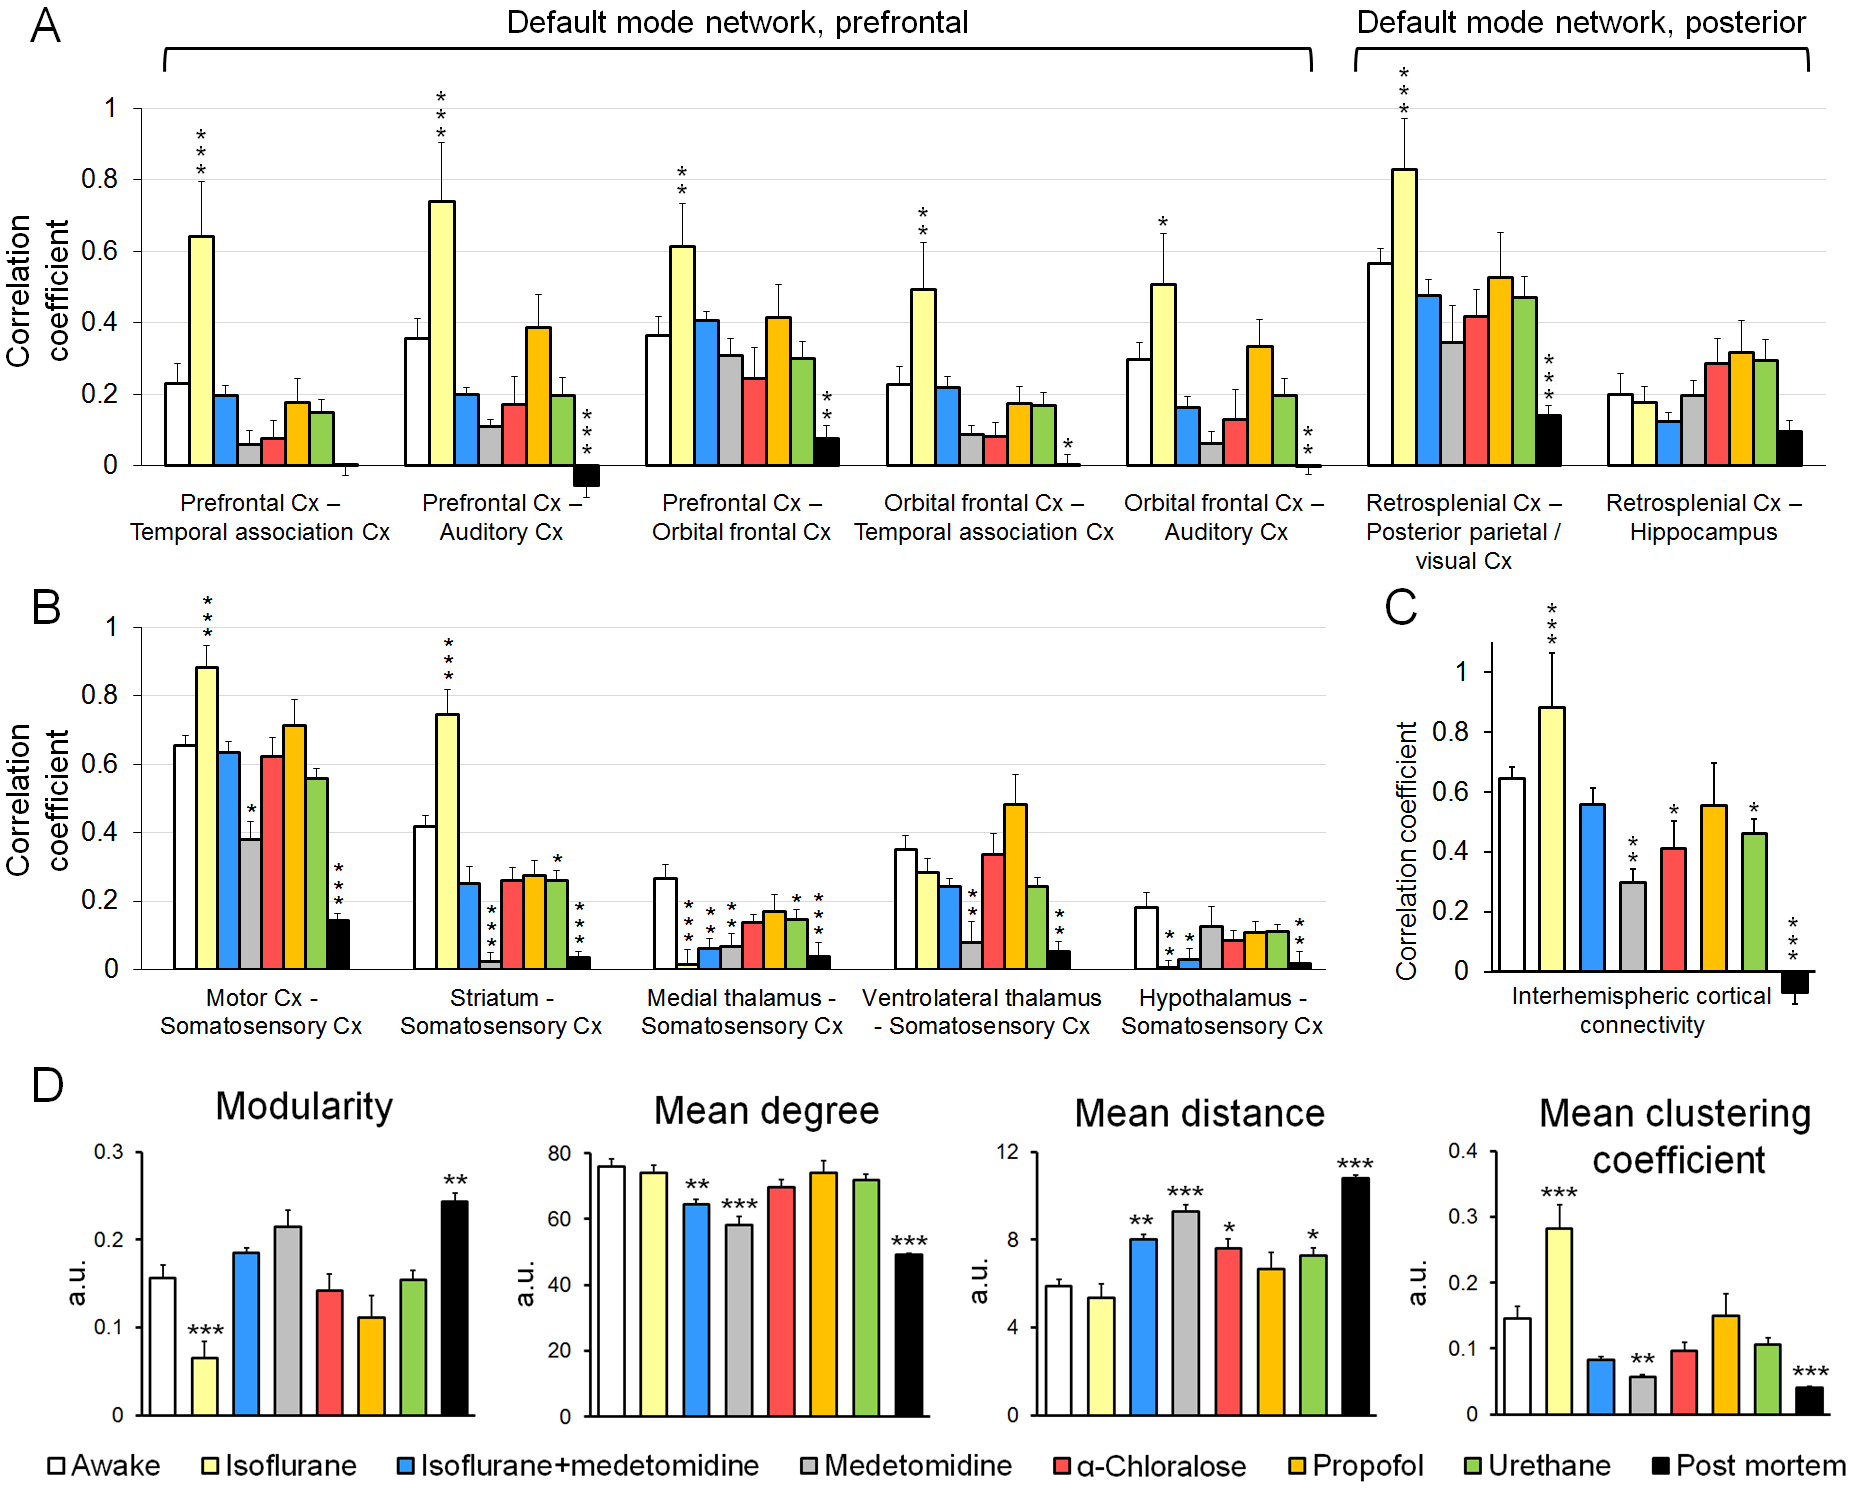
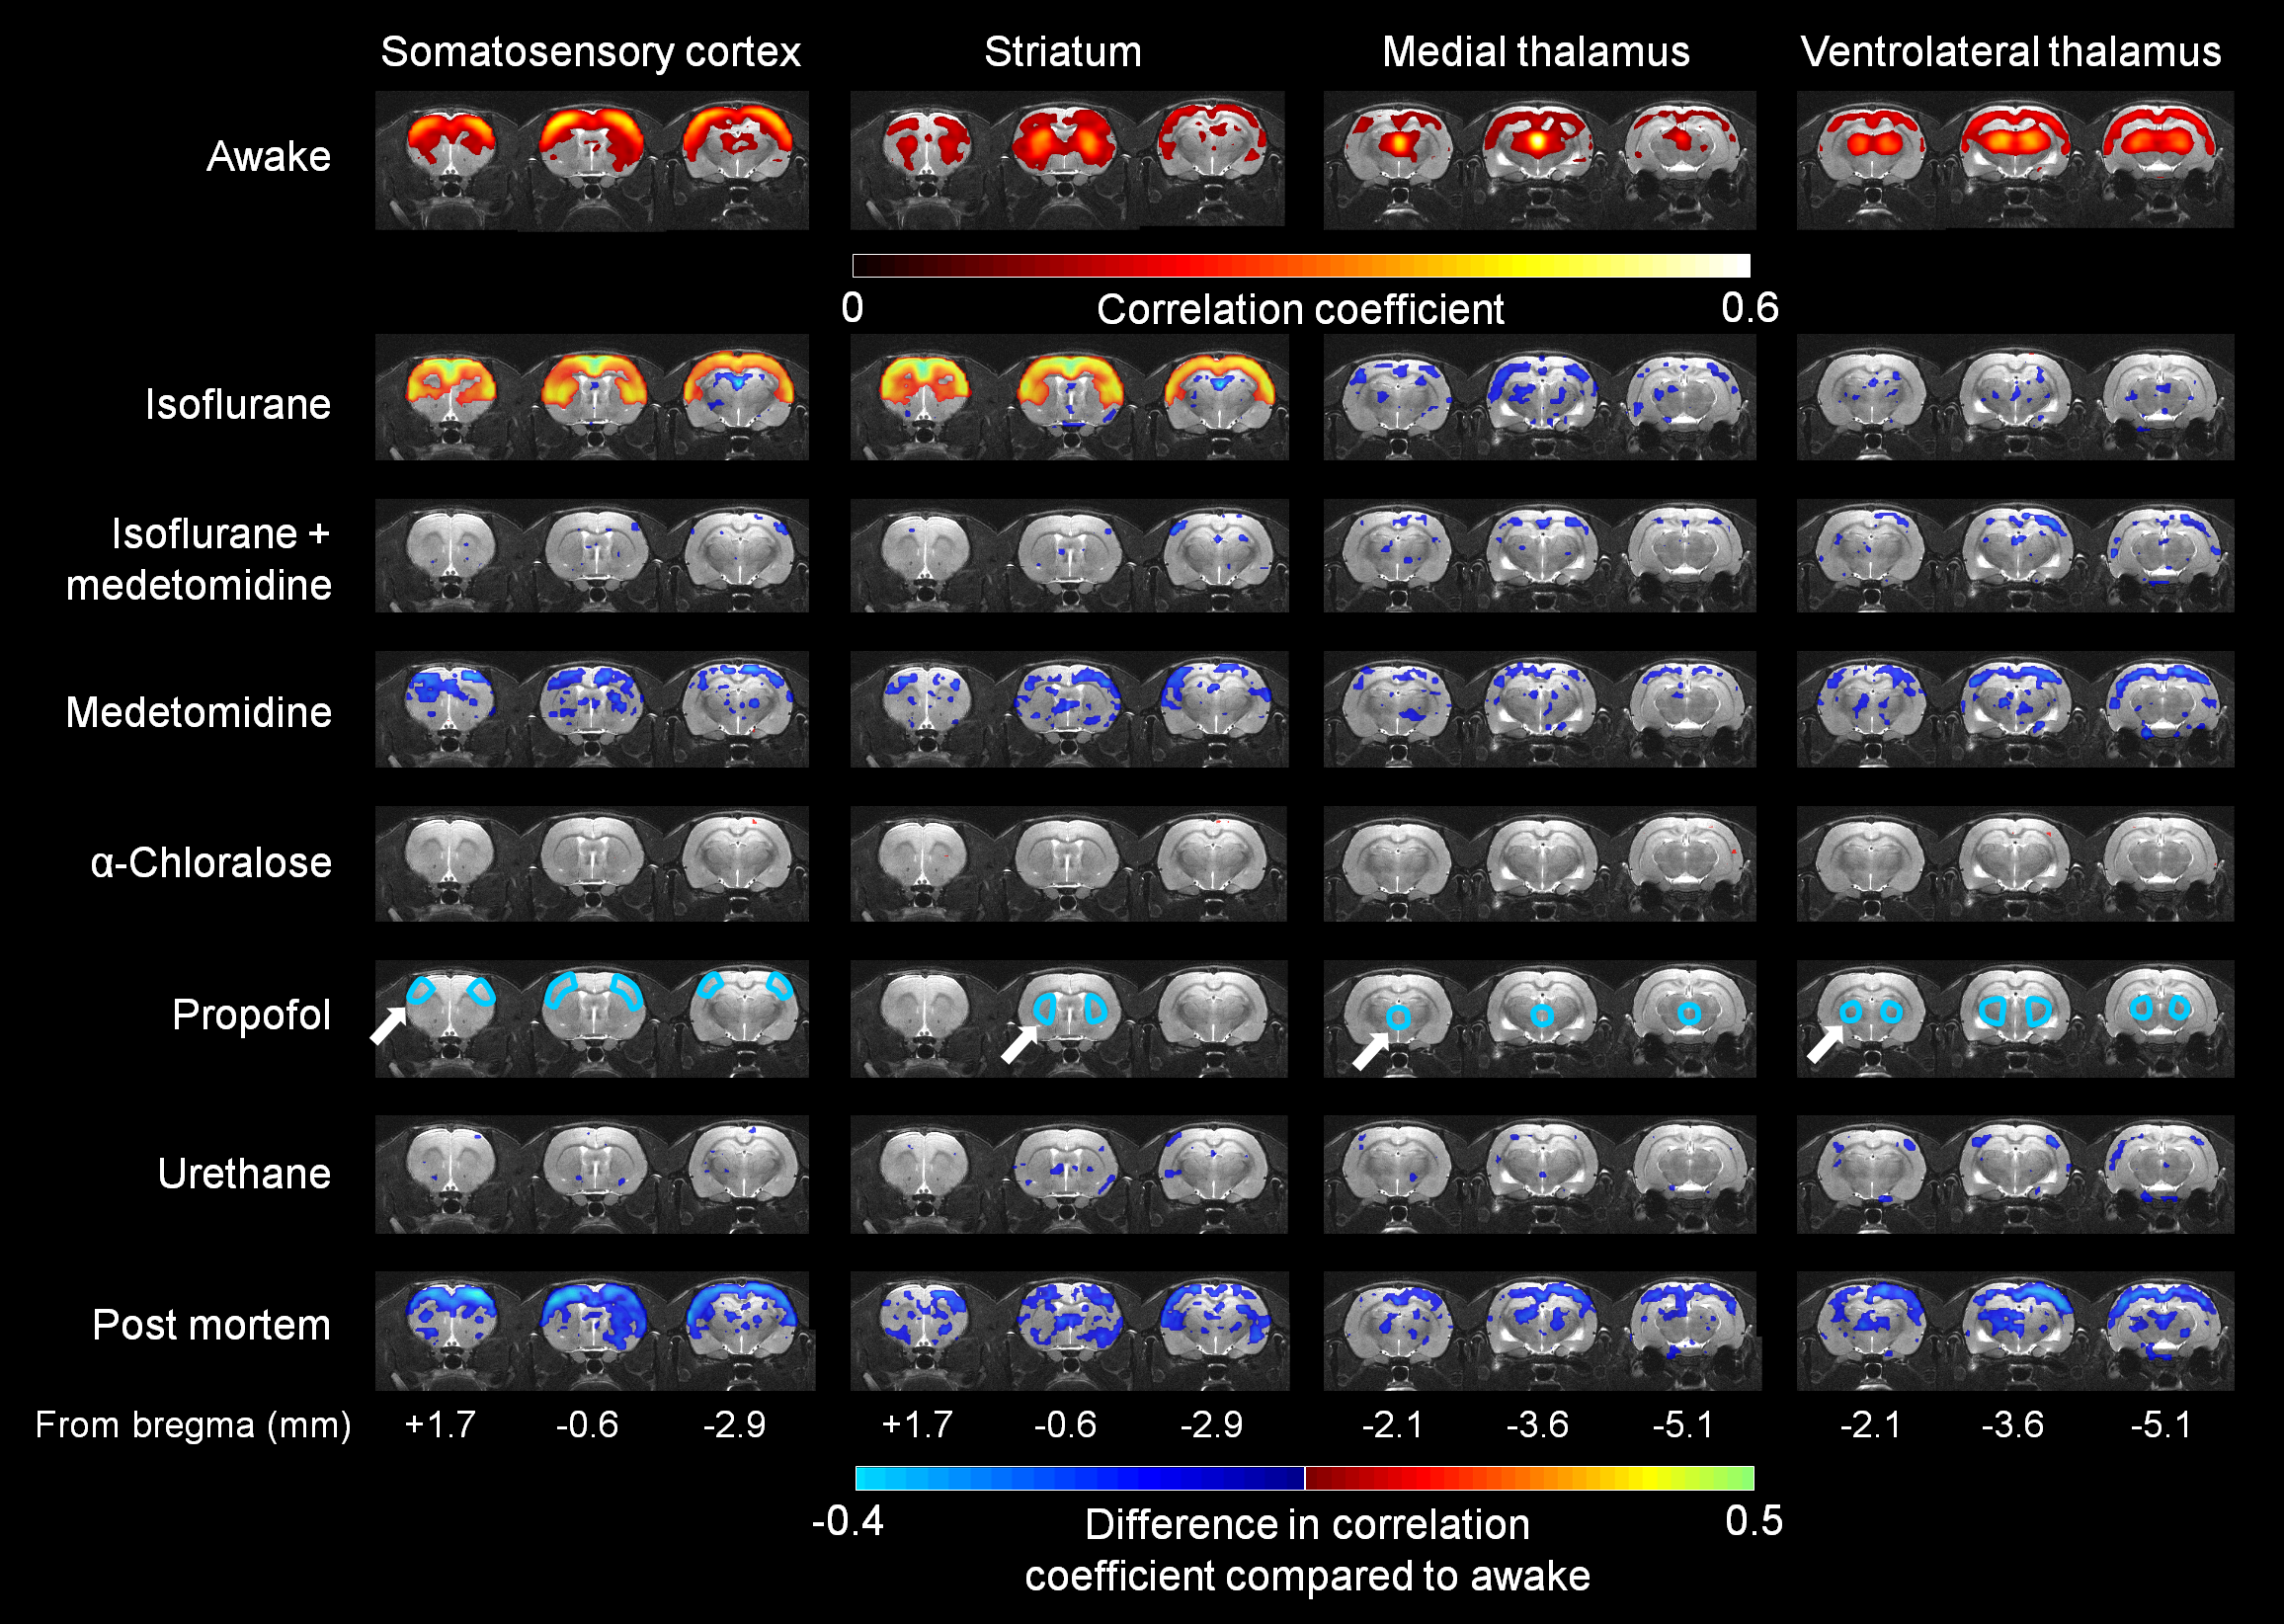
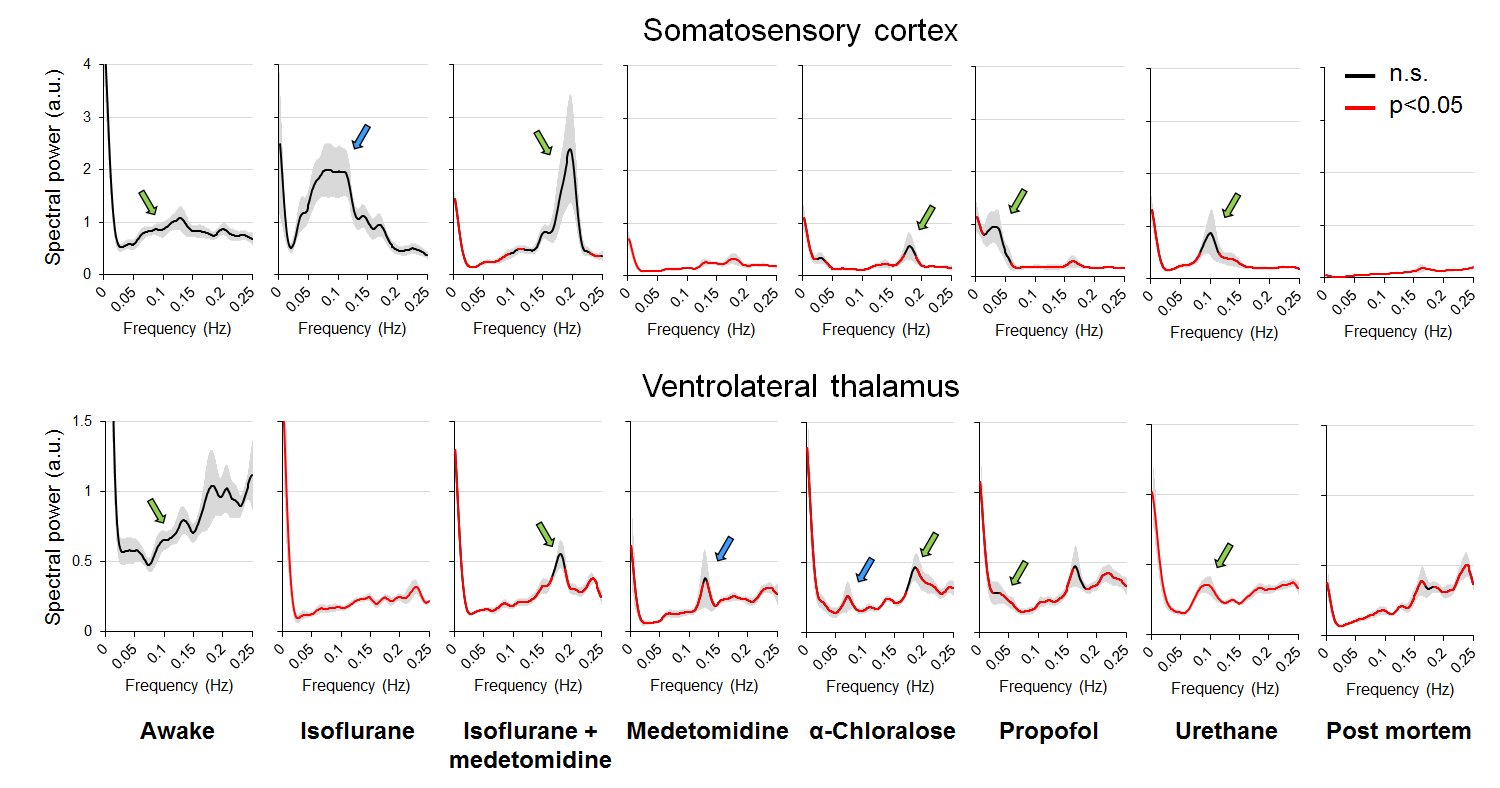
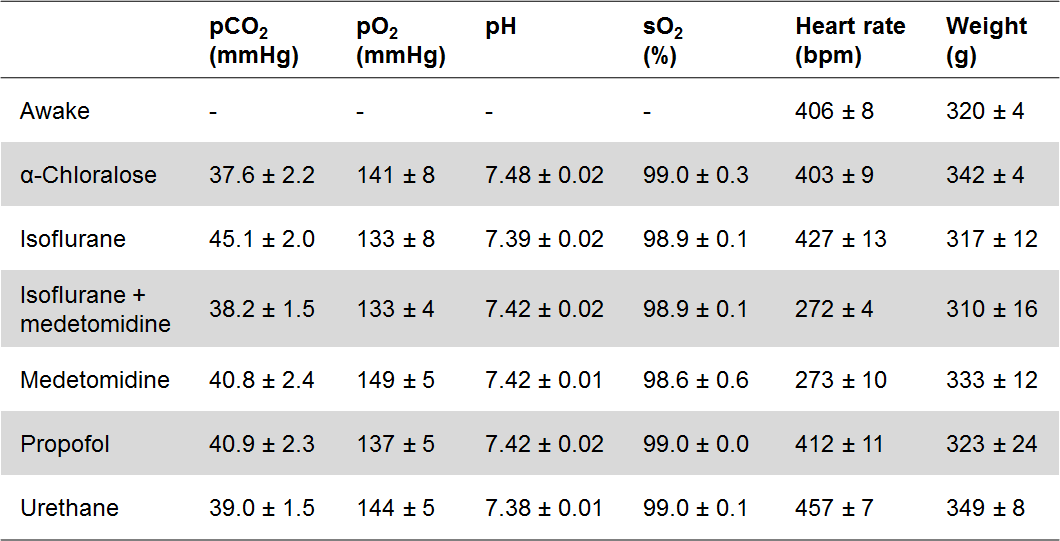
All measured physiologic parameters (Table 1) of anesthetized animals were in the normal range. The blood corticosterone levels measured in the awake rats after the MRI measurements were not statistically different from the pre-habituation samples (p>0.25; paired t-test), indicating successful habituation. The group-level FC matrices are shown in Figure 1A, and the region-specific mean CCs are shown in Figure 1B. The FC of the prefrontal and posterior parts of the rat DMN is shown in Figure 2A. The strength of five representative connections from the somatosensory cortex is shown in Figure 2B. The differences in interhemispheric cortical connectivity between the groups (Figure 2C) closely followed the differences in the mean cortical (Figure 1B) and intracortical connectivities (Figure 2B). The parameters obtained from complex-network analyses are shown in Figure 2D. The representative seed-based connectivity maps obtained from the awake animals, and differences between the awake and anesthetized animals are shown in Figure 3. The group-level spectral powers of BOLD signals, obtained from representative cortical and thalamic regions, are shown in Figure 4.Discussion and conclusions
In summary, the results indicate that the FC properties were uniquely modulated by the different anesthesia protocols, and each of the observed patterns was distinct from that in the awake group. Connectivity parameters obtained under propofol and urethane anesthesia exhibited the fewest differences compared with the awake rats. FC patterns in the α-chloralose and combined isoflurane and medetomidine groups exhibited moderate to good correspondence with the awake group, while FC in the isoflurane and medetomidine groups exhibited the most differences compared with the awake rats. These results, combined with other prior information related to, e.g., the suitability of anesthetics for follow-up or pharmacologic studies, can be directly exploited for rsfMRI study design and data interpretation.Acknowledgements
This work was supported by the Finnish Funding Agency for Technology and Innovation (Tekes, 70036/11) and the Academy of Finland (#298007). In addition, we thank Maarit Pulkkinen for technical assistance with the animal preparationReferences
1. Biswal B, Yetkin FZ, Haughton VM, Hyde JS.
Functional connectivity in the motor cortex of resting human brain using
echo-planar MRI. Magn Reson Med. 1995;34(4):537-541.
2. Lu H, Zou Q, Gu H, Raichle ME, Stein EA, Yang Y. Rat brains also have a
default mode network. Proc Natl Acad Sci U S A. 2012;109(10):3979-3984.
3. Lukasik VM, Gillies RJ. Animal anaesthesia for in vivo magnetic resonance. NMR
Biomed. 2003;16(8):459-467.
4. Gao YR, Ma Y, Zhang Q, et al. Time to wake up: Studying neurovascular
coupling and brain-wide circuit function in the un-anesthetized animal. Neuroimage.
2016.
5. Lahti KM, Ferris CF, Li F, Sotak CH, King JA.
Imaging brain activity in conscious animals using functional MRI. J Neurosci
Methods. 1998;82(1):75-83.
Figures