1115
CBV fMRI study of the olfactory and visual processing in same mice1Merck & Co., Inc., West Point, PA, United States, 2Merck & Co., Inc., Rahway, NJ, United States, 3Merck & Co., Inc., South San Francisco, CA, United States, 4Merck & Co., Inc., Boston, MA, United States
Synopsis
fMRI offers an excellent opportunity to study neural activations in the central nervous system. In this study, cerebral blood volume (CBV) fMRI with USPIO was used to measure simultaneous odorant and visual stimulation-induced neural activations in mice. Olfactory responses were observed in the olfactory bulb, anterior olfactory nucleus (AON), and piriform cortex (PC), while visual responses were observed in the lateral geniculate nuclei, visual cortex, and cingulate cortex. The neural phenomenon of “post-inhibition excitation rebound” was observed in the responses in AON and PC, and the fMRI phenomenon of “post-stimulus undershoot” was observed in the visual responses.
INTRODUCTION
Mice have been widely used in biomedical research because of their genetic similarity to humans, availability of genetically altered strains, and disease models [1, 2]. The full extent of neural processing in the olfactory system and visual system of mice has not been fully observed by fMRI (e.g., no reports about neural activations in the piriform cortex of mice). Cerebral blood volume (CBV) fMRI with the intravascular contrast agent of ultrasmall superparamagnetic iron oxide nanoparticles (USPIO) has a higher sensitivity compared to BOLD fMRI. In this study, CBV fMRI was used to study simultaneous odorant and visual stimulation-induced neural activations in the olfactory and visual systems of mice.METHODS
All animal procedures were approved by our internal IACUC committee. Wild type C57BL/6J mice (n=8) were studied. Anesthetics: isoflurane (0.3%) + dexmedetomidine (0.4mg/kg bolus + 0.8mg/kg/hour infusion) + ketamine (16mg/kg/hour). MRI: 7T Bruker Biospec system. Coils: 2-cm receive-only surface coil + 72-mm transmit volume coil. fMRI data was acquired by single-shot GE EPI; matrix size=64×64; TE=11ms; FOV=2×2cm2. fMRI slice selection: sixteen consecutive coronal slices covering from the rostral edge of olfactory bulb to the caudal edge of visual cortex. Odorant stimulation: isoamyl acetate (2870 ppm). Visual stimulation: 100 Watt light bulb with 1-sec on and 1-sec off. Each fMRI measurement includes 40-sec baseline, 40-sec stimulation, and 80-sec recovery (Fig. 1A). For each mouse, the olfactory fMRI and visual fMRI were interleaved (Fig. 1B), and twenty fMRI measurements were performed during a 1-h experimental session. USPIO (5mg/ml, 20mg/kg, 4ml/kg) was injected through tail vein during the preparation. The EPI images from each mouse were registered to template images. The data from the olfactory fMRI measurements and visual fMRI measurements of all animals were averaged to map the respective fMRI activations (p<0.01, cluster size=4).RESULTS
Odorant stimulation induced fMRI activations in the olfactory bulb (OB), anterior olfactory nucleus (AON), and piriform cortex (PC) (Fig. 2A). Visual stimulation induced fMRI activations in the visual cortex, lateral geniculate nuclei (LGN). Interestingly, cingulate cortex also shows activations during the visual stimulation (Fig. 2B). The temporal characteristics of the CBV fMRI responses to repeated odorant stimuli were examined. Figs. 3A, 3C, and 3E show the time courses of the fMRI signals for the ten olfactory fMRI measurements in the OB, AON, and PC, respectively. Robust CBV responses were observed for all the ten odor stimulations in all three structures. For each structure, the amplitudes of the CBV responses to the repeated odor stimulations were similar, indicating that the olfactory responses do not exhibit a significant adaptation effect in these structures of mice during the repeated stimulations. The lack of adaptation in the OB observed in mice is similar to the observation in NHPs [3]. Similar to olfactory response, the temporal characteristics of the CBV responses to repeated visual stimuli in the activated visual structures were examined. Figs. 3B, 3D, and 3F show the time courses of the fMRI signals for the ten visual fMRI measurements in the visual cortex, lateral geniculate nucleus, and cingulate cortex, respectively. The visual responses in these structures also do not exhibit a significant adaptation effect in mice. The temporal patterns of the CBV responses during stimulations were examined by averaging the time courses from the respective 10 olfactory or visual fMRI measurements for each mouse. Fig. 5 shows the time courses from each individual animal. For the olfactory responses, the temporal pattern in the OB is similar to the observations in the OB of monkeys [3] and rats [4], and no response attenuation during the continuous 40-sec stimulation. In the AON and PC, two peaks are observed with a prominent initial peak following odor onset and a second peak following odor offset. The first peak indicates fast adaption during odor stimulation, and the second peak is caused by “post-inhibition excitation rebound.” A similar two-peak pattern has been observed in the olfactory response of piriform cortex neurons in rats by electrophysiology recordings [5]. For the visual responses, while the temporal pattern during the stimulation is similar to previous observations in the visual cortex of cats [6], post-stimulus undershoots can be observed in all the three structures.Conclusion
The novel findings of this study are: 1) the olfactory response in the AON and PC cortex in mice can be robustly observed by fMRI and 2) the visual response is observed in more regions than previous reports in rodents. CBV fMRI with its higher sensitivity should be a valuable technique to investigate the effects of biology interventions on the neural processing in mice.Acknowledgements
No acknowledgement found.References
1. Nair, G. and T.Q. Duong, Echo-planar BOLD fMRI of mice on a narrow-bore 9.4 T magnet. Magn Reson Med, 2004. 52(2): p. 430-4.
2. Schroeter, A., et al., Specificity of stimulus-evoked fMRI responses in the mouse: the influence of systemic physiological changes associated with innocuous stimulation under four different anesthetics. Neuroimage, 2014. 94: p. 372-384.
3. Zhao, F., et al., Functional imaging of olfaction by CBV fMRI in monkeys: insight into the role of olfactory bulb in habituation. Neuroimage, 2015. 106: p. 364-72.
4. Zhao, F., et al., fMRI study of olfaction in the olfactory bulb and high olfactory structures of rats: Insight into their roles in habituation. Neuroimage, 2016. 127: p. 445-55.
5. Wilson, D.A., Habituation of odor responses in the rat anterior piriform cortex. J Neurophysiol, 1998. 79(3): p. 1425-40.
6. Zhao, F., et al., Sources of phase changes in BOLD and CBV-weighted fMRI. Magn Reson Med, 2007. 57(3): p. 520-7.
Figures
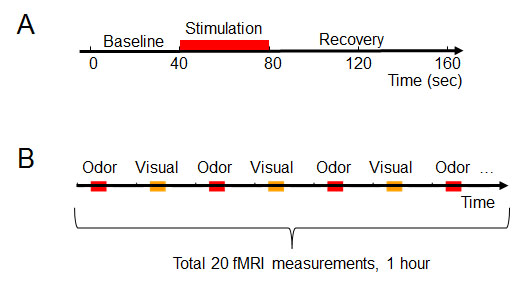
Fig. 1. Experiment design.
(A) Each fMRI measurement includes 40-sec baseline, 40-sec stimulation, followed by 80-sec recovery.
(B) Twenty fMRI measurements were performed for each animal during a 1-h experimental session. The olfactory fMRI measurements and visual fMRI measurements were interleaved. Red bars: odor stimuli. Orange bars: visual stimuli.
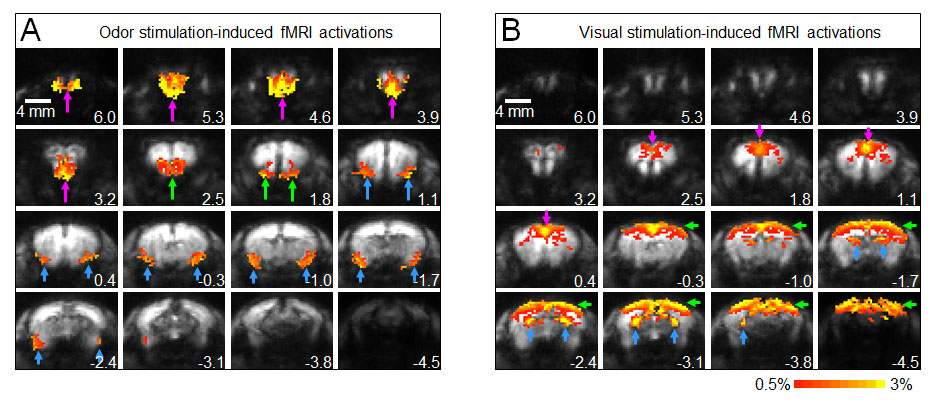
Fig. 2. Odorant and visual stimulation-induced CBV fMRI activations in mice. The numbers in the corner of each image represent anterior-posterior coordinates with respect to bregma.
(A) Odor stimulation-induced fMRI activations. Activations (red/yellow) are in the olfactory bulb (OB, purple arrows), anterior olfactory nucleus (AON, green arrows), and piriform cortex (PC, blue arrows).
(B) Visual stimulation-induced fMRI activations. Activations (red/yellow) are in the visual cortex (VC, green arrows), lateral geniculate nucleus (LGN, blue arrows), and cingulate cortex (purple arrows).
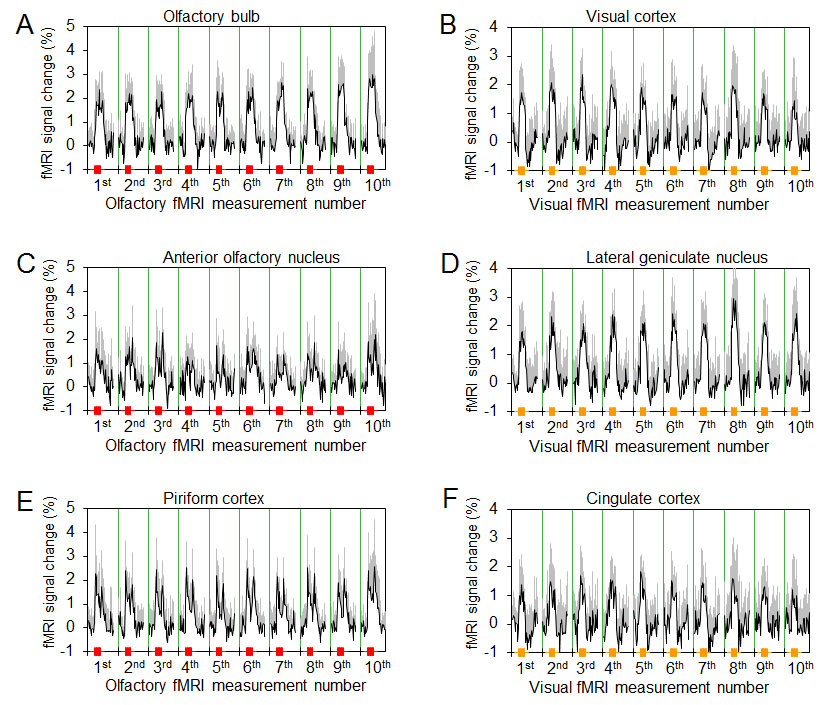
Fig. 3. Stability of olfactory and visual fMRI activations over different olfactory and visual fMRI measurements.
(A, C, and E) The averaged time course over different mice for the ten olfactory fMRI measurements (Mean ± std, n=8). Red bars: 40-sec odor stimuli.
(B, D, and F) The averaged time course over different mice for the ten visual fMRI measurements (Mean ± std, n=8). Orange bars: 40-sec visual stimuli.
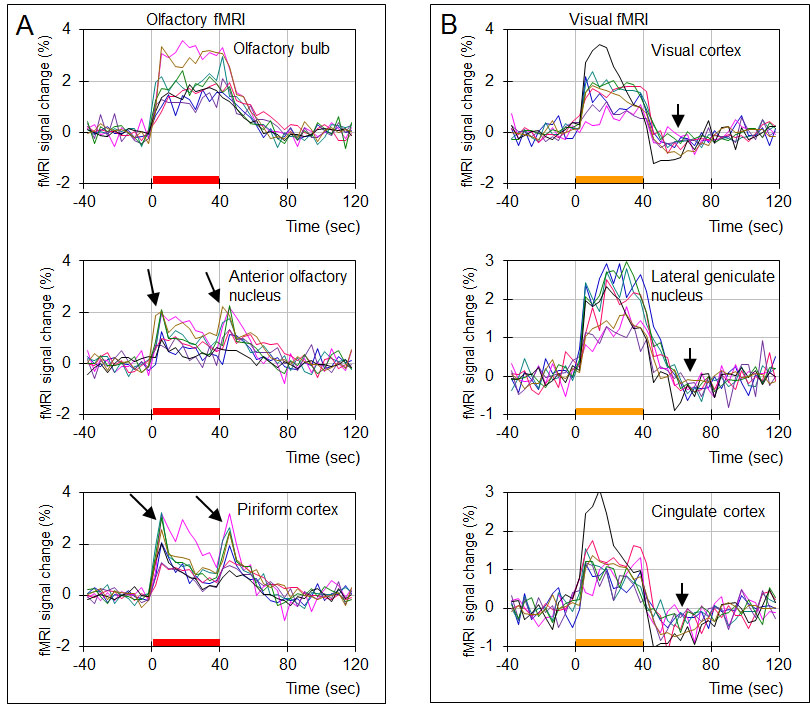
Fig. 4. Temporal patterns of the CBV fMRI responses to odor (A) and visual (B) simulations for each individual mice. Different colors represent different animals. Red bars in (A): 40-sec odor stimulation. Orange bars in (B): 40-sec visual stimulation.
(A) In the OB, the olfactory fMRI response sustains during stimulation. In AON and PC, the responses show two peaks with one following onset of stimulation and the other following offset of stimulation (indicated by black arrows).
(B) The temporal patterns of visual responses in all the three structures show post-stimulus undershoot (indicated by black arrows).