1114
Simultaneous fMRI and multispectral fiber-photometry for concurrent triple-modality measurement of genetically encoded calcium activity, CBV and BOLD1Biomedical Research Imaging Center and Department of Neurology, The University of North Carolina at Chapel Hill, Chapel Hill, NC, United States, 2Neurobiology Laboratory, National Institute of Environmental Health Sciences, NIH, RTP, NC, United States
Synopsis
We demonstrate the experimental setup and the use of multispectral fiber-photometry during fMRI in vivo for concurrent measurements of GCaMP6f, CBV, and BOLD. The fluorescent intensity of GCaMP6f and Rhodamine B, a red fluorescent dye which represents CBV, increased during spontaneous motion in the freely moving animal. GCaMP6f, CBV, and BOLD increased when forepaw electric stimulation was given in the simultaneous fMRI and fiber-photometry. We conclude that simultaneous multispectral fiber-photometry and functional MRI is a powerful tool which has an advantage in both temporal and spatial dimensions. Rhodamine B could be a surrogate CBV indicator in the regions of interest.
Introduction
Our interpretation of BOLD fMRI data is built on the assumption that neuronal and vascular responses are tightly coupled.1,2 At present, one major barrier towards a more accurate interpretation of BOLD is that neurovascular coupling is not uniform in the brain.3,4 Recent advent of genetically encoded calcium indicators such as GCaMP have opened up a new avenue to examine genetically defined cellular activity during fMRI5-8, shedding important lights into the neurovascular coupling mechanisms. To further advance the field, we developed a multispectral fiber-photometry platform9,10 that has impeccable MR-compatibility. This approach allows triple-modality measurement of GCaMP6f, cerebral blood volume (CBV), and BOLD simultaneously. Here we demonstrate the experimental setup and the use of such platform during fMRI in vivo.Methods
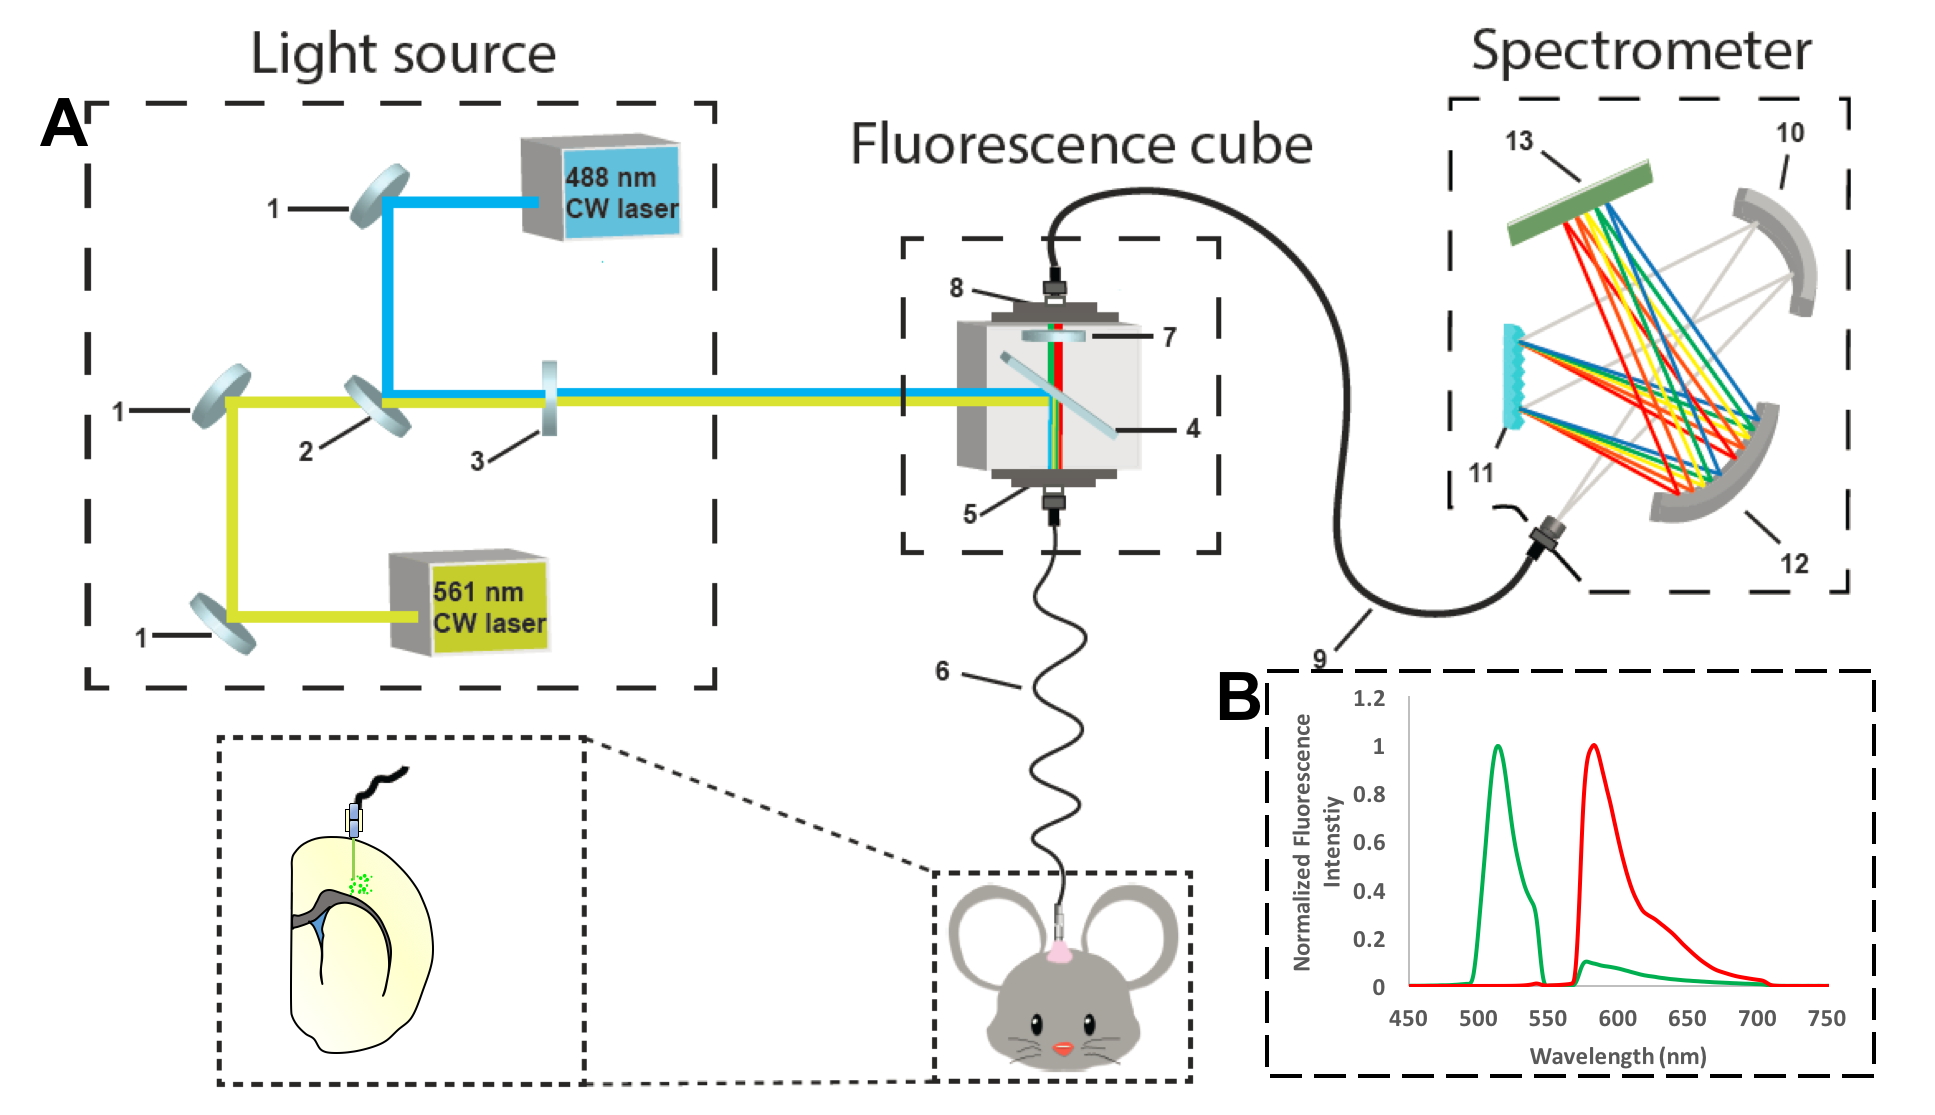
Spectrally resolved fiber-photometry platform (Fig. 1A). The laser beams from a 488nm and a 561nm laser are aligned and combined before they are launched into the fluorescence cube, in which the combined laser beams are reflected by a dichroic mirror and launched into the 200μm core MR-compatible fiber patch cable. The ceramic ferrule at the distal end of the patch cable is connected to an MR-compatible, implantable optical fiber in the rat’s brain. The emission fluorescence collected from the fiber travels back along the patch cable, through the dichroic mirror, an emission filter in the fluorescence cube, and is launched into the 200μm core AR-coated patch cable, which is connected to the spectrometer. Inside the spectrometer, the emission light is collimated, grated, and refocused onto a linear CCD array. Continuous spectral data were sent to the nearby workstation for post-processing. Animals and surgery: Ten Sprague-Dawley rats (~ 455g) were used in the current study. AAV9-CaMKIIα-GCaMP6f-WPRE-SV40 was injected either in the primary motor cortex (Group 1, n=5) or somatosensory cortex (Group 2, n=5). After 4-5 weeks to allow virus incubation, the optic fibers were implanted under the guidance of the real-time photometry. Recording was started at least one week after the fiber implantation. For photometry-based CBV measurements, Rhodamine B isothiocyanate–Dextran, a red fluorescent vascular dye, was injected through the tail vein (40mg/kg). Group 1 rats received multispectral fiber-photometry recording of neuronal (GCaMP6f on CaMKIIα-expressing excitatory neurons) and vascular (Rhodamine B) responses in a freely moving condition. Group 2 rats were sent into the MR scanner for simultaneous photometry and fMRI study, where forepaw electrical stimulation was given. MRI: All MRI data were collected in a Bruker BioSpec 9.4T animal MRI system with a custom-built surface coil. Each rat was ventilated with 0.5% isoflurane and medical air. Intraperitoneal infusion of dexmedetomidine (0.05mg/kg/hr) and pancuronium bromide (0.5mg/kg/hr) were given for the duration of scan. A single-shot GE-EPI sequence (BW: 180kHz, TR/TE= 1000/14ms, matrix=80x80) was used for BOLD fMRI.Results
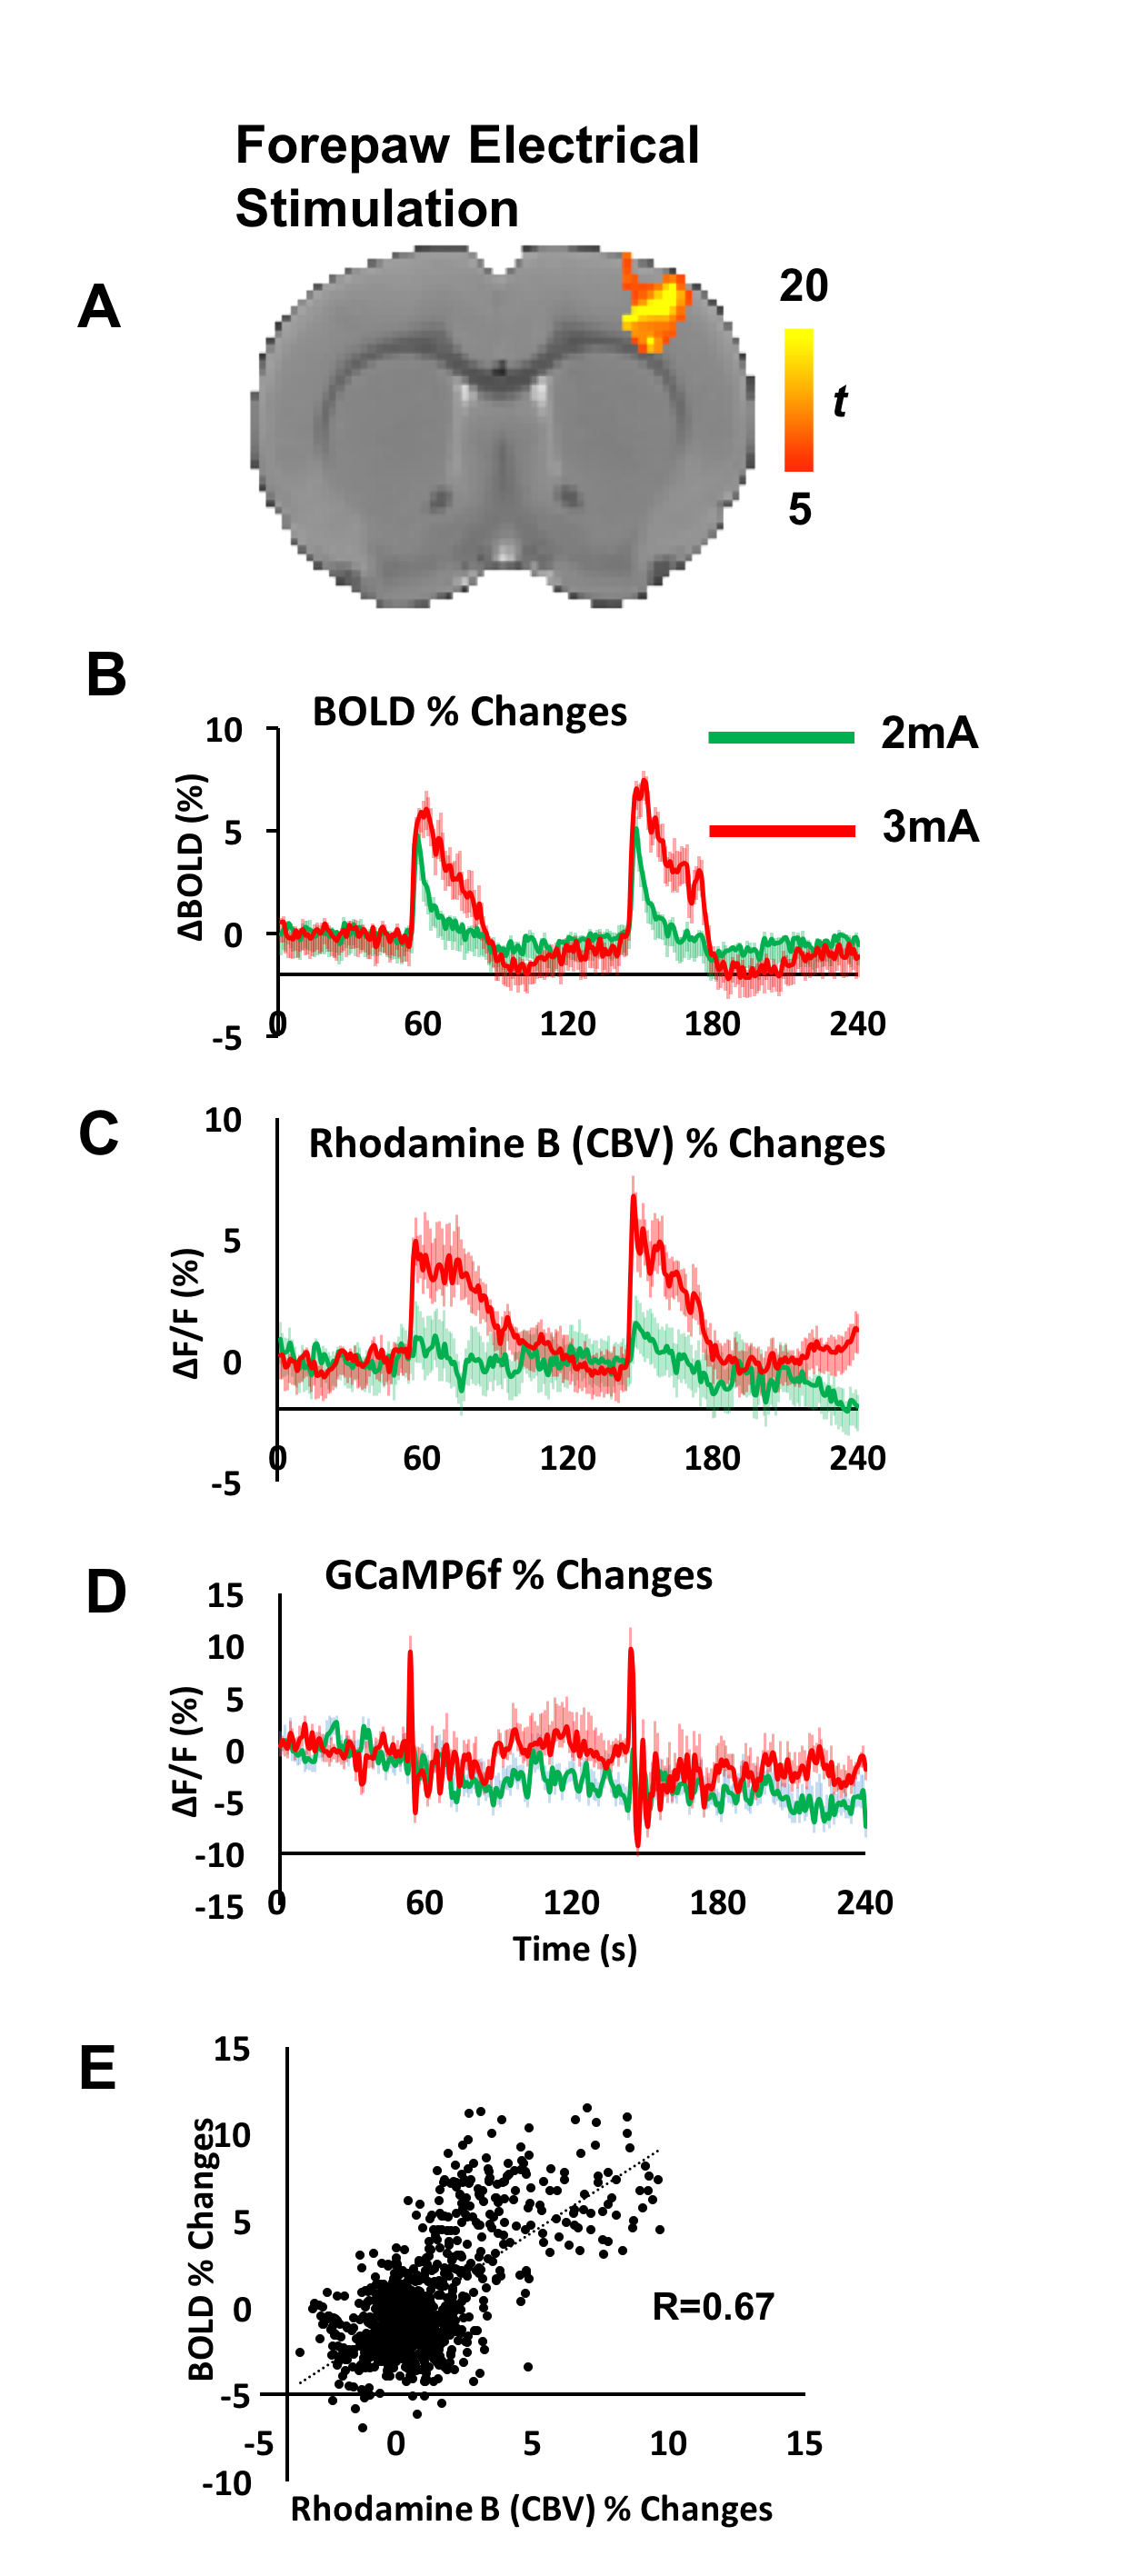
Fig. 2A demonstrates that GCaMP6f and Rhodamine B emission signals are detected in distinct optical spectrum, thus calcium activity and CBV can be evaluated independently. In Group 1, both GCaMP6f and Rhodamine B signal increased when the rat had spontaneous motion (Fig. 2B). Rhodamaine B and GCaMP6f signals are highly correlated (Fig. 2C). This experiment demonstrates the feasibility of this tool to assess cell-type specific neurovascular coupling in freely moving animals. In Group 2, robust activation was reliably detected in the S1 area in response to forepaw electrical stimulation (Fig. 3A, B). CBV measured by Rhodamine B increased significantly during the stimulation (Fig. 3C). GCaMP6f signal showed transient increase at the beginning of the stimulation at this particular recording site (Fig.3D). We found robust correlations between BOLD fMRI and fiber-photometry CBV signals (Fig.3E). The correlation between the BOLD time course and Rhodamine B time course is linearly related to the distance from the fiber tip. The closer to the fiber tip, the stronger the correlation between two time-courses could be.Discussion/Conclusion
Our study implies broad application of multispectral fiber-photometry during fMRI. By expressing fluorescent indicators in a cell type-specific fashion and injecting fluorescent vascular dye, this platform allows us to study neurovascular coupling in awake behaving animal subjects. When using this platform concurrently with fMRI, we expect our approach represents a novel means to guide fMRI noise removal or bridge the data across different spatial and temporal scales by offering macroscopic network connectivity with real-time mesoscopic cellular activity.Acknowledgements
We thank members of the Shih lab for valuable discussions concerning the studies described in this abstract. Our team is supported by NIMH R01MH111429, R41MH113252, R21 MH106939, NINDS R01NS091236, NIAAA U01AA020023, R01AA025582, NICHD U54HD079124, American Heart Association 15SDG23260025, and Brain & Behavior Research Foundation.References
1 Hillman, E. M. Coupling mechanism and significance of the BOLD signal: a status report. Annual review of neuroscience 37, 161-181, doi:10.1146/annurev-neuro-071013-014111 (2014).
2 Logothetis, N. K. What we can do and what we cannot do with fMRI. Nature 453, 869, doi:10.1038/nature06976 https://www.nature.com/articles/nature06976 - supplementary-information (2008).
3 Devonshire, I. M. et al. Neurovascular coupling is brain region-dependent. NeuroImage 59, 1997-2006, doi:10.1016/j.neuroimage.2011.09.050 (2012).
4 Mishra, A. M. et al. Where fMRI and Electrophysiology Agree to Disagree: Corticothalamic and Striatal Activity Patterns in the WAG/Rij Rat. The Journal of Neuroscience 31, 15053-15064, doi:10.1523/jneurosci.0101-11.2011 (2011).
5 Schmid, F. et al. Assessing sensory versus optogenetic network activation by combining (o)fMRI with optical Ca2+ recordings. Journal of cerebral blood flow and metabolism : official journal of the International Society of Cerebral Blood Flow and Metabolism 36, 1885-1900, doi:10.1177/0271678x15619428 (2016).
6 Schwalm, M. et al. Cortex-wide BOLD fMRI activity reflects locally-recorded slow oscillation-associated calcium waves. eLife 6, doi:10.7554/eLife.27602 (2017).
7 Liang, Z., Ma, Y., Watson, G. D. R. & Zhang, N. Simultaneous GCaMP6-based fiber photometry and fMRI in rats. Journal of neuroscience methods 289, 31-38, doi:10.1016/j.jneumeth.2017.07.002 (2017).
8 Albers, F., Wachsmuth, L., van Alst, T. M. & Faber, C. Multimodal Functional Neuroimaging by Simultaneous BOLD fMRI and Fiber-Optic Calcium Recordings and Optogenetic Control. Molecular Imaging and Biology, doi:10.1007/s11307-017-1130-6 (2017).
9 Cui, G. et al. Concurrent Activation of Striatal Direct and Indirect Pathways During Action Initiation. Nature 494, 238-242, doi:10.1038/nature11846 (2013).
10 Cui, G. et al. Deep brain optical measurements of cell type-specific neural activity in behaving mice. Nature protocols 9, 1213-1228, doi:10.1038/nprot.2014.080 (2014).
Figures