1113
Focused ultrasound-mediated disruption of the blood-brain barrier for targeted delivery of neurotransmitters to the rat brain1Brigham and Women's Hospital, Boston, MA, United States, 2Boston Children's Hospital, Boston, MA, United States, 3Harvard Medical School, Boston, MA, United States
Synopsis
Here we present a novel approach to non-invasive neuromodulation that affects neuronal activity by delivering neurotransmitter chemicals to targeted areas of the brain. This is achieved by using focused ultrasound to open the blood-brain barrier in a targeted brain region such that a systemically injected neuroactive chemical will enter into the brain parenchyma only at the intended site. We demonstrate the proof of concept in a rodent model by delivering GABA to the somatosensory cortex to suppress activation from hindpaw stimulation, and by delivering glutamate to the thalamus to enhance activation downstream in the cortex from hindpaw stimulation.
Introduction
Neuromodulatory techniques such as optogenetics1 and chemogenetics2,3 have been successfully integrated with functional MRI in animal models for use as a research tool to study brain function. We previously presented a novel approach to neuromodulation that uses non-invasive focused ultrasound (FUS) to transiently disrupt the blood-brain barrier (BBB) for targeted delivery of neuroactive substances4,5. This current work presents new data in the same framework of delivering a neurotransmitter (GABA or glutamate) to a targeted region in the rat brain and using fMRI to show that it can modulate the functional response to an external stimulus.Methods
Functional activation was assessed in Sprague-Dawley rats undergoing hindpaw stimulation. For N=7 rats, the right somatosensory cortex was targeted for GABA delivery with the expectation of suppressing activation; for N=1 rats, the left thalamus was targeted for glutamate delivery with the expectation of enhancing activation.
Stimulation: Bilateral hindpaw electrical stimulation (4 mA, 0.3 ms duration, 6 Hz) for activation of the somatosensory network. Rats were under light anesthetic sedation using Dexdormitor (0.4 mg/kg bolus followed by subcutaneous infusion as needed) and light isoflurane (0.25%) with respiratory rate monitored throughout6,7.
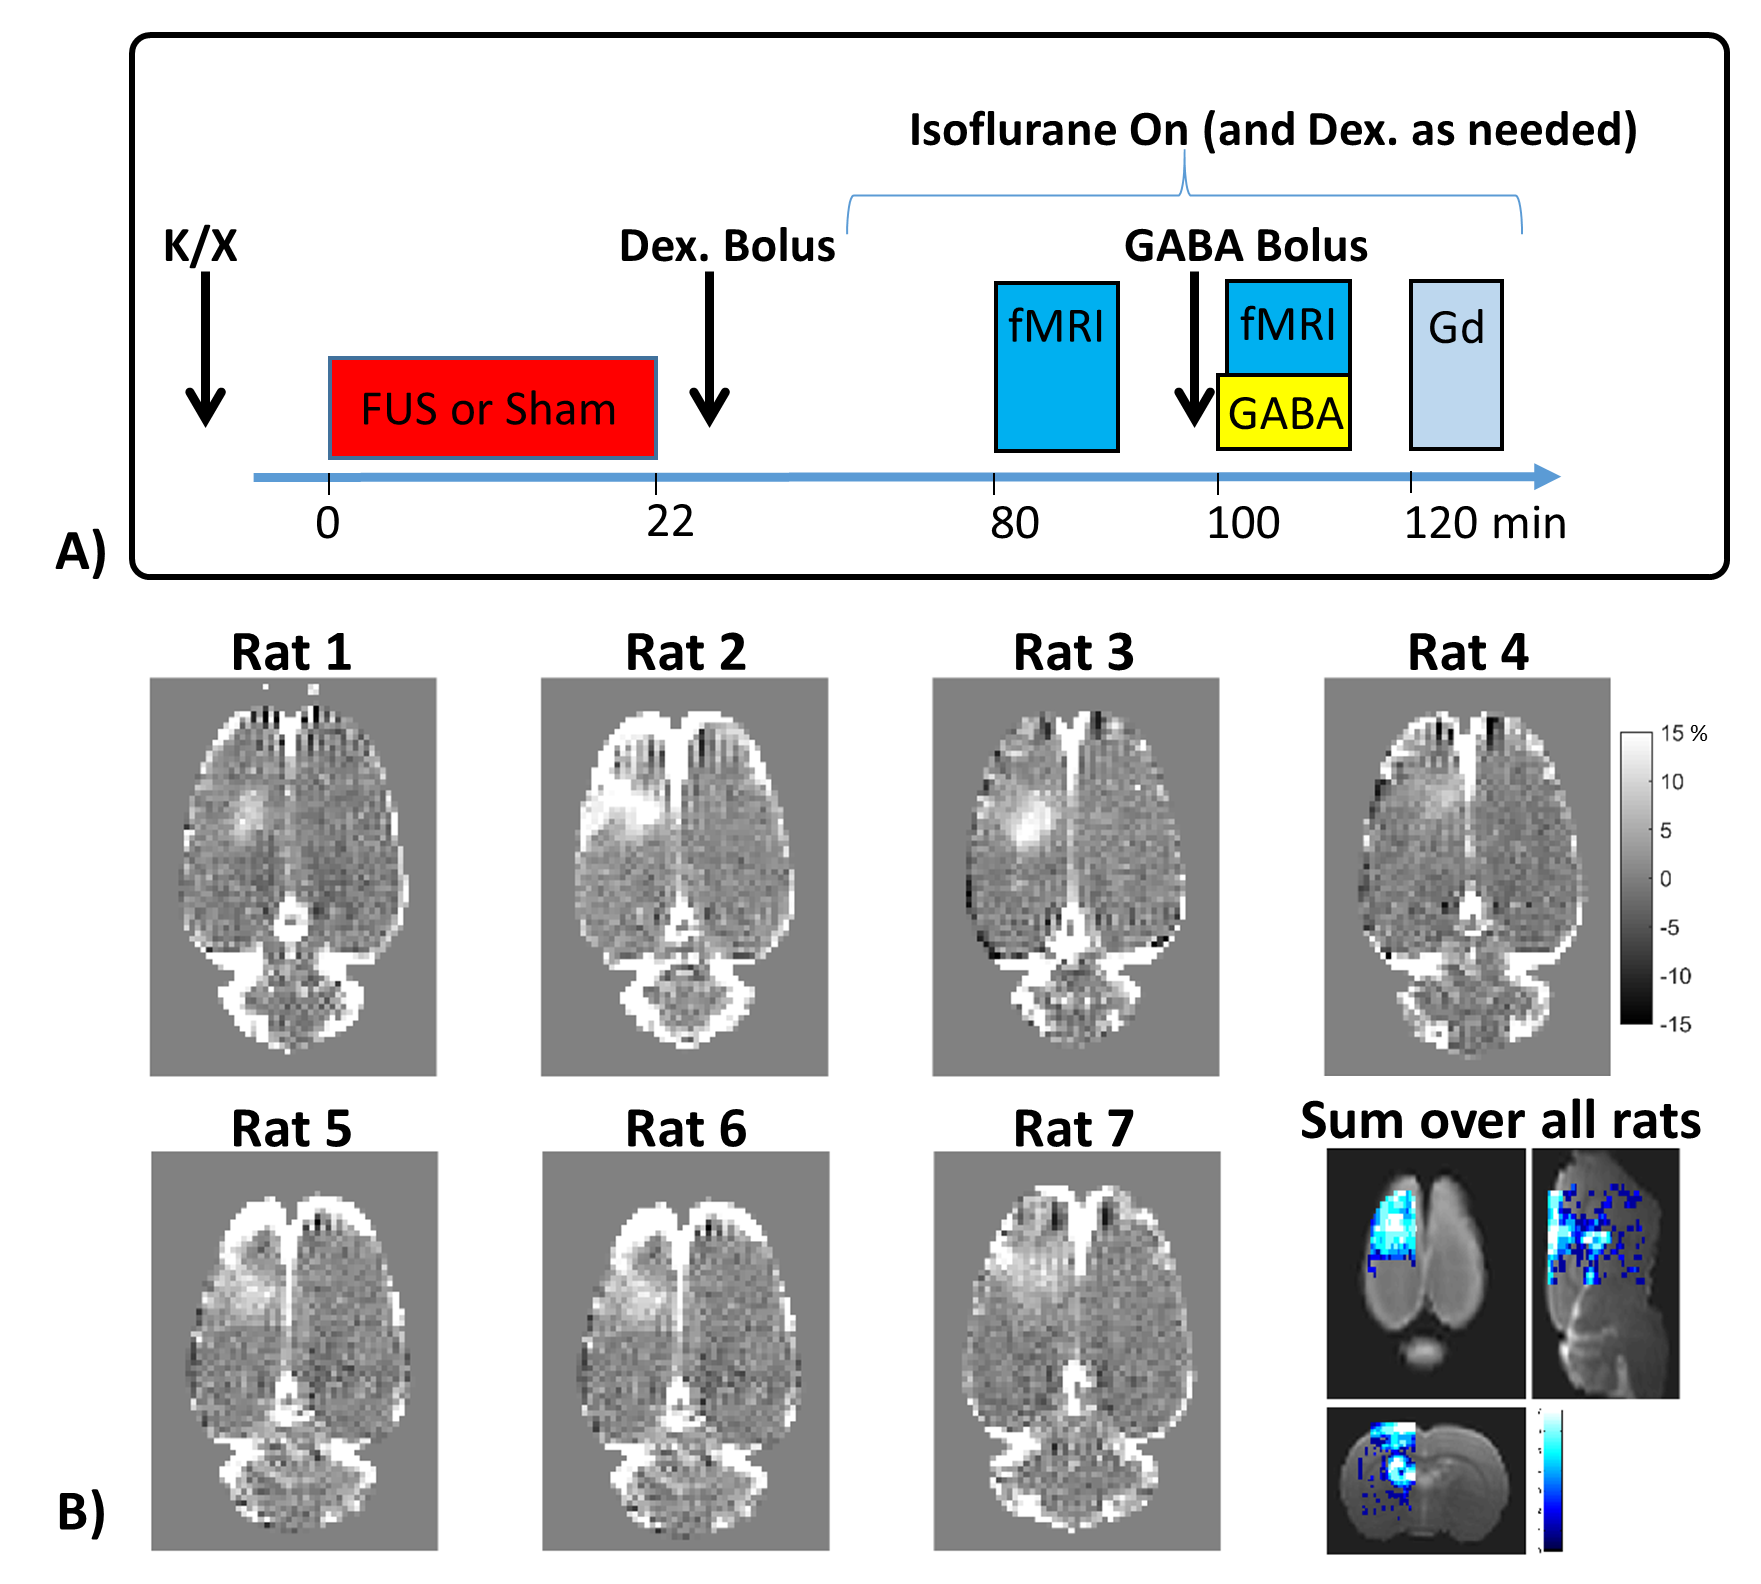
BBB opening: Rats underwent both actual and sham BBB opening on separate days. BBB disruption was targeted to the specified region in one hemisphere only. Microbubbles were injected (Optison, 200 μl/kg) and 690 kHz transcranial FUS was applied using 10 ms bursts at 1 Hz for 120 seconds. The extent and location of BBB opening were evaluated after the fMRI sessions with T1-weighted Gadolinium contrast imaging.
GABA/Glutamate delivery: Systemic tail vein injection of GABA/glutamate was delivered as a 50 mg/kg bolus immediately before imaging plus a 50 mg/kg continuous infusion during imaging.
fMRI: Rats underwent four total fMRI runs, two during the sham BBB day and two during the actual BBB opening day. Images were acquired on a Bruker 7T scanner with a single shot EPI sequence (TR = 1.5 s, TE = 18 ms, 18 slices, 0.5 x 0.5 x 1.0 mm resolution, 300 images). Stimulation was performed in a 40 s OFF, 20 s ON block design over 7.5 minutes. Data were processed using SPM12 with realignment, coregistration to a T2w anatomical image, normalization to a common space, and Gaussian filter spatial smoothing (0.8 x 0.8 x 0.8 mm FWHM). Activation in response to the stimulus was measured using percent change in the BOLD signal from ROIs covering the left and right S1HL.
Results
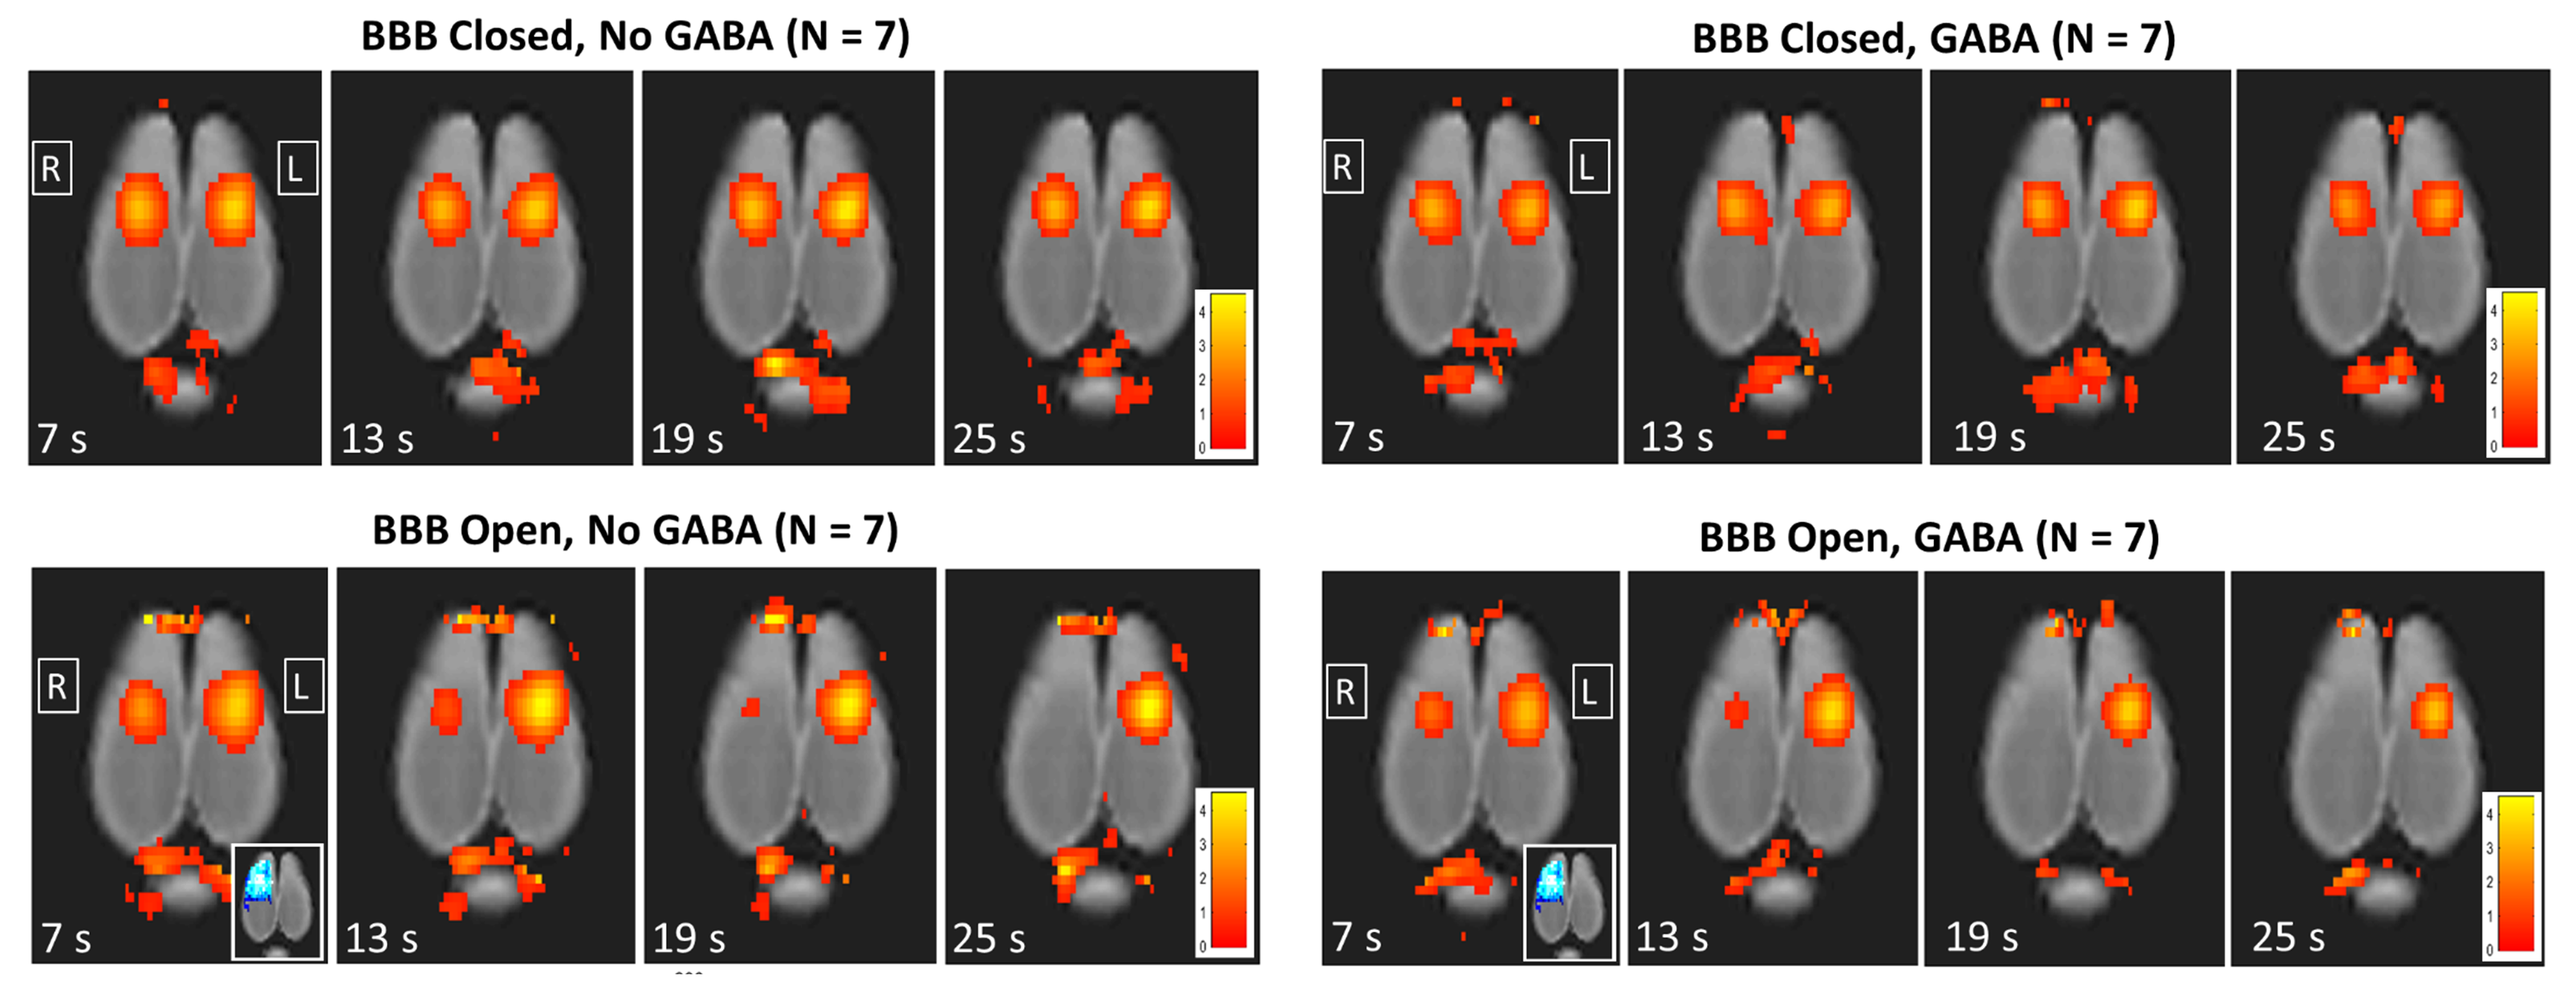
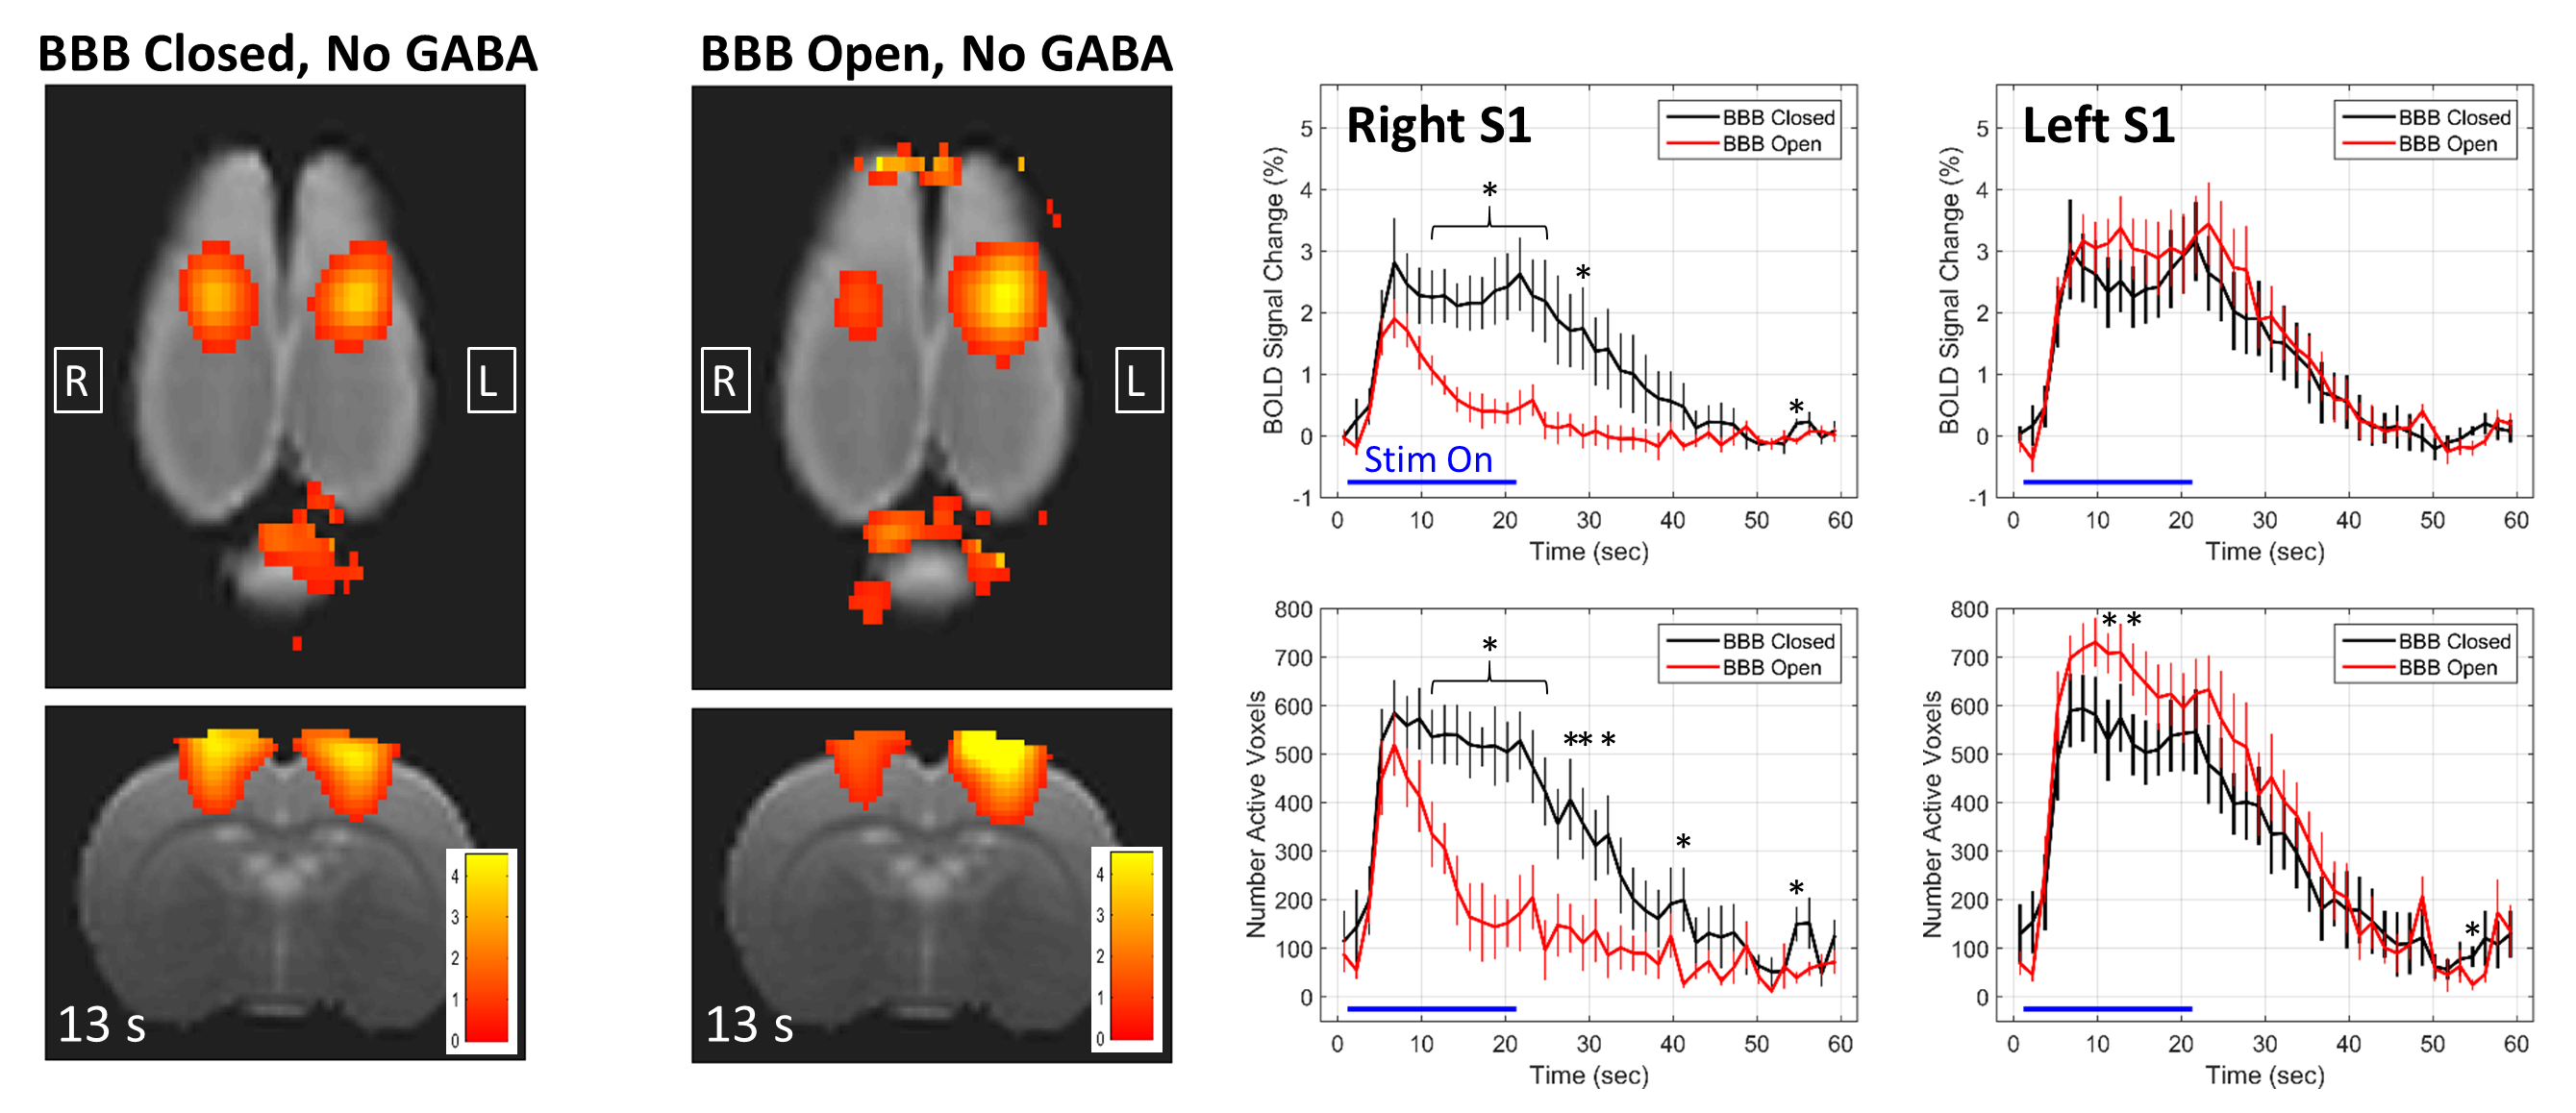
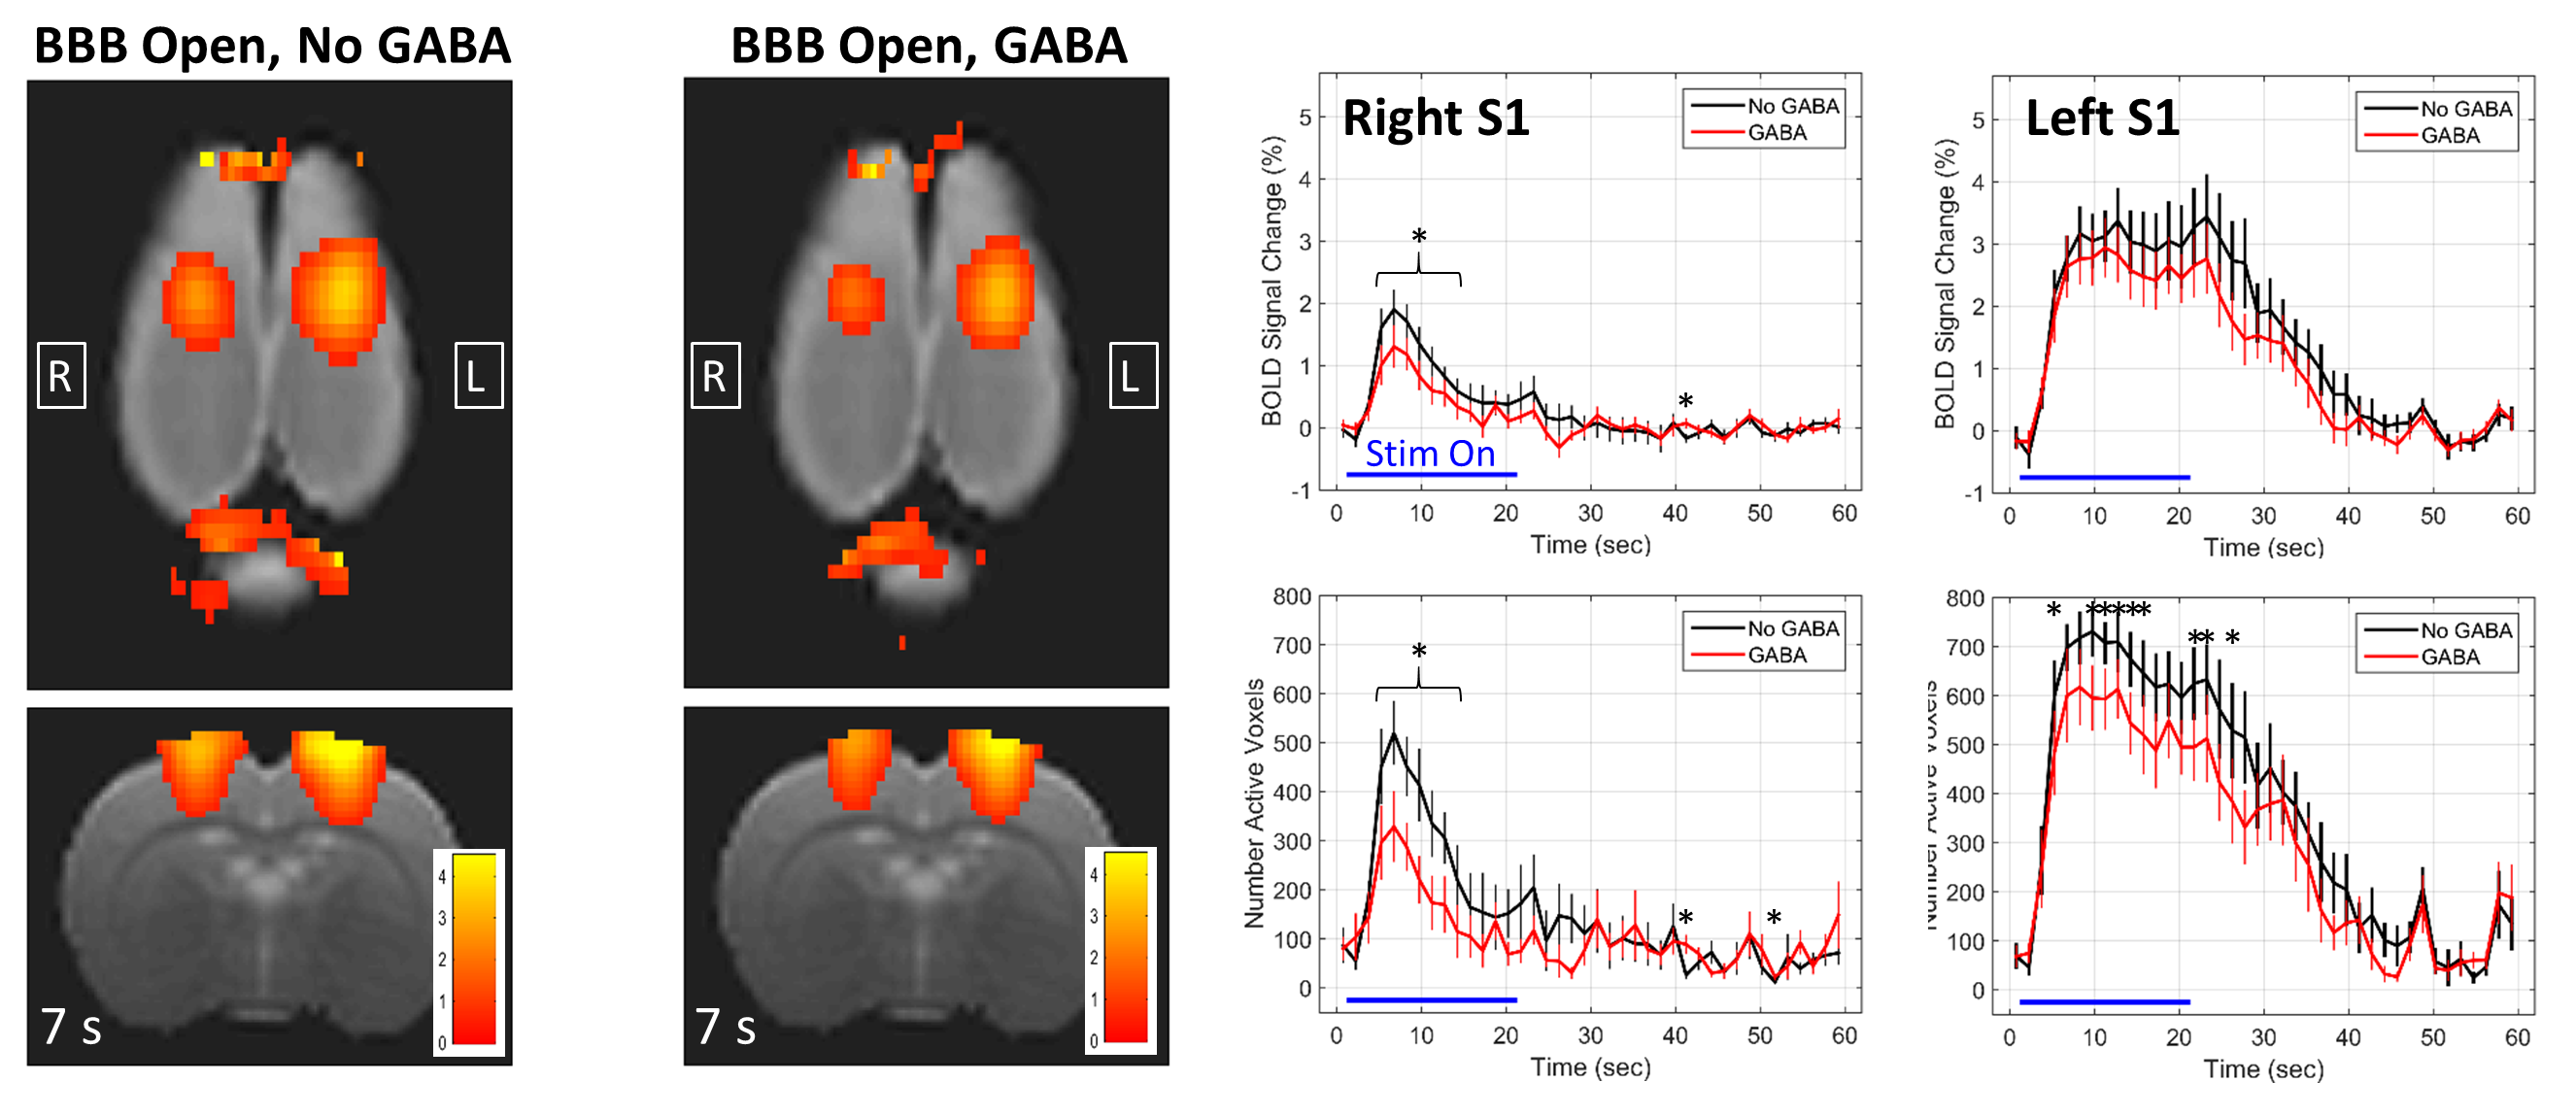
Results from the GABA delivery experiments are shown in Figures 1 – 4. The experimental timing and BBB opening results are shown in Figure 1. Figure 2 shows a summary over the 2x2 factorial design for all four cases of BBB Closed vs BBB Open and No GABA vs GABA. When the BBB was closed, no significant differences in activation were seen between the cases of No GABA and GABA. Figure 3 illustrates the effects of BBB opening alone, where a significant decrease in activation occurs during the later stages of the stimulus duration. Figure 4 shows the results of combining BBB opening with GABA delivery, where a significant decrease in activation at the onset of the stimulus period is seen.
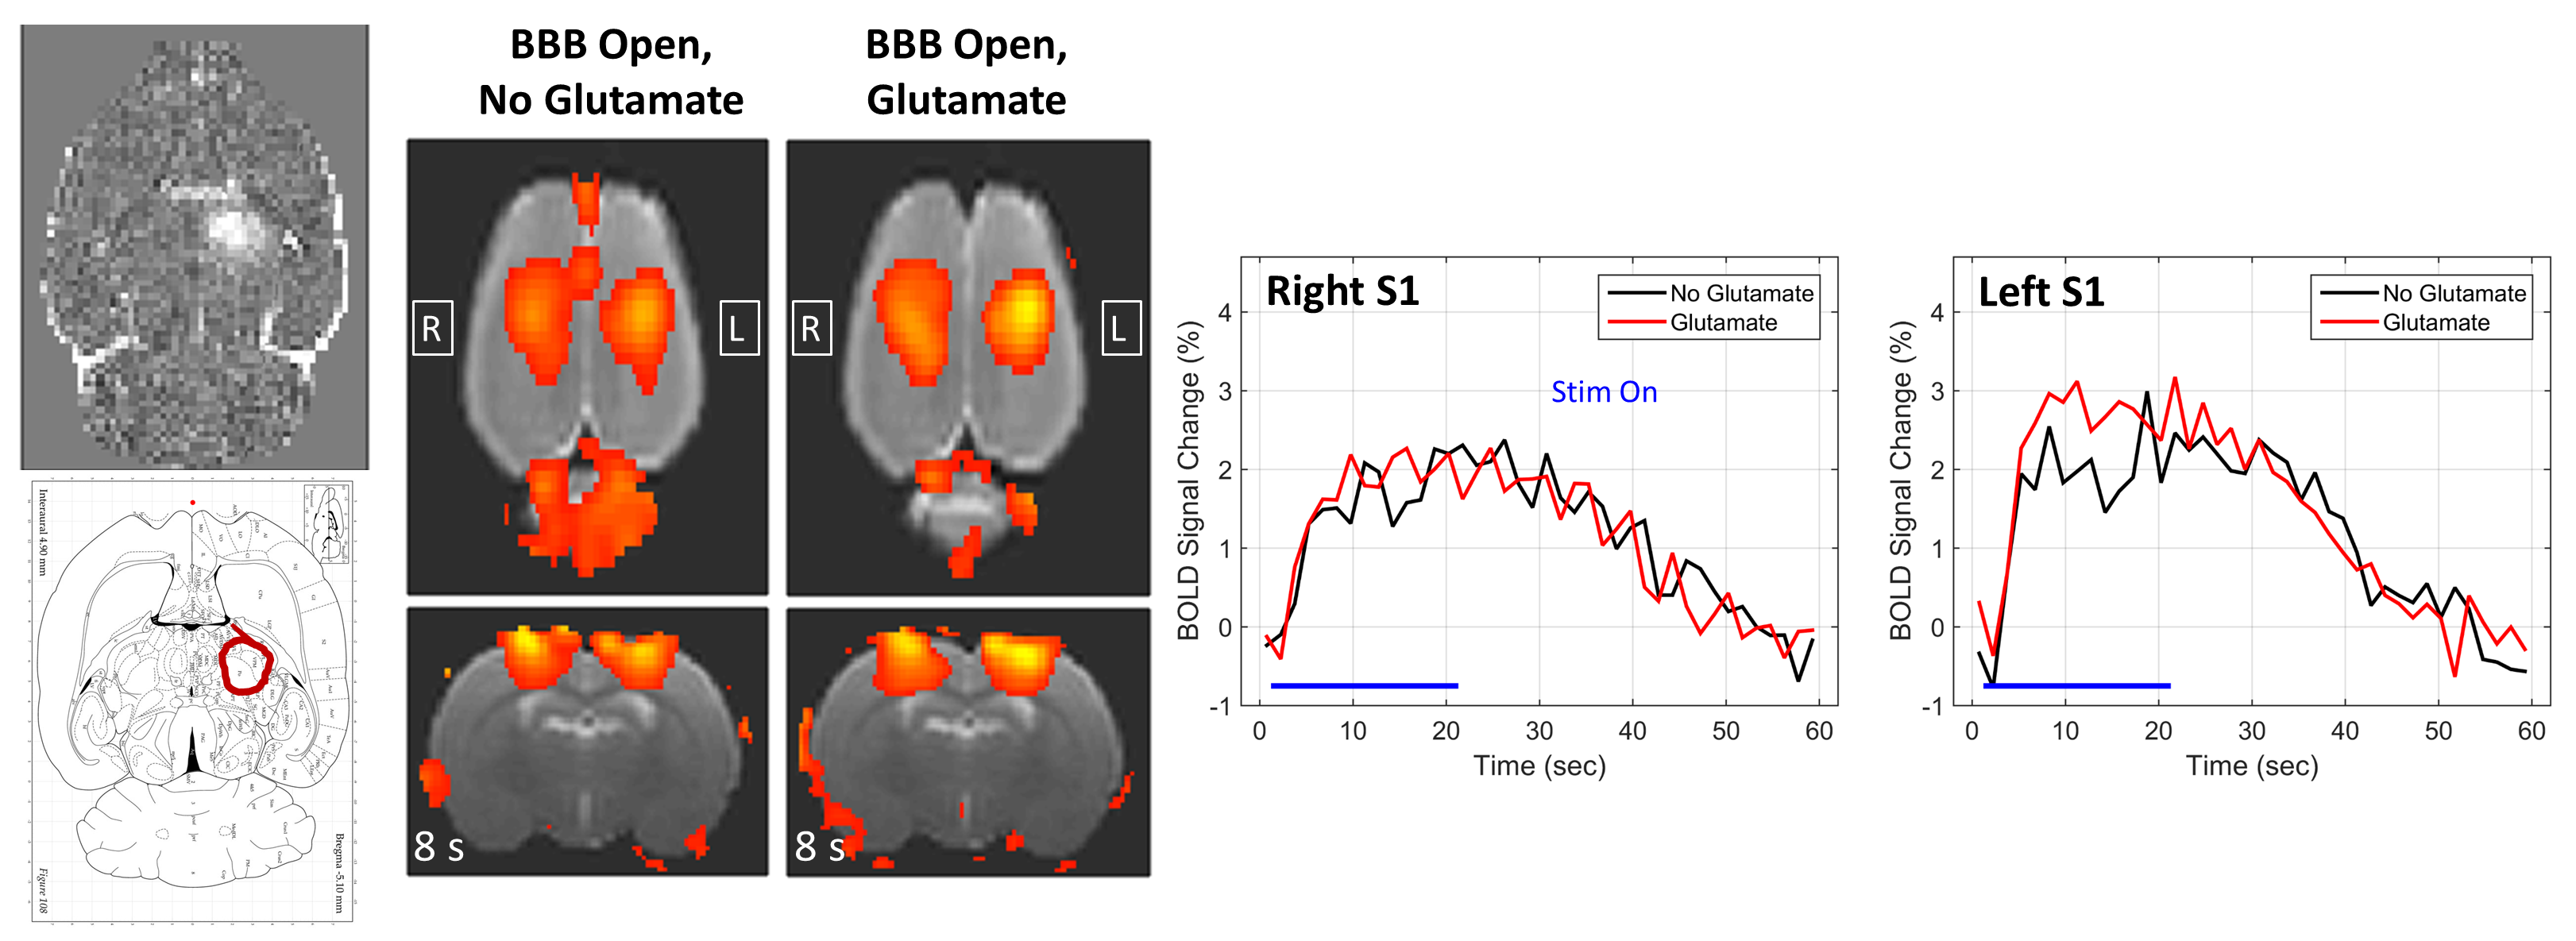
Results from the one thalamic glutamate delivery experiment are shown in Figure 5. In this case, there is no clear decrease in activation due to BBB opening alone because the cortex was not targeted. However, when glutamate was delivered to the left thalamus, there appears to be a possible increase in activation in the left S1HL. More experiments are needed to verify this effect.
Discussion & Conclusions
These initial results are a promising indicator that FUS can be used to disrupt the BBB to allow delivery of neurotransmitter chemicals that affect brain function. We have shown convincing evidence that GABA delivered directly to the somatosensory cortex can suppress activation locally, and very provisional evidence that glutamate delivered to the thalamus can affect activation that is functionally downstream from the site of delivery. Targeted delivery of neurotransmitter chemicals via FUS-induced opening of the BBB represents a novel approach to neuromodulation with strengths and weaknesses complimentary to existing techniques.Acknowledgements
NIH grants R25CA089017-13 and K01EB023983, and the Focused Ultrasound Surgery Foundation 2017 Global Internship Program.References
1. Lee, J.H. et al., 2010. Global and local fMRI signals driven by neurons defined optogenetically by type and wiring. Nature, 465(7299), pp.788–792.
2. Shih, YY. 2017. Deep Brain Stimulation & Chemogenetic fMRI. ISMRM 2017, Honolulu, Hawaii, 0107.
3. Giorgi, A et al., 2017. Chemo-fMRI: a DREADD-based approach to unravel the brainwide substrates of neuromodulation. ISMRM 2017, Honolulu, Hawaii, 0107.
4. Todd, N et al., 2017. Functional MRI evaluation of a novel approach to neuromodulation: Targeted delivery of GABA via focused ultrasound-mediated disruption of the blood-brain barrier. ISMRM 2017, Honolulu, Hawaii, 0109.
5. McDannold, N. et al., 2015. Targeted, noninvasive blockade of cortical neuronal activity. Scientific reports, 5, p.16253.
6. Adamczak, J.M. et al., 2010. High field BOLD response to forepaw stimulation in the mouse. NeuroImage, 51(2), pp.704–712.
7. Brynildsen, J. et al., 2017. Physiological characterization of a robust survival rodent fMRI method. Magnetic Resonance Imaging, 35, 54–60.
8. Paxinos G, Watson C. The rat brain in stereotaxic coordinates. Elsevier Inc.; 2007
Figures