1112
Dynamic Autoregulation in Pharmacological Mouse fMRI Revisited: Abrupt Changes in Systemic Blood Pressure Elicit Significant BOLD Effects in the Murine Brain1Berlin Ultrahigh Field Facility (B.U.F.F.), Max Delbrueck Center for Molecular Medicine (MDC) in the Helmholtz Association, Berlin, Germany, 2Max Delbrueck Center for Molecular Medicine (MDC) in the Helmholtz Association, Berlin, Germany, 3Institute of Vegetative Physiology, Charité – University Medicine, Berlin, Germany, 4DZHK (German Centre for Cardiovascular Research), Berlin, Germany, 5Department of Endocrinology, Charité – University Medicine, Berlin, Germany, 6Experimental and Clinical Research Center, a joint cooperation between the Charité Medical Faculty and the Max Delbrück Center for Molecular Medicine in the Helmholtz Association, Berlin, Germany
Synopsis
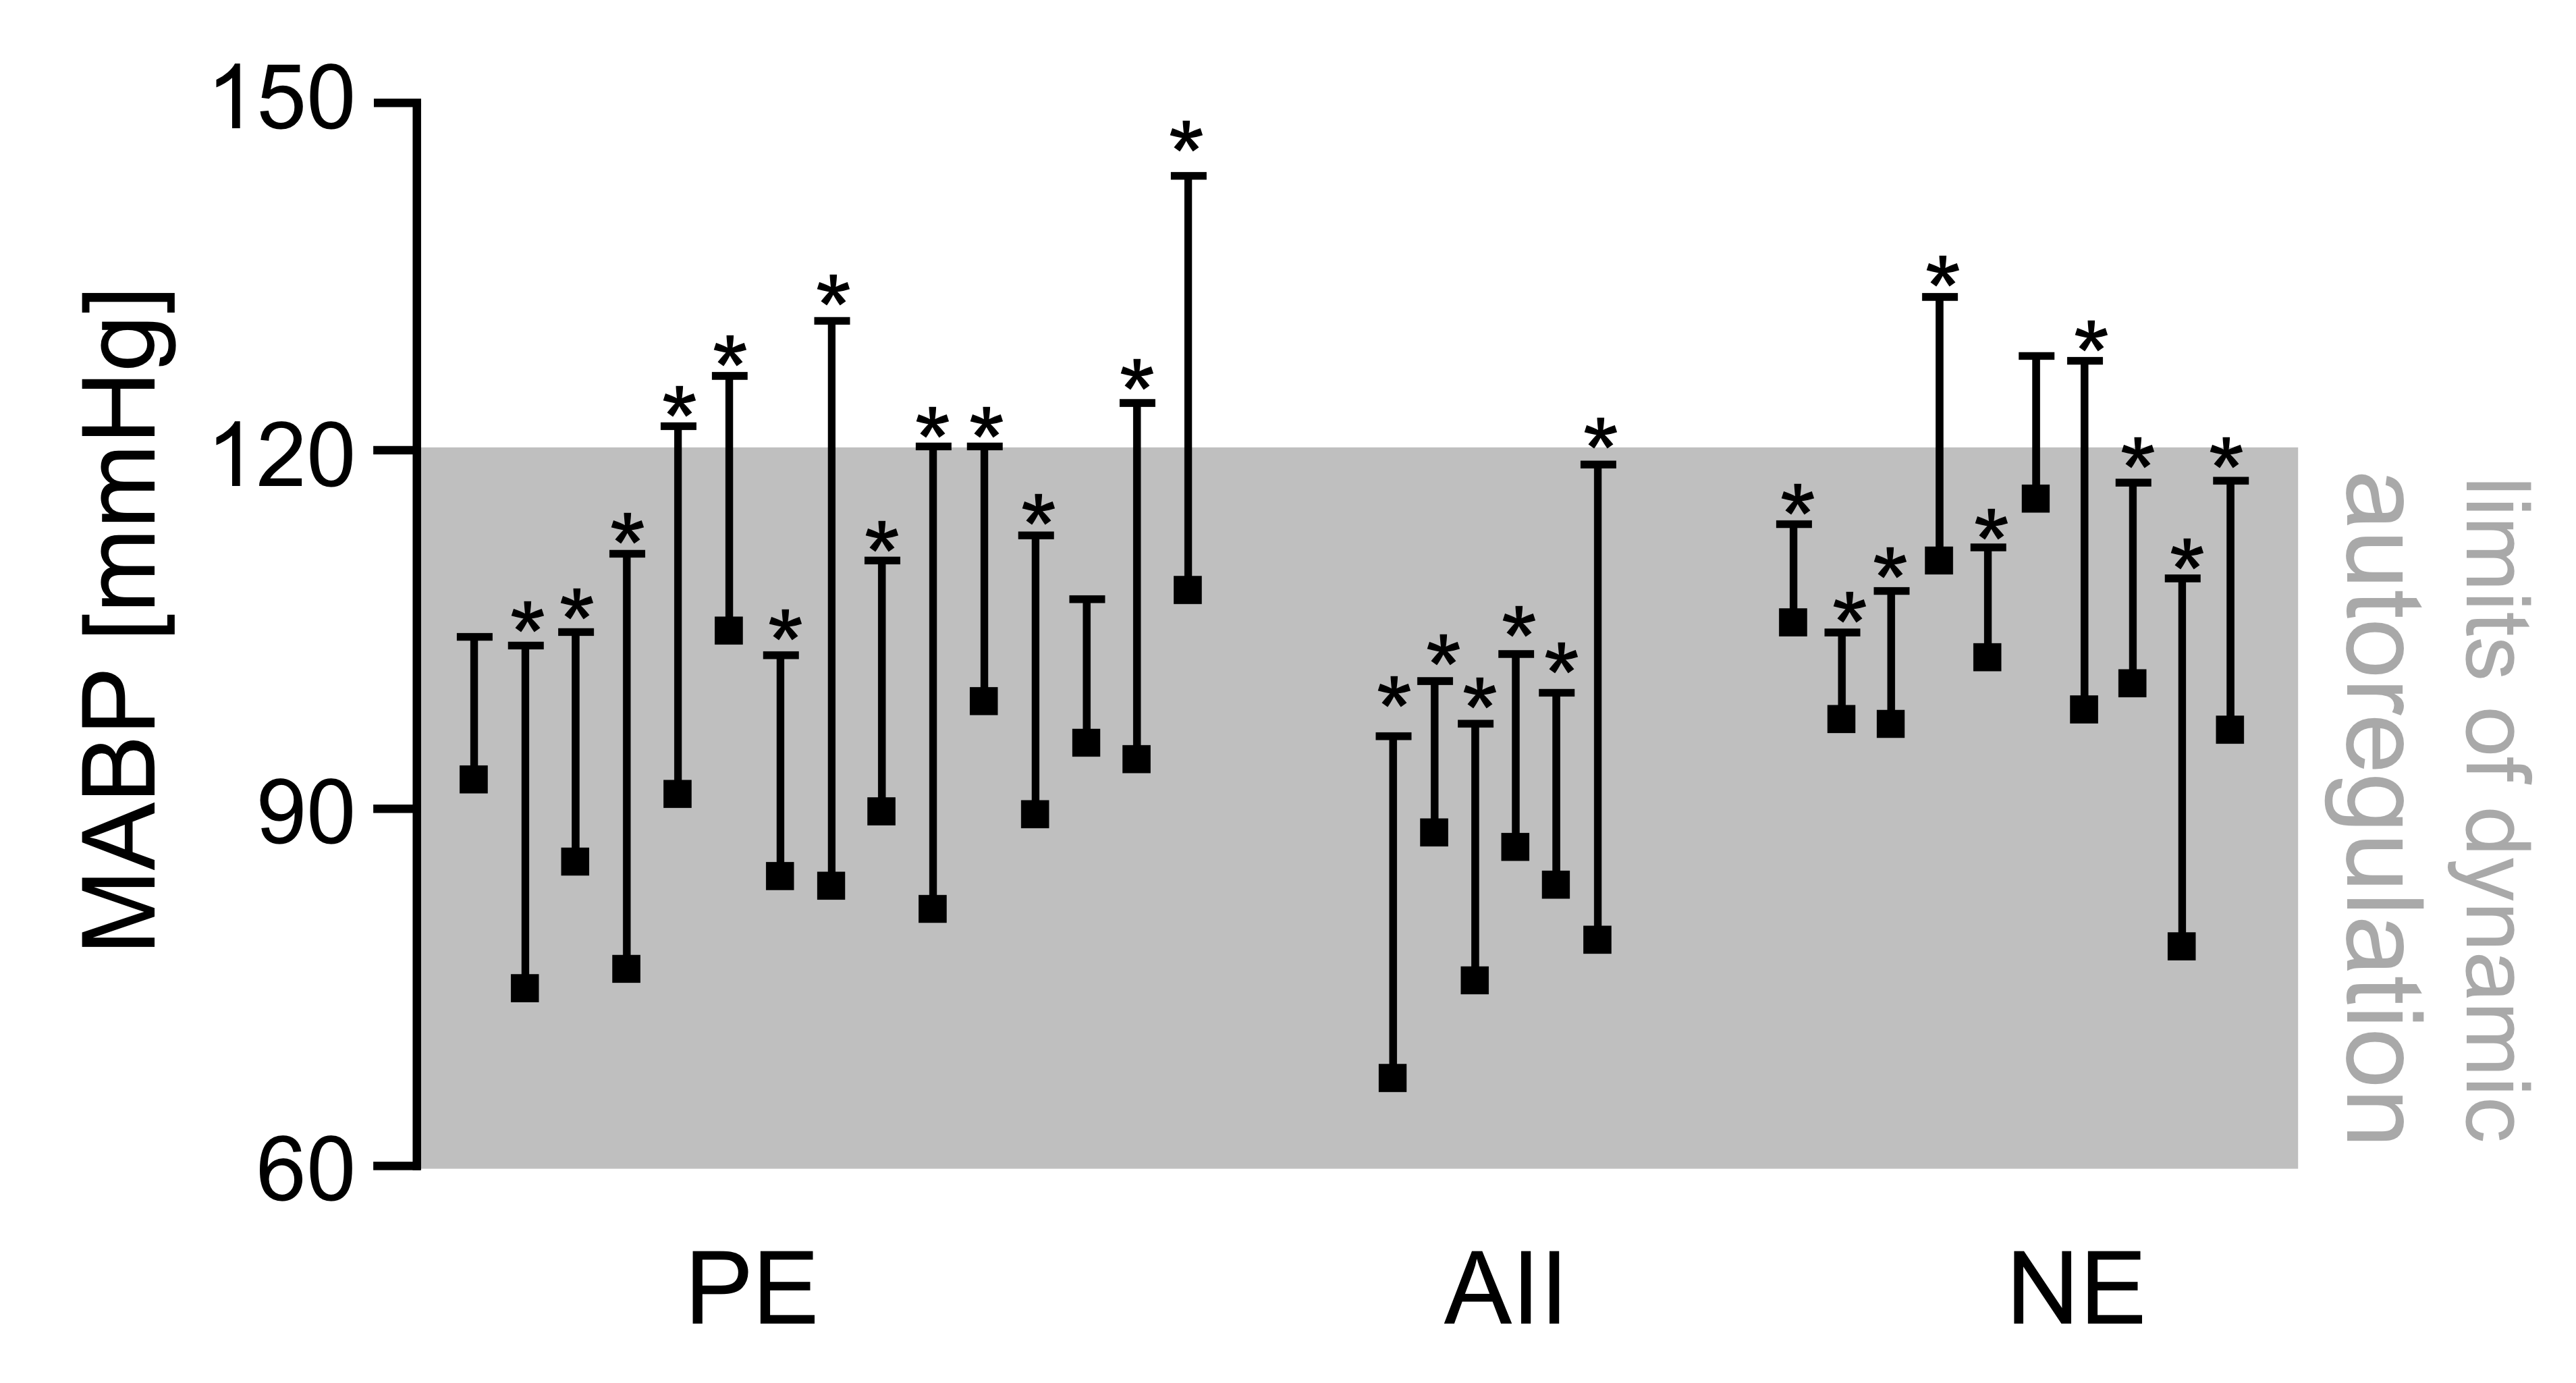
Pharmacological fMRI (phfMRI) is widely utilized to study the effect of specific drugs on brain circuitries and neurotransmitter systems. Some drugs induce elevations in mean arterial blood pressure (MABP) which can increase cerebral blood flow (CBF) and translate into blood oxygenation level-dependent (BOLD) effects. Dynamic autoregulation buffers abrupt changes in MABP to keep CBF relatively constant in a particular range, which was previously defined in rats as 60-120 mmHg and sanguinely applied to mice. By pharmacologically challenging and monitoring the MABP during fMRI we show that these limits of dynamic autoregulation do not apply to mice. Therefore murine phfMRI studies should be interpreted with caution.
Introduction
Pharmacological fMRI (phfMRI) in mice is widely utilized to probe the activity of specific brain circuitries and neurotransmitter systems in response to drugs. Besides changes in neural activity various drugs evoke abrupt changes in mean arterial blood pressure (MABP) which can elicit hemodynamic effects in the rodent brain1,2. Such MABP-induced hemodynamic effects can‘t be distinguished from those evoked by neural activity which makes MABP changes a severe confounder in preclinical phfMRI. Previously, the limits of dynamic autoregulation were examined, which lead to the idea that abrupt changes in MABP in the range of 60-120mmHg do not alter cerebral blood flow (CBF) in rats2. The notion of a virtually perfect autoregulation in this range became conventional wisdom which was subsequently considered to be applicable for mice3. Here we show that MABP changes in the range of 60-120mmHg can elicit significant BOLD effects in the murine brain, which presents a severe issue for phfMRI studies in mice.Methods
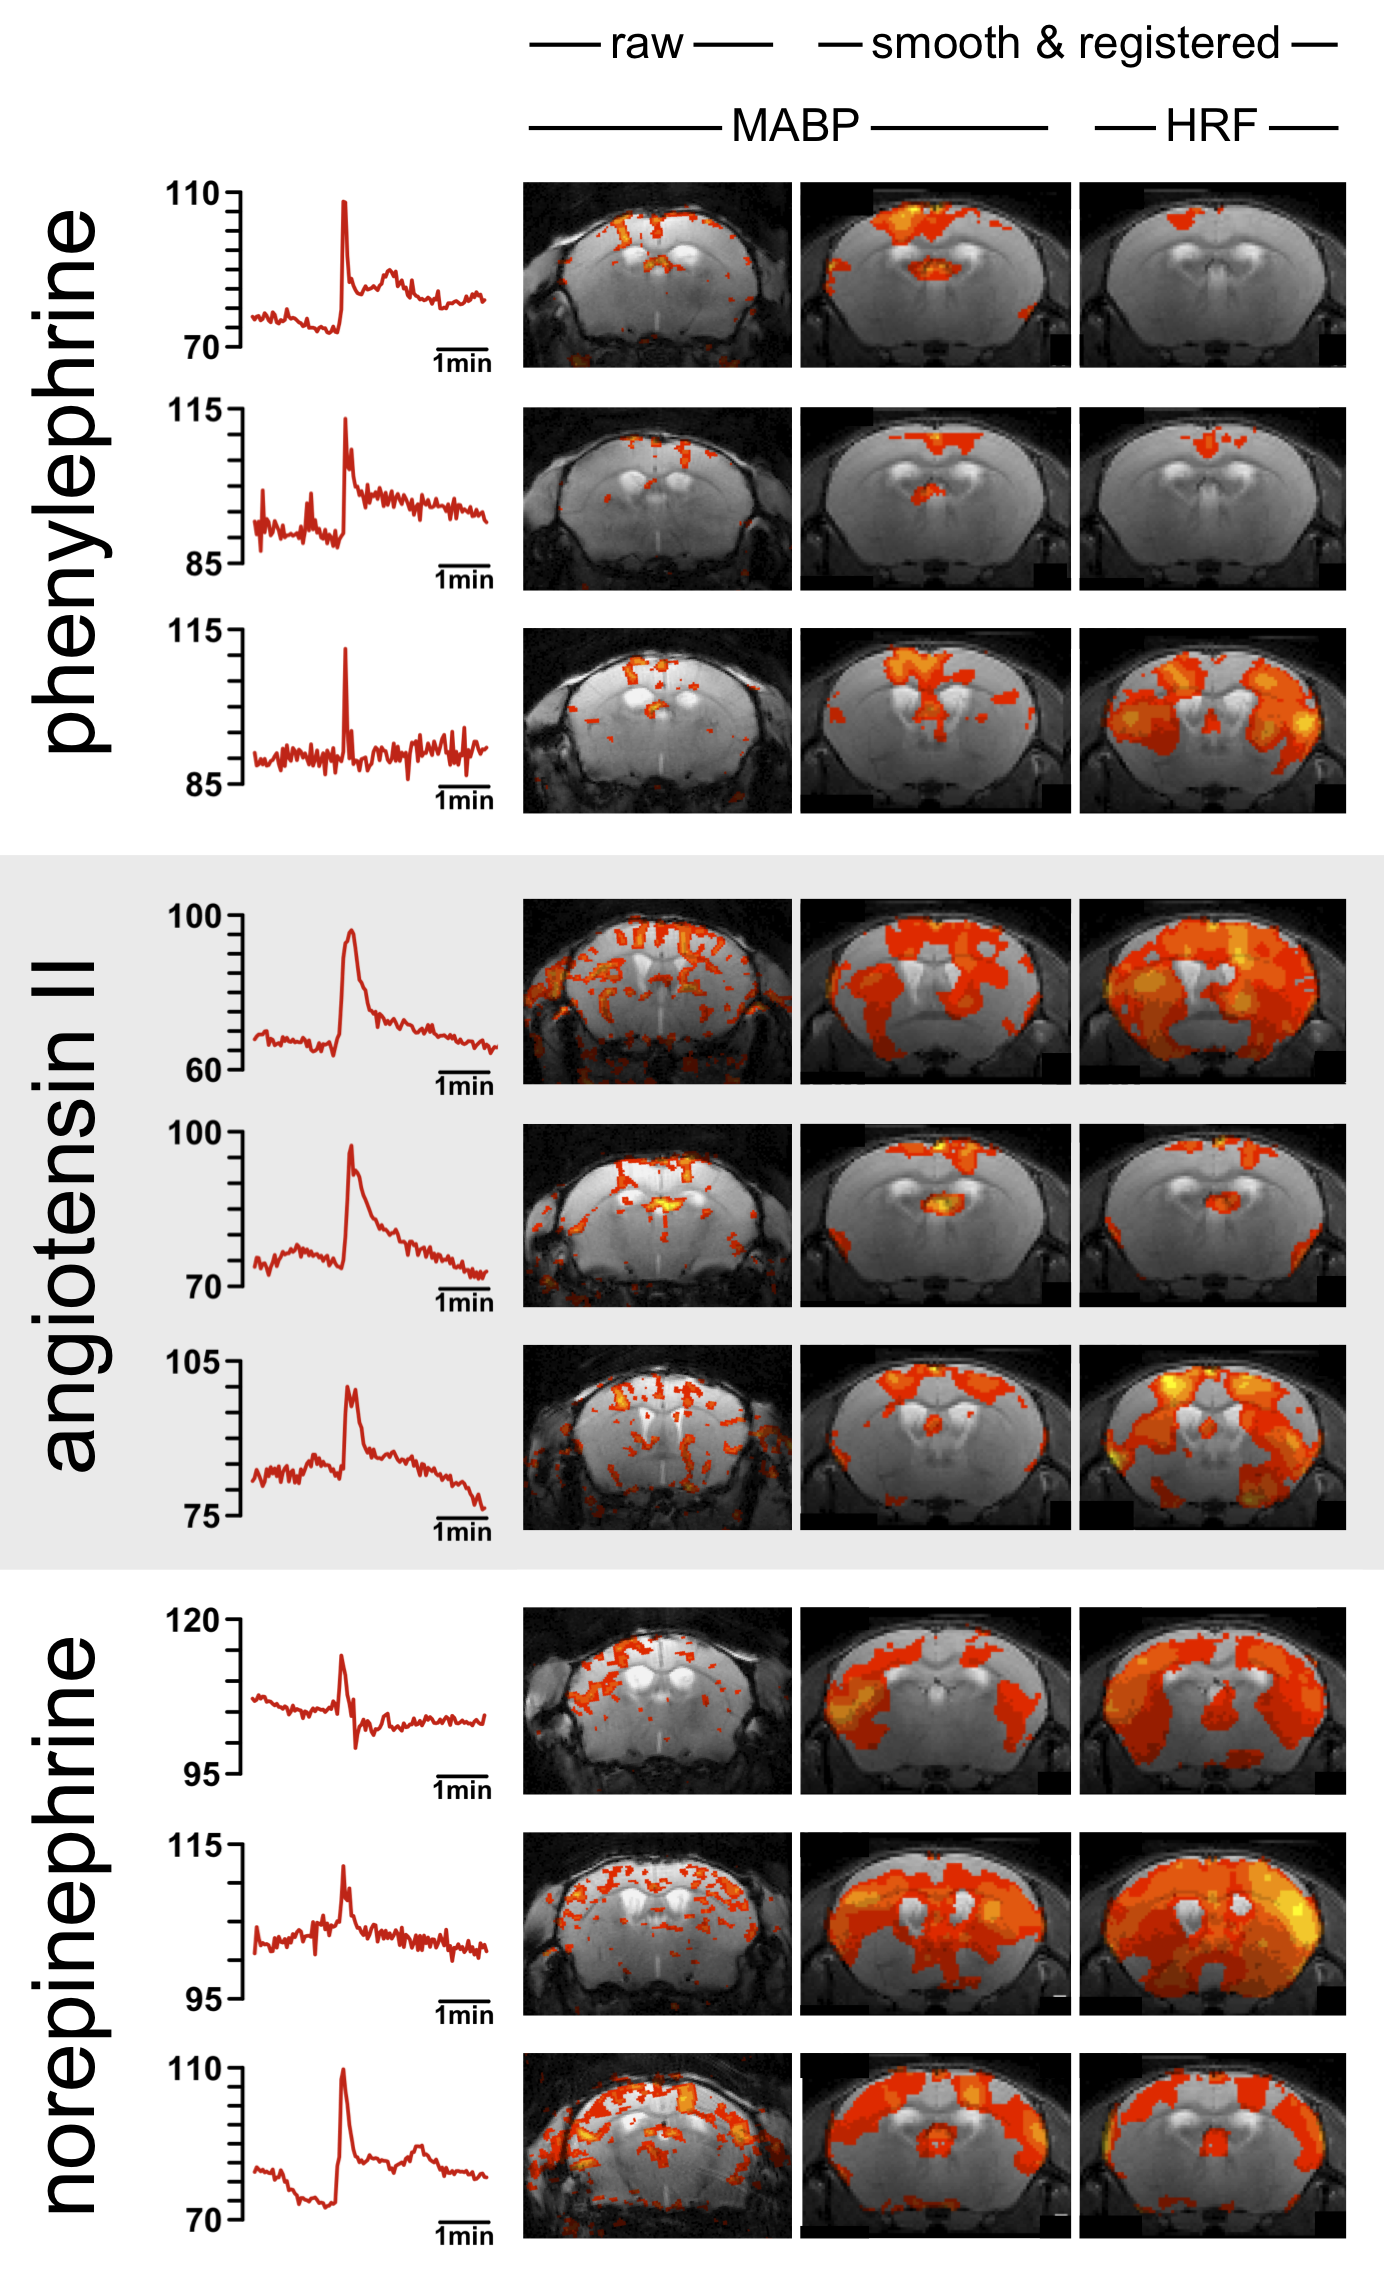
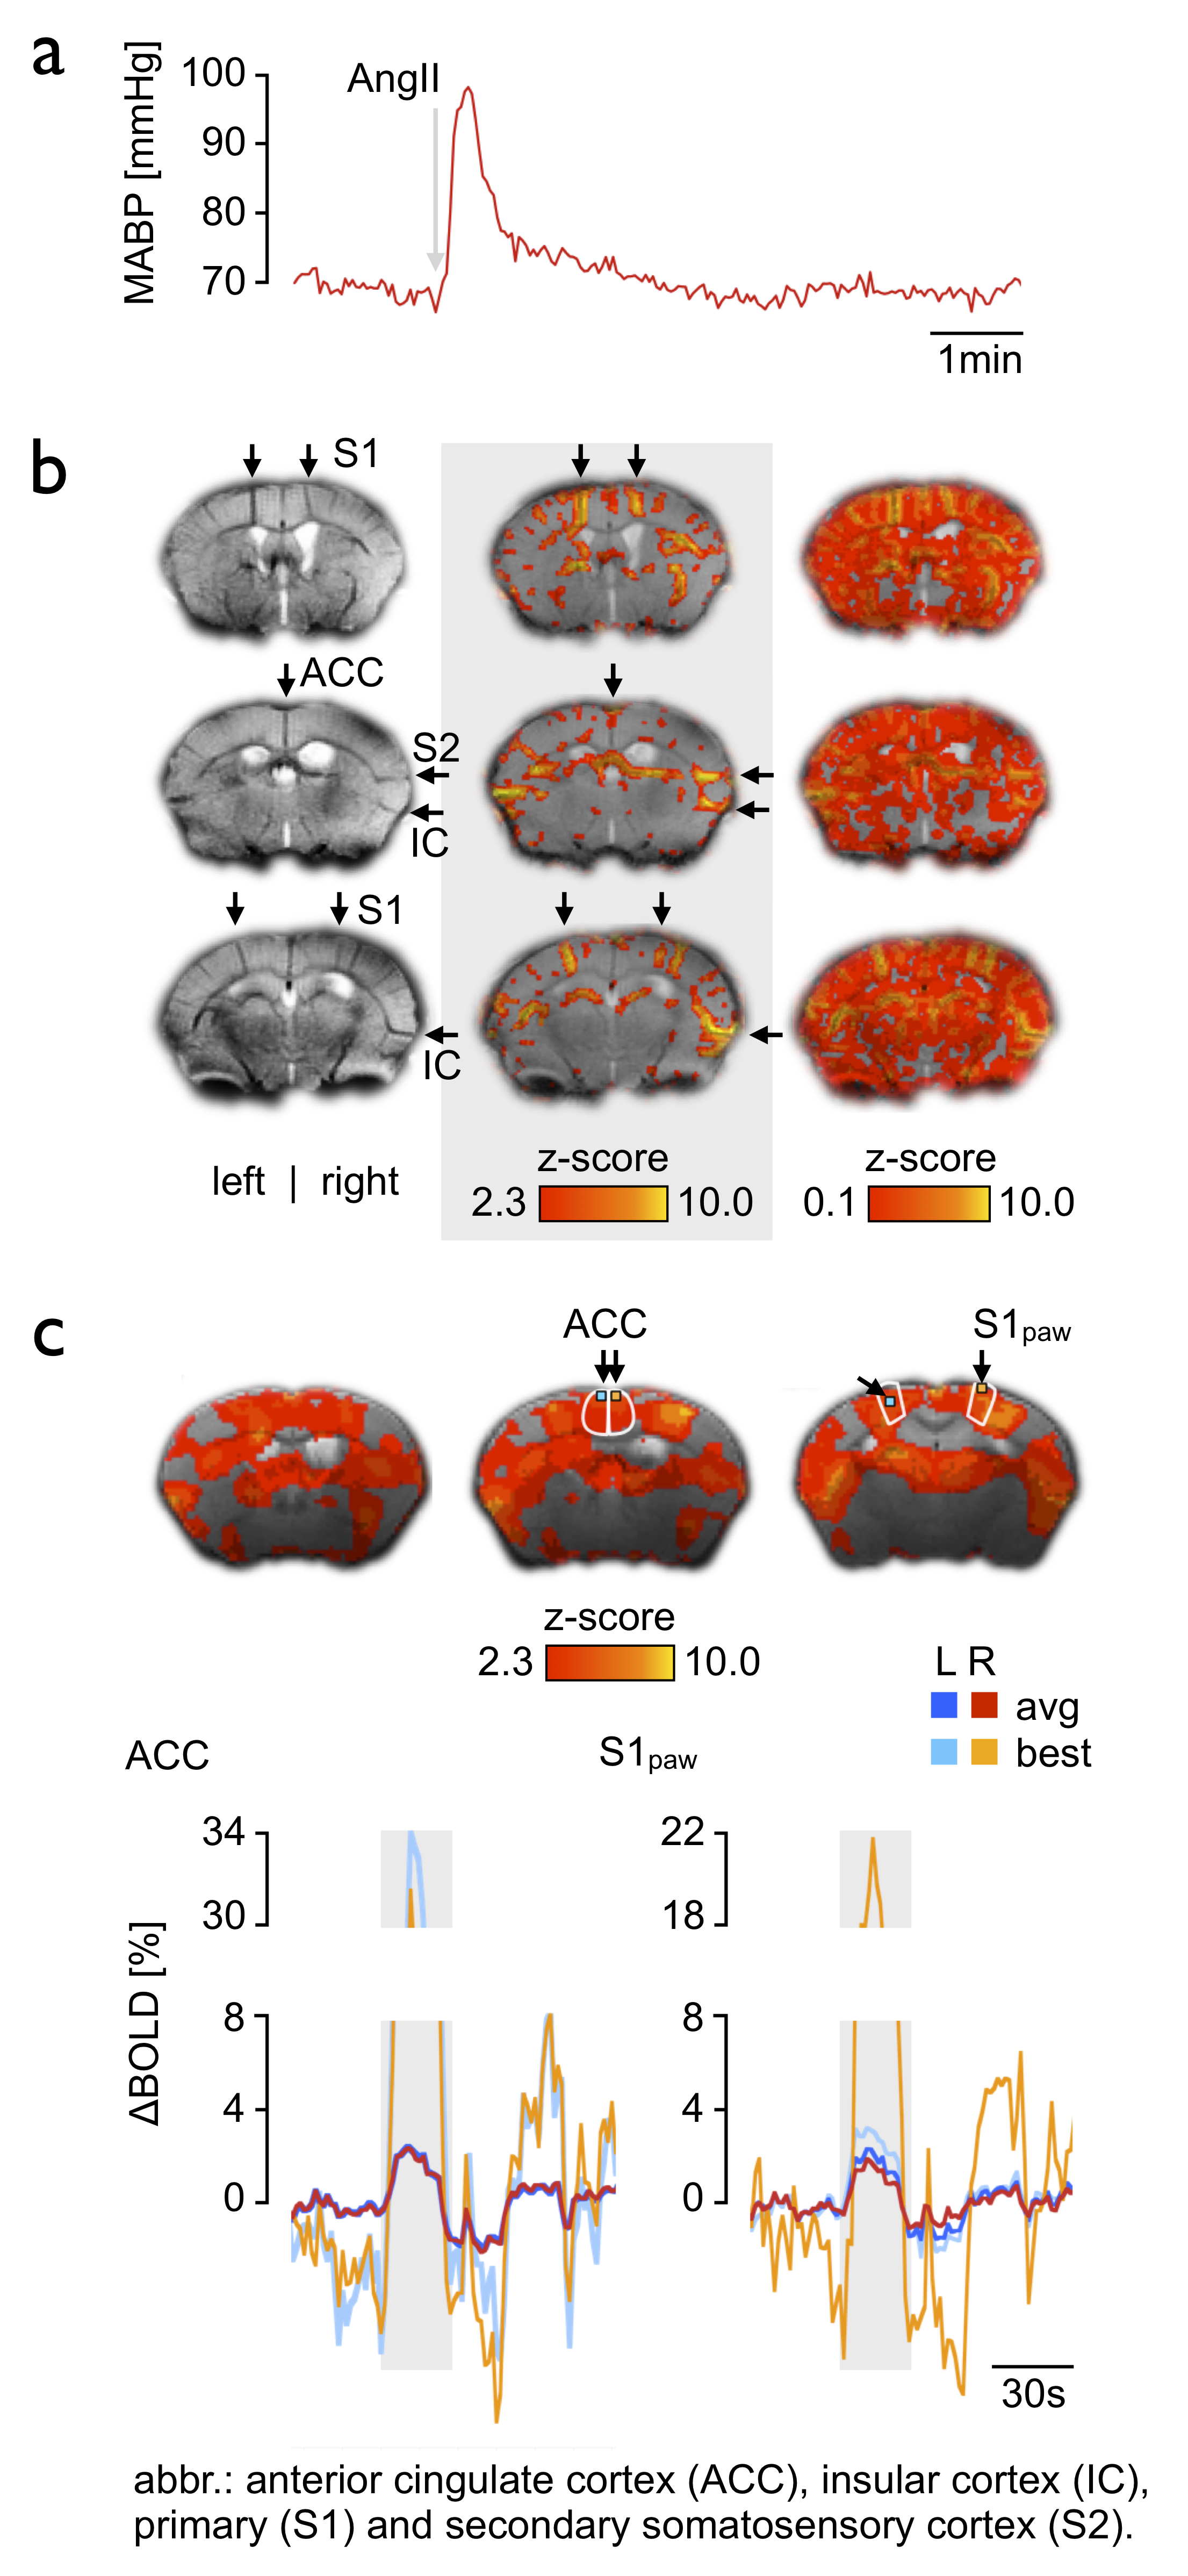
Animal preparation: 21 male C57BL/6N mice were studied under 1% isoflurane. The animals were intubated, artificially ventilated and paralyzed3,4. The left femoral artery was cannulated to allow for continuous MABP monitoring during fMRI. Experimental paradigm: To detail the effect of abrupt changes in MABP on the BOLD signal we applied three different vasoconstrictive agents (i.v.) which were previously used in the literature to evoke abrupt elevations in MABP: phenylephrine (PE, 10mg/kg), angiotensin II (AII, 500ng/kg), and norepinephrine (NE, 1µg/kg). MR Imaging: High-resolution sagittal T2-weighted imaging was used to position 19 axial slices for T2*-weighted fMRI (GE-EPI, TR/TE/FA = 2500ms/11.0ms/80°, FOV/matrix/resolution = 16x12x11.4mm / 80x60x19/ 200x200x500μm), TA = 5min.All images were acquired on a 9.4T Bruker Biospec with a transceive cryogenic quadrature RF surface coil (Bruker, Ettlingen, Germany). Data analysis: FMRI data were motion corrected, smoothed, registered to a mouse brain atlas and statistically analyzed using FSL FEAT. As explanatory variable (EV) we used a) the MABP signal trace and b) a hemodynamic response function (HRF) with onset and duration corresponding to the average timespan of MABP elevation (35 sec block, double gamma convolution + temporal derivative). Corrected cluster significance thresholds of p<0.05 were determined by Z>2.3.Results
All vasoconstrictive agents (PE, AII, NE) evoked significant BOLD effects (Fig. 1, positive BOLD patterns labeled with asterisk) by inducing MABP elevations above and within the presumed limits of dynamic autoregulation (Fig. 1, grey shade) when the MABP signal trace was applied as explanatory variable (see Fig. 2 for representative MABP time courses within the presumed limits of autoregulation and corresponding z-statistic maps). The BOLD effects became even more pronounced when the data were smoothed and spatially registered to a normalized template (Fig. 2, center-right and right column), which is a standard procedure in fMRI. Statistic maps of animals in which an HRF was applied showed similar spatial distribution of BOLD clusters (Fig. 2, right panel). Most significant BOLD patterns occurred in cortical areas following the course of large draining veins (Fig. 3b, left and center column), but expand to large fractions of the brain when the statistic threshold was lowered (Fig. 3b, right column). Signal time plots of anatomical regions in cortical tissue revealed magnitudes of around 3% and up to 30% in superficial draining veins (Fig. 3c).Discussion & Conclusion
All three vasoconstrictive agents act predominantly on resistance vessels outside the brain, and do not cross the blood brain barrier under physiological conditions2,5. Therefore, the BOLD patterns were most likely induced by an increased influx of oxygenated blood into the brain, driven by transient MABP elevations, which were caused by extracerebral vasoconstriction. This conclusion is supported by the following findings: i) the BOLD signals correlated well with the time courses of MABP during the fMRI experiment, and ii) the correlation was highest in large veins, followed by cortical areas (high vascular density) and the least in subcortical tissue (lower vascular density), which can be directly related to the blood-volume fraction of voxels in the respective areas2. Since alterations in MABP in the range of 60-120 mmHg were sufficient to evoke significant BOLD patterns for all agents we conclude that CBF was affected by MABP changes in this range. Our experimental findings and conclusion invite a reconsideration of the murine limits of dynamic autoregulation. Following our results the definition of reliable limits of dynamic autoregulation in which CBF is unaffected by abrupt MABP alterations should not only include a particular range of MABP alterations, but magnitude and transition rate of MABP changes should be also considered6.Acknowledgements
No acknowledgement found.References
1 Wang, R., Foniok, T., Wamsteeker, J.I., et al. Transient blood pressure changes affect the functional magnetic resonance imaging detection of cerebral activation. Neuroimage 2006; 31, 1-11.
2 Gozzi, A., Ceolin, L., Schwarz, A., et al. A multimodality investigation of cerebral hemodynamics and autoregulation in pharmacological MRI. Magn. Reson. Imaging 2007; 25, 826-833.
3 Ferrari, L., Turrini, G., Crestan, V., et al. A robust experimental protocol for pharmacological fMRI in rats and mice. J. Neurosci. Methods 2012; 204, 9-18.
4 Reimann, H.M., Hentschel, J., Marek, J., et al. Normothermic Mouse Functional MRI of Acute Focal Thermostimulation for Probing Nociception. Sci. Rep. 2016;6, 1-17.
5 Faraci, F.M., Heistad, D.D. Regulation of large cerebral arteries and cerebral microvascular pressure. Circ. Res. 1990; 66, 8-17.
6 Tzeng, Y.-C., Ainslie, P.N. Blood pressure regulation IX: cerebral autoregulation under blood pressure challenges. Eur. J. Appl. Physiol. 2013; 114, 545-559.
Figures