1108
Multi-centre resting-state fMRI comparison reveals common functional networks in the mouse brain.1Singapore Bioimaging Consoritum, Agency for Science, Technology and Research, Singapre, Singapore, 2Istituto Italiano di Tecnologia, Center for Neuroscience and Cognitive Systems @ UNITN, Rovereto, Italy, 3Center for Mind/Brain Sciences, University of Trento, Rovereto, Italy, 4Department of Biomedical Sciences, University of Antwerp, Antwerp, Belgium, 5Douglas Mental Health University Institute, McGill University, Montreal, QC, Canada, 6Central Institute of Mental Health, University of Heidelberg, Mannheim, Germany, 7Department of Radiology, University of Freiburg, Freiburg, Germany, 8Institute of Experimental and Clinical Pharmacology and Toxicology, Friedrich-Alexander University Erlangen-Nürnberg, Erlangen, Germany, 9Queensland Brain Institute, The University of Queensland, Brisbane, Australia, 10Max Planck University College London Centre for Computational Psychiatry and Ageing Research, University College London, London, United Kingdom, 11Departments of Psychiatry and Biological and Biomedical Engineering, McGill University, Montreal, QC, Canada, 12Department of Biophysics and Nuclear Medicine, University Hospital Strasbourg, Strasbourg, France, 13Institute for Biomedical Engineering, University and ETH Zürich, Zürich, Switzerland, 14Institute of Pharmacology and Toxicology, University of Zürich, Zürich, Switzerland, 15Institute of Automation, Chinese Academy of Sciences, Beijing, China, 16School of Life Science and Technology, University of Electronic Science and Technology of China, Chengdu, China, 17Department of Health Sciences and Technology, ETH Zürich, Zürich, Switzerland
Synopsis
Functional imaging studies in rodent have gained considerable momentum over the past years, holding the promise to provide a crucial translational tool to comprehend the functional signatures of the healthy and diseased brain. Mouse resting-state (rs-)fMRI has been adopted by numerous laboratories world-wide, yet, variations in equipment, animal handling and data analysis protocols render the comparison of results between studies difficult. We have carried out a multi-centre comparison comprising 12 mice rs-fMRI datasets analysed through a common pipeline and identified the major resting-state networks expressed across datasets. We provide a detailed investigation into the reproducibility and robustness of the protocols.
Introduction
Resting-state functional magnetic resonance imaging (rs-fMRI) has brought considerable understanding onto the nature of the brain organization and function, and remains, to date, a central method in neuroimaging. Functional connectivity (FC) estimated in the mouse brain using rs-fMRI is a fast-developing field holding the exciting promise to uncover the basic principles of large-scale functional organization , as well as the mechanisms leading to their alterations under pathological conditions (for review see [1-4]). Since its formal onset in 2011 [5], the method has been adopted by several laboratories world-wide. Similar to functional imaging acquired in human, acquisitions in rodents are carried at varying field strengths, coil configurations, and sequences. In addition, differences in animal handling procedures may further impact results, preventing a comparison of published results between laboratories, and complicating the establishment of standardized methods for preclinical imagers. We have carried out a multi-centre comparison of 12 datasets representative of the protocols obtained in the respective laboratories using a common data analysis pipeline. Specifically, we aim to investigate the reproducibility of murine functional networks across centres.Method
were acquired on dedicated Bruker magnets operating at 4.7T (N=1 dataset), 7T (N=4), 9.4T (N=7), with either room-temperature coils (N=6) or cryocoils (N=6). All acquisitions were performed on anesthetized C57B6/J mice (both male and female) with either isoflurane 1-1.2% (N=4), halothane 0.75% (N=1), medetomidine 0.1-0.4 mg/kg bolus and 0.2-0.8 mg/kg/h infusion (N=3), or a combination of isoflurane 0.2-0.5% and medetomidine 0.05-0.3mg/kg bolus and 0-0.1 mg/kg/h infusion (N=4). Animals were either freely-breathing (N=7) or mechanically ventilated (N=5). All data was pre-processed using an adapted pipeline based on FSL FEAT [6]. A number of denoising approaches were compared; results are shown following vascular and ventricular signal regression. FC data analysis was performed using several commonly used approaches: seed-based analysis (SBA), independent component analysis, and ROI-based network analysis. Detailed results in this abstract are provided for SBA. Statistical FC maps across datasets were obtained with permutation-based one-sample t-tests using cluster correction. Within-dataset statistical FC maps were obtained with parametric one-sample t-tests and are reported as significance incidence (p<0.05, uncorrected) across datasets.Result
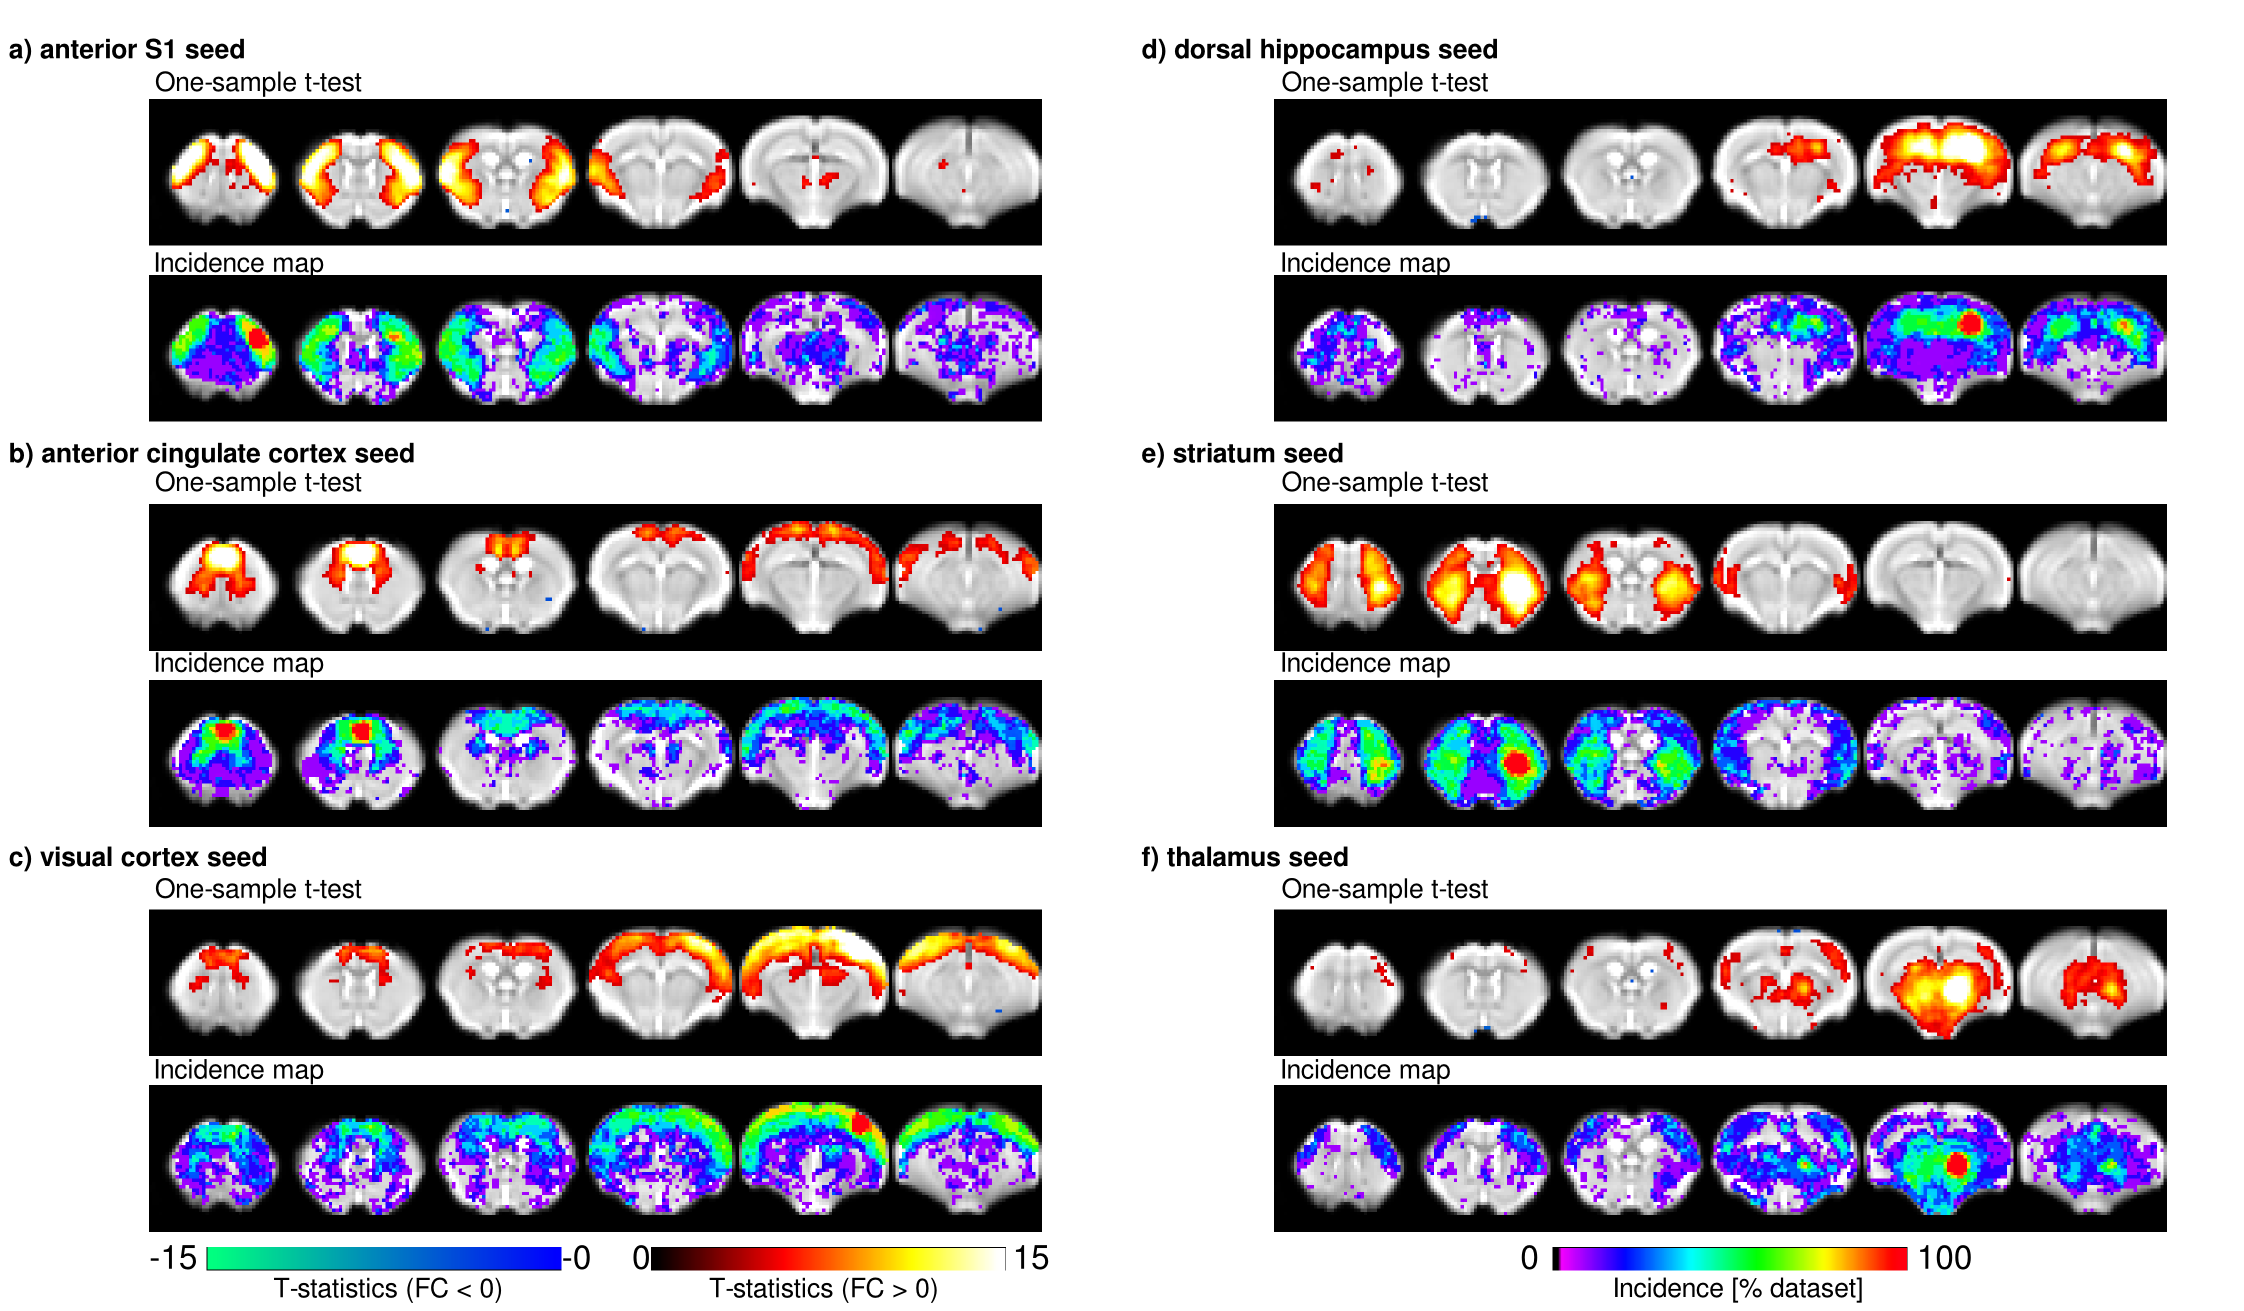
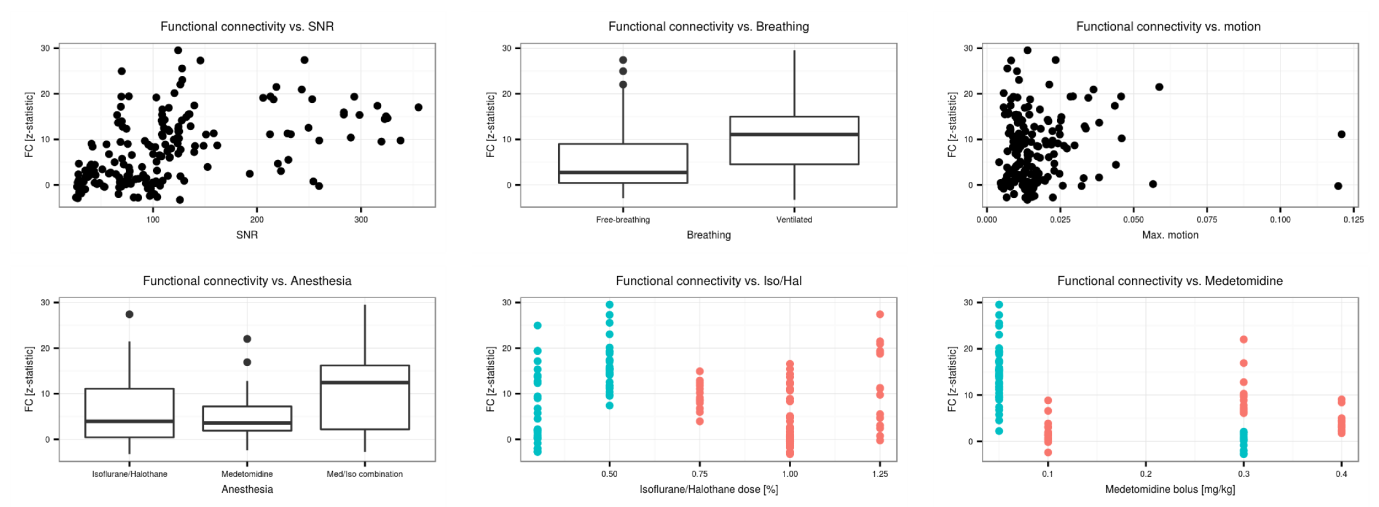
Individual scans displayed minimal geometric distortions. Cortical signal-to-noise ratio (SNR) ranged from 29.7±2.7 to 298.9±34.6. There was a positive association between field strength and SNR (p=1.7x10⁻⁸), and between coil type (room-temperature or cryocoil) and SNR (p=0.0061). Maximal motion in most scans was kept below 10% of the voxel dimension. Seeds positioned in representative anatomical regions of the left hemisphere revealed the spatial extent of murine resting-state networks, indicating a bilateral organisation (anterior S1, visual cortex, hippocampus, striatum, thalamus seeds), as well as a rostro-caudal organisation together with bilateral posterior parietal cortical regions when an anterior cingulate seed was used. This latter network recapitulates anatomical features reminiscent of the human default-mode network (Fig. 1)[7]. Considered individually, 60-80% of the datasets presented significant contralateral FC for the anterior S1 seed. FC reproducibility for to the anterior cingulate seed presented lower incidence, ranging between 40-60%, in distal posterior parietal cortical areas. Individual FC values were extracted either from a contralateral region-of-interest (ROI) for the anterior S1 seed or a ROI located in the posterior cingulate cortex for the anterior cingulate seed. These FC data were further investigated in depth within a linear model approach including factors related to equipment, acquisition, and animal handling (Fig. 2 for anterior S1). In both ROIs, anaesthesia was identified as a significant explanatory factor (p=0.0029 for contralateral S1, p=1.29x10⁻⁵ for posterior cingulate cortex). Mechanical ventilation presented a weak effect on FC (p=0.044 for contralateral S1, p= 0.068 for posterior cingulate cortex). Finally, SNR only reached significance effect on the FC for the anterior S1 (p=1.29x10⁻⁵) but not in the posterior cingulate ROI (p=0.18).Discussion
Representative datasets from imaging centres world-wide revealed robustness and spatial extent of commonly investigated functional networks in the mouse brain. With the growing body of literature regarding FC in mice, this study allows a crucial comparison of datasets to investigate the basis of FC in the healthy and diseased brain. While the spatial extents of resting-state networks converged, divergences remained in long-range rostro-caudal connectivity, encompassing regions associated with the rodent default-mode network. Careful protocol planning and comparisons with the standards established in this study will serve as a key reference for rs-fMRI mapping in the mouse, and will guide the future design of more robust protocols.Acknowledgements
No acknowledgement found.References
1. Jonckers, E., et al., The power of using functional fMRI on small rodents to study brain pharmacology and disease. Front Pharmacol, 2015. 6: p. 231. 2. Pan, W.J., et al., Considerations for resting state functional MRI and functional connectivity studies in rodents. Front Neurosci, 2015. 9: p. 269. 3. Gozzi, A. and A.J. Schwarz, Large-scale functional connectivity networks in the rodent brain. Neuroimage, 2016. 127: p. 496-509. 4. Chuang, K.H. and F.A. Nasrallah, Functional networks and network perturbations in rodents. Neuroimage, 2017. 5. Jonckers, E., et al., Functional connectivity fMRI of the rodent brain: comparison of functional connectivity networks in rat and mouse. PLoS One, 2011. 6(4): p. e18876. 6. Zerbi, V., et al., Mapping the mouse brain with rs-fMRI: An optimized pipeline for functional network identification. Neuroimage, 2015. 123: p. 11-21. 7. Sforazzini, F., et al., Distributed BOLD and CBV-weighted resting-state networks in the mouse brain. Neuroimage, 2014. 87: p. 403-15.Figures