1107
Functional MRI mapping the optogenetic activation of the lateral hypothalamus driven by an MRI-guided robotic arm (MgRA)1Research Group of Translational Neuroimaging and Neural Control, High-Field Magnetic Resonance, Max Planck Institute for Biological Cybernetics, Tuebingen, Germany, 2Graduate Training Centre of Neuroscience, University of Tuebingen, Tuebingen, Germany, 3The Max Planck Institute for the Science of Light, Erlangen, Germany, 4The Werner Reichardt Centre for Integrative Neuroscience, University of Tuebingen, Tuebingen, Germany
Synopsis
A multiple degree-of-freedom robotic controlling system was developed to guide the fiber optic targeting lateral hypothalamus in the rat brain inside the high field (14.1T) MRI scanner. Optogenetic activation of the LH leads to highly reliable functional fMRI activation patterns in the LH and its projecting regions including LPO, MPA, MPOL and StA across animals. The MgRA provides a MR-compatible brain intervention strategy to target deep brain nuclei for optogenetic activation or calcium recordings with high precision and flexibility.
Target Audience
Scientists who are interested in small animal fMRI with cutting-edge techniques.Introduction
Lateral hypothalamus (LH) is comprised of highly heterogeneous neuronal
populations and diverse projections1, 2. Cell-specific optogenetic
activation and GCaMP-mediated calcium imaging of LH neurons has been applied to
reveal the circuit specific behavioral modulation in rodents 1, 3. However, it remains
challenging to target different groups of LH neurons with high flexibility for
optogenetic activation and calcium recordings in combination with whole brain
fMRI mapping to study the LH-specific brain network modulation. Here, an
MRI-guided robotic arm (MgRA) with high precision for fiber optic positioning
was developed to drive brain intervention inside the MRI scanner so as to map
the BOLD-fMRI functional patterns upon optogenetic activation of LH neurons.Methods
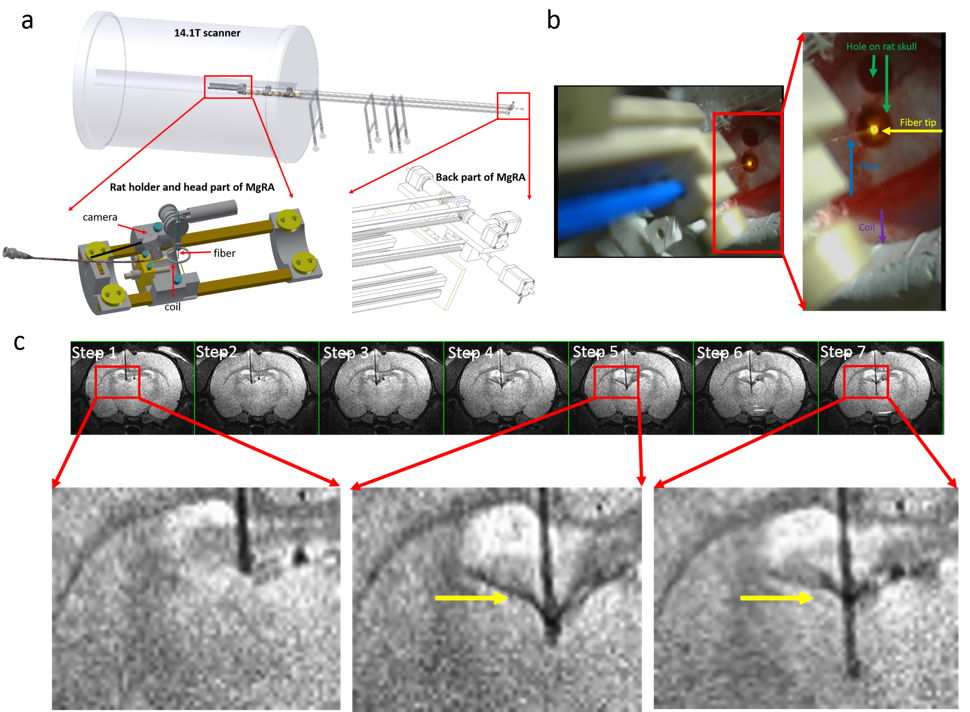
Using an MgRA-guided optical fiber (~200um), neural activity was optogenetically evoked on a region of LH expressing AVV5.CaMKII.ChR2.eYFP of male Sprague-Dawley rats under alpha-chloralose anesthesia. Fig. 1a shows the MgRA positioning system developed in the 14.1T horizontal MR scanner with 12cm inner diameter gradient. An MRI compatible camera allows visual guidance of the fiber towards the target craniotomy at the iso-center of the horizontal bore magnet. It is noteworthy that MRI anatomical images allowed for detection of the potential collateral damage during fiber insertion (Fig.1c). Fiber tip location in LH was confirmed by MRI anatomical images acquired with 2D rapid acquisition with relaxation enhancement sequence: TR, 1200ms, TE, 7.5ms, 1.92cmX1.68cm FOV, 128X112 matrix, 150X150um in-plane resolution, 600um thickness. The optical fiber(~200um) delivered blue light pulses (473nm) at 5Hz, 20ms width with 15s duration for the fMRI block design. fMRI scans with block design were performed using 3D Echo planar imaging sequence: TR, 1.5s, TE,11.5ms, 2.24X1.92X1.92cm3 FOV, 56X48X48 matrix, 400X400X400 um3 spatial resolution. The detailed surgical procedures for optogenetic fMRI were described previously4. MRI data analysis was performed using Analysis of Functional NeuroImages software(NIH, Bethesda).Results
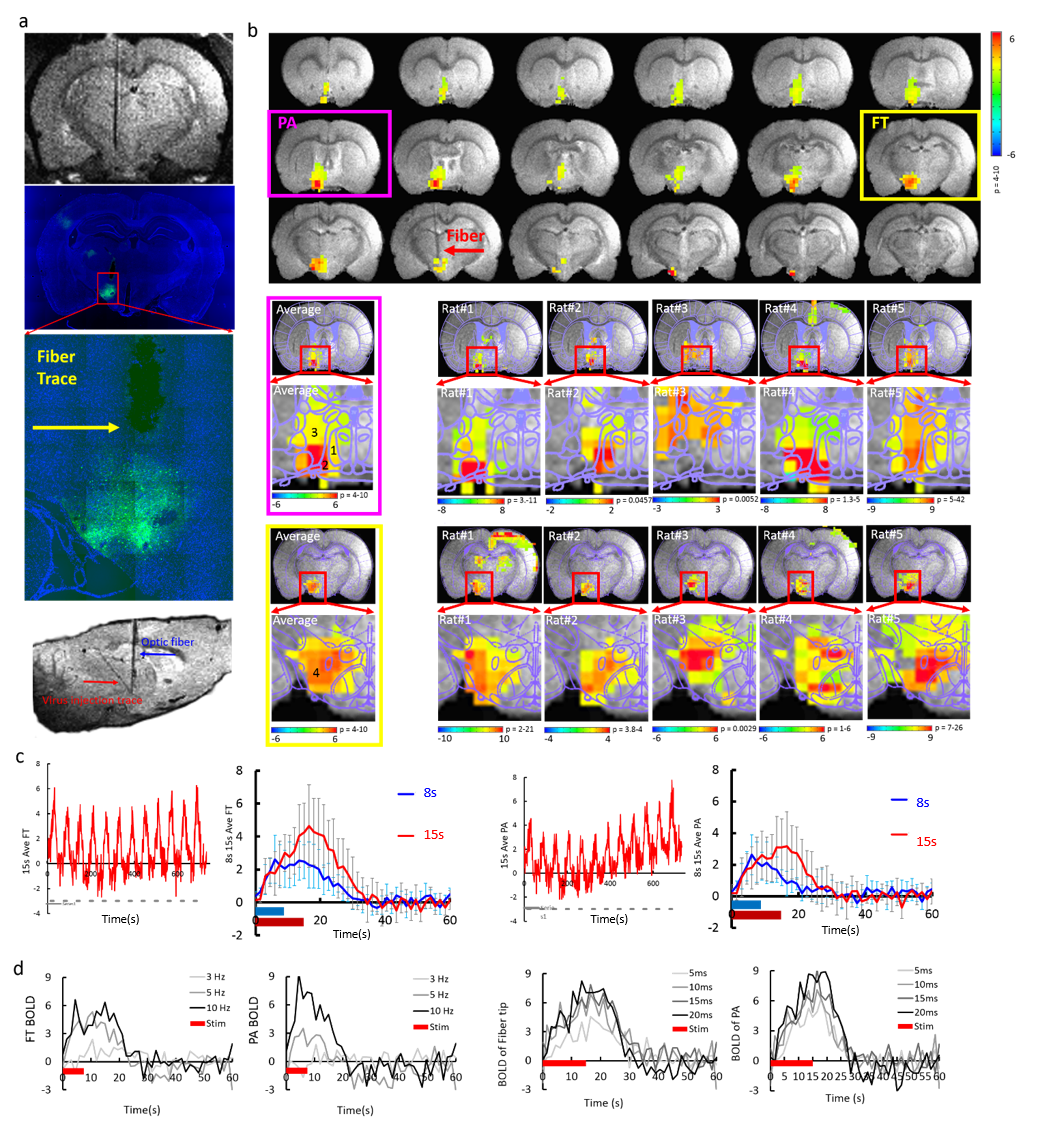
Blue light pulses (473nm) delivered to the LH triggered the optogenetically driven BOLD signal, which was located not only at the LH region close to the tip of the optical fiber, but also in the lateral preoptic area (LPO), medial preoptic area (MPA), medial preoptic nucleus, lateral part (MPOL) and Strial part of the preoptic area (StA) (Fig. 2b). These widespread changes in BOLD activity were reliably detected in 5 different rats with similar spatial patterns by coregistering the brain atlas to individual rat functional map (Fig. 2b). Quantitative analysis showed robust BOLD signals from the LH and the preoptic area(PA) with optogenetic activation (Fig. 2c, d).Conclusion
Optogenetic activation of the LH can be directly driven by MgRA system to produce highly reliable activation patterns in LH and the projected regions including LPO, MPA, MPOL and StA across different animals. This work makes it possible to further target different LH neuronal populations and decipher the cell-type specific functional projections in future studies.Acknowledgements
We thank Mr. Shanyi Yu for building up the first prototype of the robotic arm and Mr. Johannes Boldt for helping to improve the MgRA system. We thank Mr. Jan Kevin Schlüsener for technical support. This work is supported by the Max-Planck-Society and the China Scholarship Council (PhD fellowship to Yi Chen).References
1. M. Carus-Cadavieco, M. Gorbati, L. Ye, F. Bender, S. van der Veldt, C. Kosse, C. Borgers, S. Y. Lee, C. Ramakrishnan, Y. Hu, N. Denisova, F. Ramm, E. Volitaki, D. Burdakov, K. Deisseroth, A. Ponomarenko, and T. Korotkova, 'Gamma Oscillations Organize Top-Down Signalling to Hypothalamus and Enable Food Seeking', Nature, 542 (2017), 232-36.
2. G. D. Stuber, and R. A. Wise, 'Lateral Hypothalamic Circuits for Feeding and Reward', Nat Neurosci, 19 (2016), 198-205.
3. J. H. Jennings, R. L. Ung, S. L. Resendez, A. M. Stamatakis, J. G. Taylor, J. Huang, K. Veleta, P. A. Kantak, M. Aita, K. Shilling-Scrivo, C. Ramakrishnan, K. Deisseroth, S. Otte, and G. D. Stuber, 'Visualizing Hypothalamic Network Dynamics for Appetitive and Consummatory Behaviors', Cell, 160 (2015), 516-27.
4. X. Yu, Y. He, M. Wang, H. Merkle, S. J. Dodd, A. C. Silva, and A. P. Koretsky, 'Sensory and Optogenetically Driven Single-Vessel Fmri', Nat Methods, 13 (2016), 337-40.
Figures