1104
Measurement of diffusion exchange in yeast with Diffusion Exchange Spectroscopy (DEXSY)1Centre for Advanced Biomedical Imaging, Division of Medicine, UCL, London, United Kingdom, 2The Francis Crick Institute, London, United Kingdom, 3Centre for Medical Imaging Computing, Department of Computer Science, UCL, London, United Kingdom
Synopsis
We demonstrate the feasibility of measuring diffusion exchange using Diffusion Exchange Spectroscopy (DEXSY), in yeast. We show data acquired from yeast suspensions with a 9.4 T Varian scanner using two different sets of DEXSY scan parameters in order to probe different diffusion lengths.
Introduction:
We present experimental data showing that we can observe the diffusion exchange of water in a yeast suspension using the DEXSY double diffusion encoding technique [1]. We use yeast as it is a well established model for cellular biology studies in eukryotes [2]. Cell membrane permeability varies in both healthy and diseased tissues, in particular in tumors and the brain [3]. There has been recent interest in using diffusion MRI and Filter Exchange Imaging (FEXI) to image gene expression in cases where water exchange in tissues is altered due to modified aquaporin expression and UT-B reporter gene expression [4,5]. However these techniques may lack specificity since there are a wide range of permeabilites present in tissue. DEXSY may be more effective for studying these processes as it is a model-free approach. DEXSY MRI has previously been used to measure exchange in biological contexts [6,7,8], but the physical mechanism underlying the measurement of diffusion exchange with this technique has not been validated. Our previous simulations demonstrated that diffusion exchange of water molecules can be measured using DEXSY in nervous tissue, over a wide range of permeabilities, and that measured exchange increases with permeability [9,10]. We also defined the Diffusion Exchange Index (DEI) which is the ratio of the sum of the volume of the exchange peaks to the sum of the volume of the intra-cellular and extra-cellular diffusion peaks. These results prompted us to evaluate the current study, to investigate the use of DEXSY to measure diffusion exchange in yeast. As we expect that we should be able to extend this work from yeast to more complex models and to in-vivo experiments.Methods:
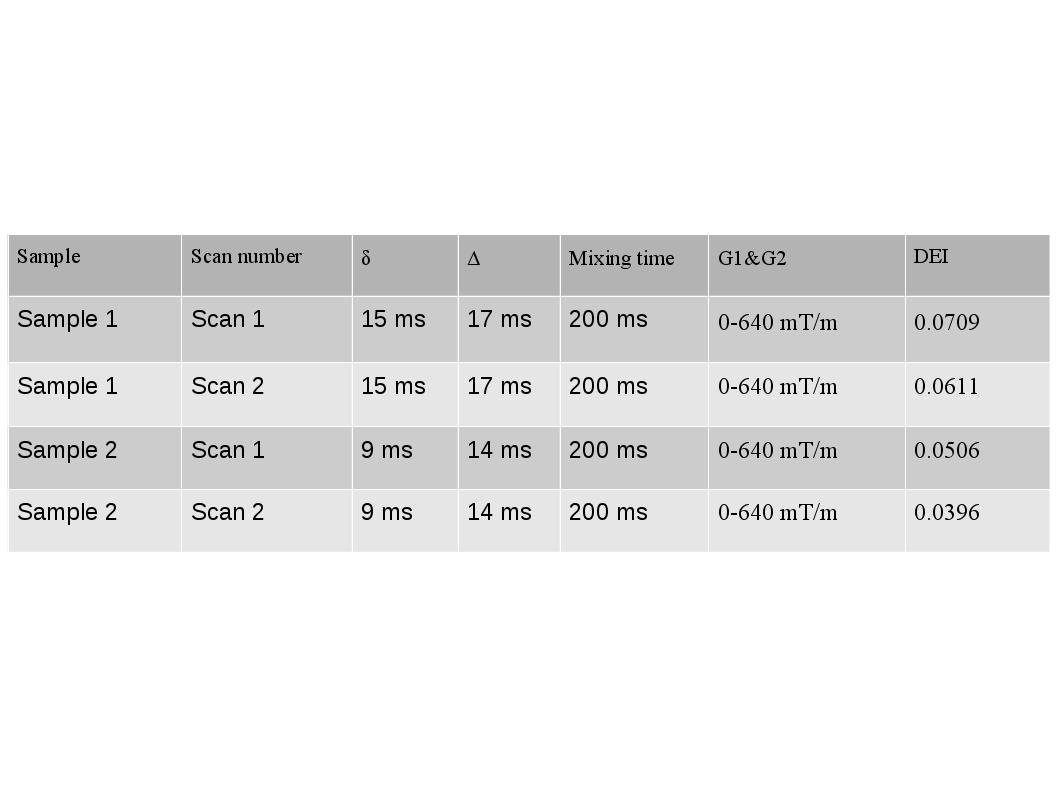
Our experimental data was acquired using a 9.4 T Varian VNMRS horizontal bore scanner, using two samples consisting of 15 ml falcon tubes full of a suspension of l'hirondelle cake yeast in PBS, the two samples made from similar concentrations of yeast suspension were scanned using different empirically optimised DEXSY scan parameters sensitive to different diffusion lengths (4.12 µm and 3.74 µm respectively). Data were acquired from sample 1 which was made from a suspension of 18g of yeast suspended in 10 ml of PBS, with DEXSY scan parameters of δ = 15 ms, Δ = 17 ms, tm=200 ms, G1&G2 =0-640 mT/m in 16x16 steps. Data was also acquired separately from sample 2, a suspension consisting of 22 g of yeast suspended in 10 ml PBS, with DEXSY scan parameters of δ = 9 ms, Δ =14 ms, tm=200 ms, G1&G2 =0-640 mT/m in 16x16 steps. The samples were scanned repeatedly to test the robustness of the technique. 2D Inverse Laplace transform software, kindly provided by Petrik Galvosas [11], was used to reconstruct DEXSY data in order to give diffusion-diffusion exchange plots.Results:
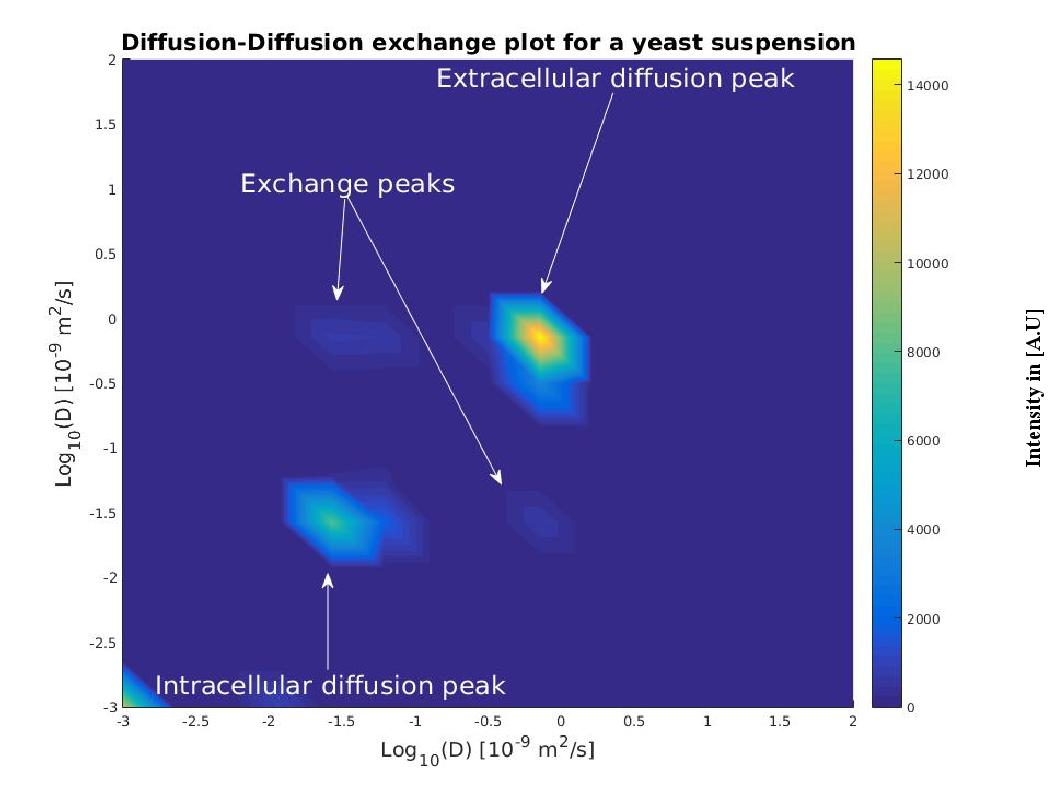
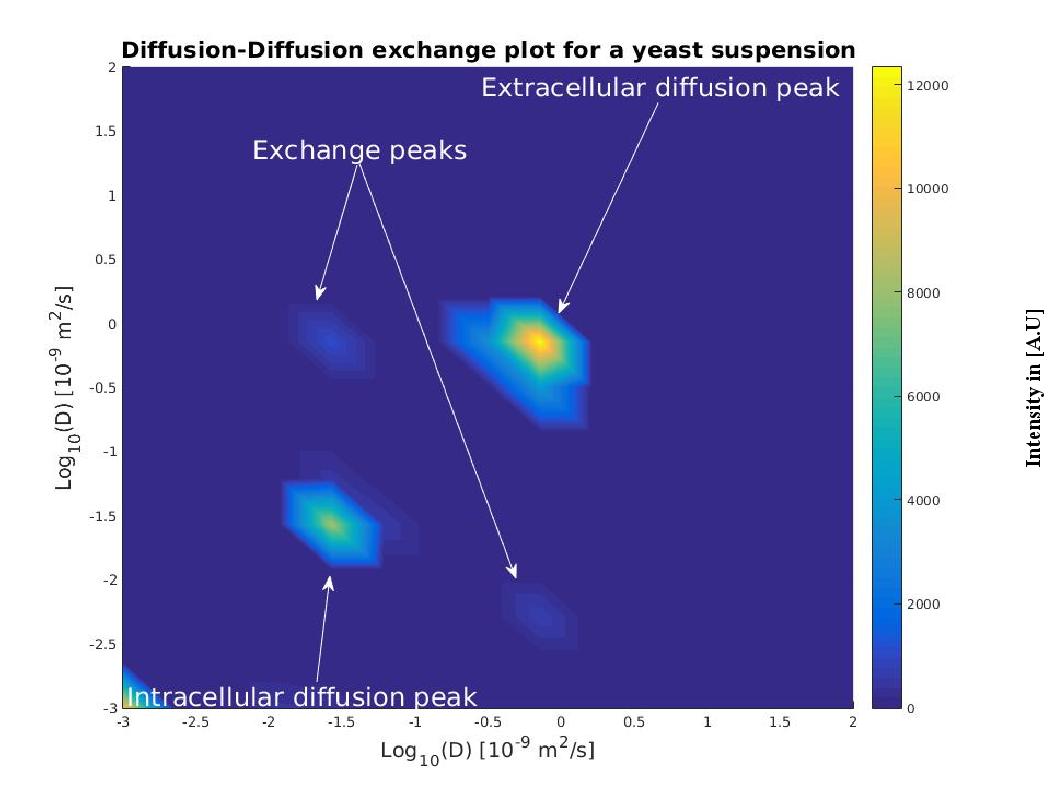
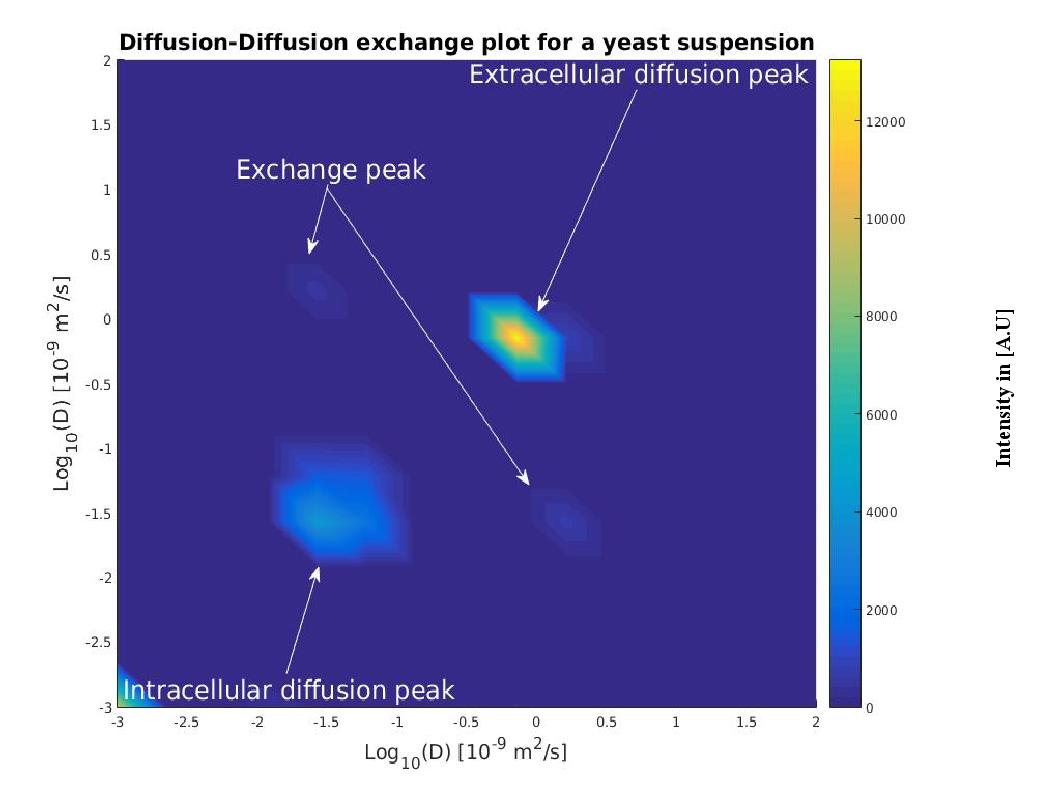
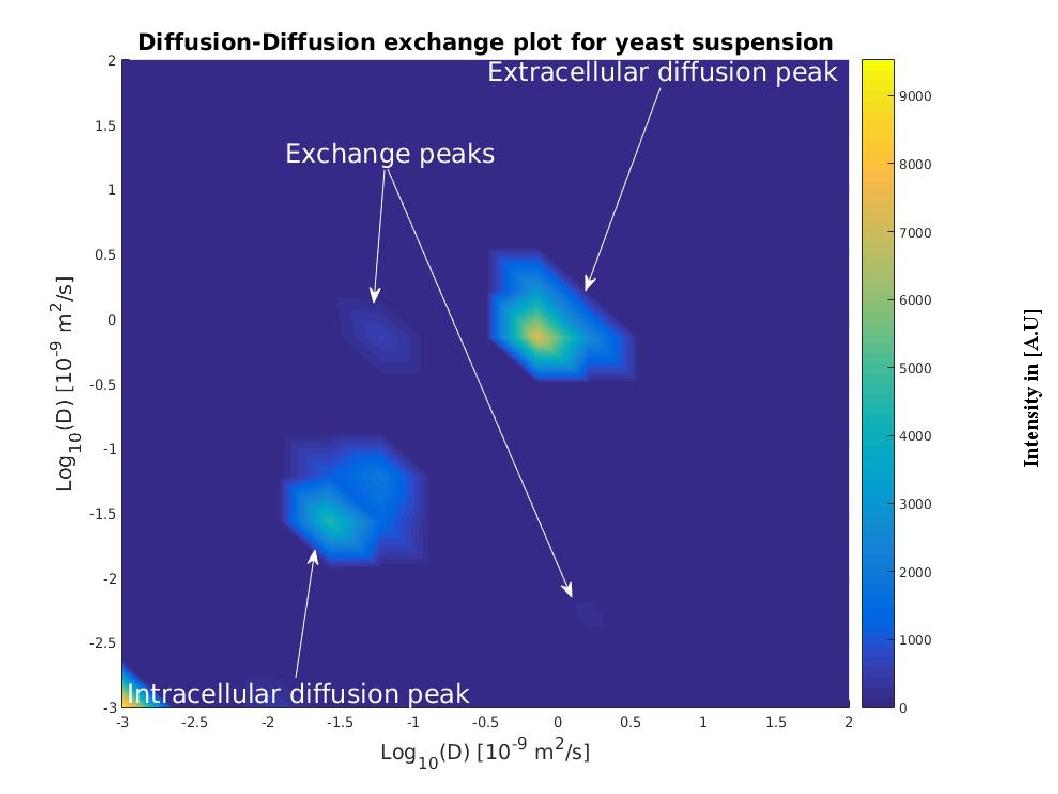
In diffusion-diffusion exchange plots, diagonal peaks represent diffusion within different compartments (here, intracellular and extracellular) and cross peaks represent diffusion exchange between compartments. Figures 1 and 2 show DEXSY scans from the first and second scan from sample 1. Diffusion exchange, intra-cellular and extra-cellular diffusion peaks are present in both scans. We measured the DEI=0.0709 for the first scan and the DEI = 0.0611 for the second scan. Figures 3 and 4 show DEXSY scans from the first and second scan from sample 2. Diffusion exchange peaks and intra-cellular and extra-cellular diffusion peaks are present in both acquisitions. For the first scan DEI=0.0506 and for the second scan DEI=0.0396. The position of the peaks remains consistent between the first and second scan for each sample, suggesting good repeatability. There is a reduction in the size of the exchange peaks between the first and the second scan for each sample, possibly due to a reduction in the viability of the yeast. All of the scan parameters alongside the DEI values are shown in figure 5. We can see that the values of DEI for the first and second scans for both samples are relatively consistent suggesting good repeatability.
Discussion and conclusion:
The results demonstrate that we can observe diffusion exchange in-vitro in yeast cells using DEXSY with two different sets of DEXSY scan parameters, which are sensitive to two different diffusion lengths. In future studies we aim to establish whether the relationship we have found in previous studies demonstrating that DEI increases with permeability in silico [9,10], also holds out in-vitro, in order to determine whether we can use DEI to quantify cell membrane permeability.Acknowledgements
With thanks to Petrik Galvosas for his inverse Laplace software.References
[1]P. T. Callaghan, I Furo, Journel of Chemical Physics, 120(8):4032-4038, (2004)
[2]W. H. Mager, J. Winderickx, TRENDS in Phrarmacological Sciences ,26(5):265-273,(2005)
[3]S. Lasic et al, Magnetic Resonance in Medicine, (2011).
[4]A. Mukherjee et al, Nature Communications 7, 13891 (2016)
[5]F. Schilling et al. Nature Biotechnology 35, 75–80 (2017)
[6]B. Siow et al., Proc. ICMRM 12, Cambridge, UK (2013), P43
[7]B. Siow at al., Proc. MRPM 12, Wellington, NZ, (2014), P06
[8]D. Benjamini et al., Phys. Rev. Lett. 118, 158003 (2017)
[9]J.O. Breen-Norris et al., Proc ISMRM 17, Honolulu, USA, (2017), 1740
[10]J.O. Breen-Norris et al., Proc ICMRM 17, Halifax, CAN, (2017), P64
[11]Y.-Q.-Song et al, Journal of Magnetic Resonance, (2002)
Figures