1102
Echo Time Dependence of Double Diffusion Encoding Measurements of Microscopic Diffusion Anisotropy1Electrical Engineering, Stanford University, Stanford, CA, United States, 2Radiology, Stanford University, Stanford, CA, United States
Synopsis
In this study, double diffusion encoding (DDE) MRI measurements of microscopic fractional anisotropy (μFA) are compared at two different echo times (TE). At longer TE, higher mean μFA values were measured in single fiber regions but not in crossing fiber regions. Consistent with prior work on the TE dependence of fractional anisotropy (FA) the largest differences were found in regions known to be highly myelinated such as the genu of the corpus callosum.
Introduction:
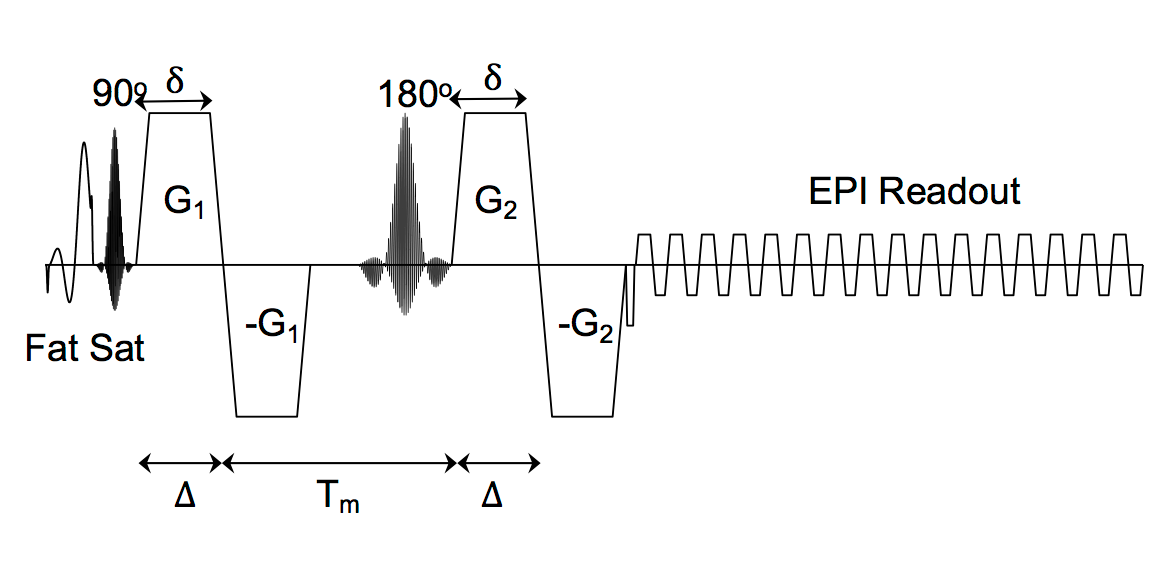
Double diffusion encoding (DDE)1-5 measurements of microscopic diffusion anisotropy (μFA)6,7 reflect the shape of tissue compartments independent of the orientation distribution of those compartments within a voxel, addressing a key limitation of diffusion tensor imaging (DTI). DDE pulse sequences encode diffusion twice before the readout8 (Fig. 1) requiring longer echo times (TE) to achieve the same diffusion weighting. Recent work from our group examined μFA changes in multiple sclerosis9 and found a differential sensitivity between μFA and FA in normal appearing white matter. This differential sensitivity disappeared when the TEs for the DTI and DDE sequences were matched, suggesting that the differences in μFA and FA could be the result of the longer TE of the DDE acquisition. This is in line with prior work showing the TE-dependence of in vivo brain FA measurements10-12. In this study, the TE-dependence of μFA measurements in white matter is characterized by acquiring DDE data at two different echo times.Methods:
Data Acquisition:
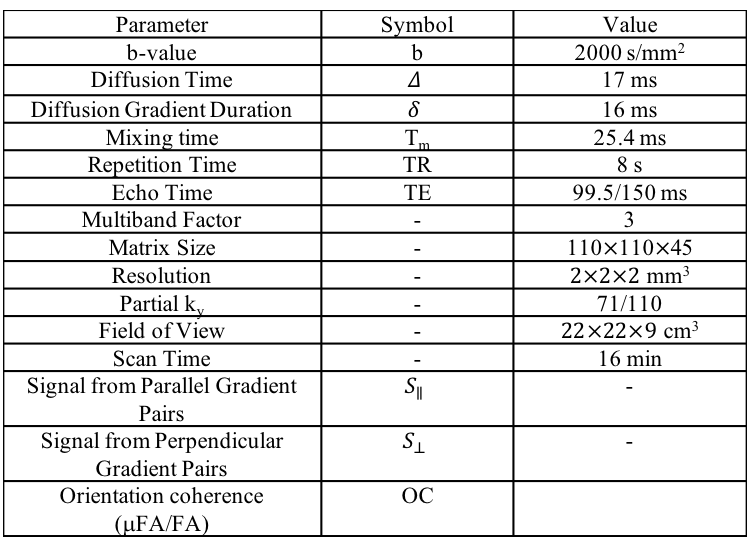
IRB approved experiments were conducted on 4 healthy subjects using a 3T whole-body MR system (Premier, GE Healthcare, Madison, Wisconsin) equipped with a 32-channel phased array head coil (Nova Medical). Each subject was examined with a custom single spin-echo DDE sequence with bipolar diffusion gradients on either side of the refocusing pulse (Fig. 1) at TE1=99.5 and TE2=150ms with parameters shown in Table 1. The gradient encoding scheme consisted of 3 B0 images, 60 images with parallel gradient pairs, and 60 images with orthogonal gradient pairs. An additional 11 B0 images were acquired with the phase encoding polarity reversed for EPI distortion correction.
Data Analysis:
Baseline diffusion images were corrected for eddy current distortions and bulk motion using “eddy” and “topup” from the FMRIB Software Library13,14. μFA maps were computed from the corrected diffusion images according to
$$\mathrm{\mu FA}^2=\frac{\varepsilon}{\frac{2}{3}\varepsilon+\frac{1}{10}b^2\mathrm{MD}^2} \hspace{1cm} (1)$$
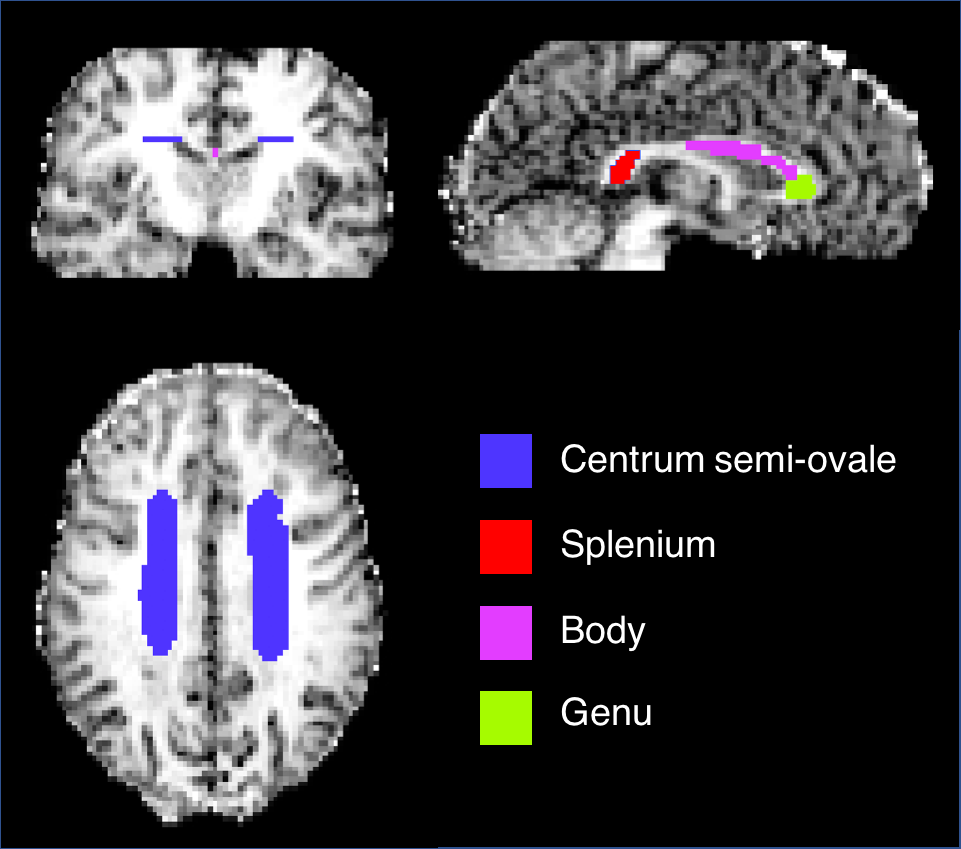
,where $$$\varepsilon=\log \left( \frac{1}{N}\sum_{i=1}^{N}{S_\parallel}\right) - \log \left( \frac{1}{N}\sum_{i=1}^{N}{S_\perp}\right)$$$, $$$b$$$ is the magnitude of the total b-vector, $$$N$$$ is the number of diffusion gradient pairs, and MD is the mean diffusivity. The linear transformation between the mean B0 images from TE1 and TE2 images were found using “flirt” from the FMRIB Software Library15. The half transform and inverse half transform between the TE1 and TE2 images were used to co-register the μFA maps. The distribution of μFA measurements was compared in global white matter (μFA > 0.5), single fiber regions (orientation coherence (OC) > 0.7) and crossing fiber regions (OC < 0.5). In addition, μFA measurements were compared within manually drawn regions of interest (ROI) (Fig. 2) in the genu, body, and splenium of the corpus callosum, and the centrum semi-ovale.
Results:
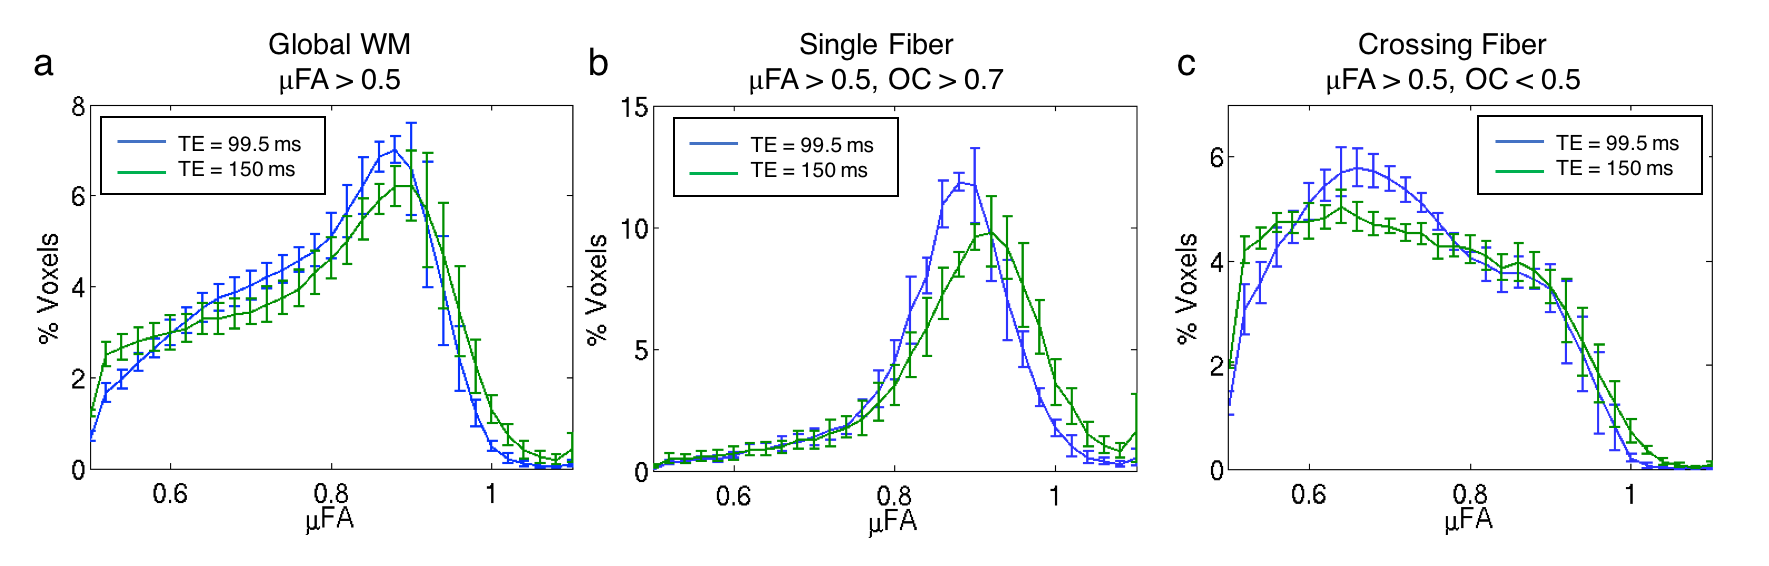
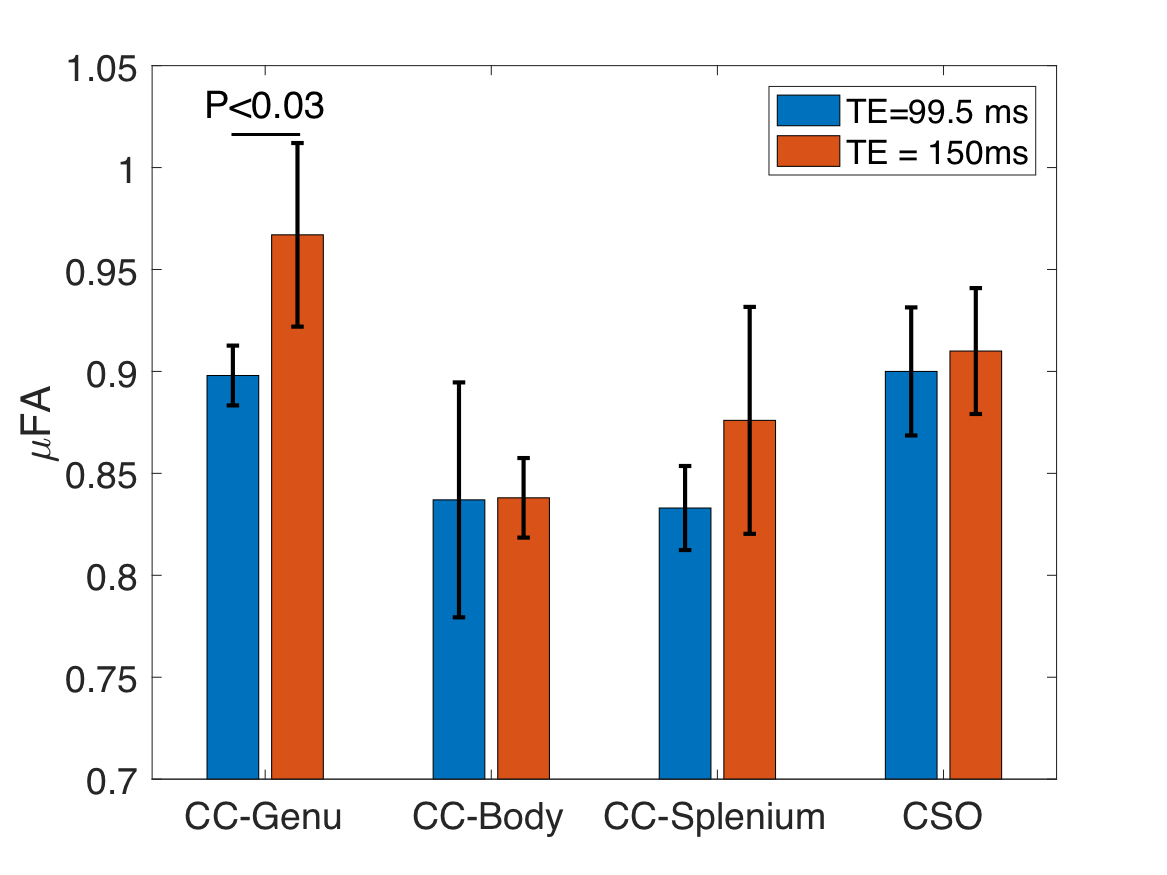
The μFA distributions in the global white matter, single fiber regions, and crossing fiber are shown in Figure 3. The histogram of μFA values in the single fiber region are shifted toward higher values for TE=150ms compared to TE=99.5ms. The μFA distribution within crossing fiber regions is similar at both TEs above μFA = 0.8. However, there is a peak in the distribution at μFA=0.65 for TE=99.5ms while the distribution is closer to uniform for TE=150ms. The mean μFA within the genu of the corpus callosum was significantly higher (P<0.03) for TE=150ms than TE=95.5ms (Fig. 4). No significant differences were found in the body and splenium of the corpus callosum or in the centrum semi-ovale.Discussion:
An increase in μFA with TE within single fiber regions of white matter such as the genu is demonstrated for the first time. This dependence is consistent with previous DTI measurements of net diffusion anisotropy10,12. The echo time dependence of diffusion measurements has been hypothesized to come from differences in compartmental T2 relaxation times11 or myelin water exchange10. Both prior work with FA and the current μFA results presented here show the strongest TE-dependence within heavily myelinated regions such as the genu of the corpus callosum, which is consistent with simulations of myelin water exchange10. The lack of significant differences in other regions could be due to the limited TE range accessible with DDE. While the SNR has not been equalized between the short and long TE acquisitions, it has been shown that signal biases due to low SNR primarily affect regions of low μFA6, whereas the key differences demonstrated in this study are in regions of high μFA.Conclusion:
A significant difference in μFA measurements was found for DDE measurements performed at different TEs. Understanding the TE dependence of microscopic diffusion measurements is critical to optimizing the sensitivity of DDE to changes in tissue microstructure.Acknowledgements
Funding provided by an NSF-GRFP, NIH: R01-NS095985, S10-RR026351, P41-EB015891, GE Healthcare and the Dana Foundation.References
1. Mitra PP. Multiple wave-vector extensions of the NMR pulsed-field-gradient spin-echo diffusion measurement. Phys Rev B Condens Matter 1995;51(21):15074-15078.
2. Cheng Y, Cory DG. Multiple scattering by NMR. Journal of the American Chemical Society 1999;121(34):7935-7936. 3. Koch MA, Finsterbusch J. Compartment size estimation with double wave vector diffusion-weighted imaging. Magn Reson Med 2008;60(1):90-101.
4. Ozarslan E, Basser PJ. Microscopic anisotropy revealed by NMR double pulsed field gradient experiments with arbitrary timing parameters. J Chem Phys 2008;128(15):154511.
5. Shemesh N, Jespersen SN, Alexander DC, Cohen Y, Drobnjak I, Dyrby TB, Finsterbusch J, Koch MA, Kuder T, Laun F and others. Conventions and nomenclature for double diffusion encoding NMR and MRI. Magn Reson Med 2016;75(1):82-7.
6. Lasič S, Szczepankiewicz F, Eriksson S, Nilsson M, Topgaard D. Microanisotropy imaging: quantification of microscopic diffusion anisotropy and orientational order parameter by diffusion MRI with magic-angle spinning of the q-vector. Frontiers in Physics 2014;2:11.
7. Jespersen SN, Lundell H, Sønderby CK, Dyrby TB. Commentary on “Microanisotropy imaging: quantification of microscopic diffusion anisotropy and orientation of order parameter by diffusion MRI with magic-angle spinning of the q-vector”. Frontiers in Physics 2014;2:28.
8. Lawrenz M, Finsterbusch J. Detection of microscopic diffusion anisotropy on a whole-body MR system with double wave vector imaging. Magn Reson Med 2011;66(5):1405-15.
9. Yang G, Tian Q, Leuze C, Wintermark M, McNab J. Visualizing Axonal Damage in Multiple Sclerosis Using Double Diffusion Encoding MRI in a Clinical Setting. Proc. Intl. Soc. Mag. Reson. Med. 25 (2017) 2017.
10. Lin M, He H, Tong Q, Ding Q, Yan X, Feiweier T, Zhong J. Effect of myelin water exchange on DTI-derived parameters in diffusion MRI: Elucidation of TE dependence. Magn Reson Med 2017.
11. Veraart J, Novikov DS, Fieremans E. TE dependent Diffusion Imaging (TEdDI) distinguishes between compartmental T2 relaxation times. Neuroimage 2017. 12. Qin W, Yu CS, Zhang F, Du XY, Jiang H, Yan YX, Li KC. Effects of echo time on diffusion quantification of brain white matter at 1.5 T and 3.0 T. Magn Reson Med 2009;61(4):755-60.
13. Andersson JL, Sotiropoulos SN. An integrated approach to correction for off-resonance effects and subject movement in diffusion MR imaging. Neuroimage 2016;125:1063-78.
14. Andersson JL, Skare S, Ashburner J. How to correct susceptibility distortions in spin-echo echo-planar images: application to diffusion tensor imaging. Neuroimage 2003;20(2):870-88.
15. Jenkinson M, Beckmann CF, Behrens TE, Woolrich MW, Smith SM. Fsl. Neuroimage 2012;62(2):782-90.
Figures