1101
From physical chemistry to human brain biology: unconstrained inversion of 5-dimensional diffusion-T2 correlation data1CUBRIC, School of Psychology, Cardiff University, Cardiff, United Kingdom, 2Physical Chemistry, Department of Chemistry, Lund University, Lund, Sweden, 3Random Walk Imaging AB, Lund, Sweden, 4Clinical sciences, Lund, Lund University, Lund, Sweden, 5Brigham and Women's Hospital, Harvard Medical School, Boston, MA, United States
Synopsis
Studying the diffusion MRI signal as a function of more experimental parameters allows to establish correlations between different chemical and physical properties and to disentangle different compartments. Such measurements are common in the field of physical chemistry to characterise heterogeneous media, but are rendered impractical on human scanners due to hardware limitations. Here, we leverage ultra-strong gradients to acquire a 5-dimensional in-vivo human brain correlation dataset, which allows the characterisation of microstructural features through unconstrained inversion.
Introduction & Background
The concept of studying the signal attenuation as a function of more than one experimental variable has been used extensively in NMR to characterise heterogeneous materials. Motivated by the possibility to distinguish between environments with different physical and chemical properties and to establish correlations between these properties, diffusion-T2-relaxometry varies both b-value and echo time (TE) in repeated spin-echo experiments1-4. Subsequently, inversion techniques can transform these 2-dimensional signals into a joint diffusivity-T2 distribution5.
In the case of anisotropic diffusion, however, a single diffusion-dimension is insufficient to describe the process in each microenvironment. By adding a shape dimension, the medium can now be described by a distribution of diffusion tensors (DTD) with varying shape $$$D_{\Delta}$$$ and size $$$D_{iso}$$$ (i.e. average diffusivity)6. Previous work has obtained the full shape-size-DTD in liquid crystals from unconstrained inversion based on data averaged over directions7. Fundamentally, this inversion relies on the availability of data with not only different diffusion encoding directions and b-values, but also different encoding “shapes” $$$b_{\Delta}$$$, as characterised by the b-tensor $$$\mathbf{B}$$$8,9. This approach was only recently further extended to obtain the full shape-size-orientation-DTD – adding another two dimensions $$$\theta$$$ and $$$\phi$$$ – in orientationally ordered liquid crystals10. The 5-dimensional T2-DTD $$$P$$$ provides a comprehensive description of the chemical composition, density, size, shape, and orientation of a heterogeneous medium:
$$S(TE,b,b_{\Delta},\Theta,\Phi)=S(0)\int^\inf_0\int^\inf_0\int^1_{-1/2}\int^\pi_0\int^{2\pi}_0K(TE,b,b_{\Delta},\Theta,\Phi,T2,D_{iso},D_{\Delta},\theta,\phi)\times P(T2,D_{iso},D_{\Delta},\theta,\phi)d\phi d\theta dD_{\Delta}dD_{iso}dT2.$$
Critically, such measurements have been made on small bore systems with field gradient strengths that outstrip those typically available for human brain imaging. In this work, we translate the multi-dimensional approach to the human brain, leveraging the ultra-strong gradients of a Connectom scanner, and obtain the full T2-DTD without imposing priors on the number of compartments and without fixing parameters. We perform tractography on the DTD, allowing for the visualisation of along-tract properties of the tensor that was used for tract-propagation.
Methods
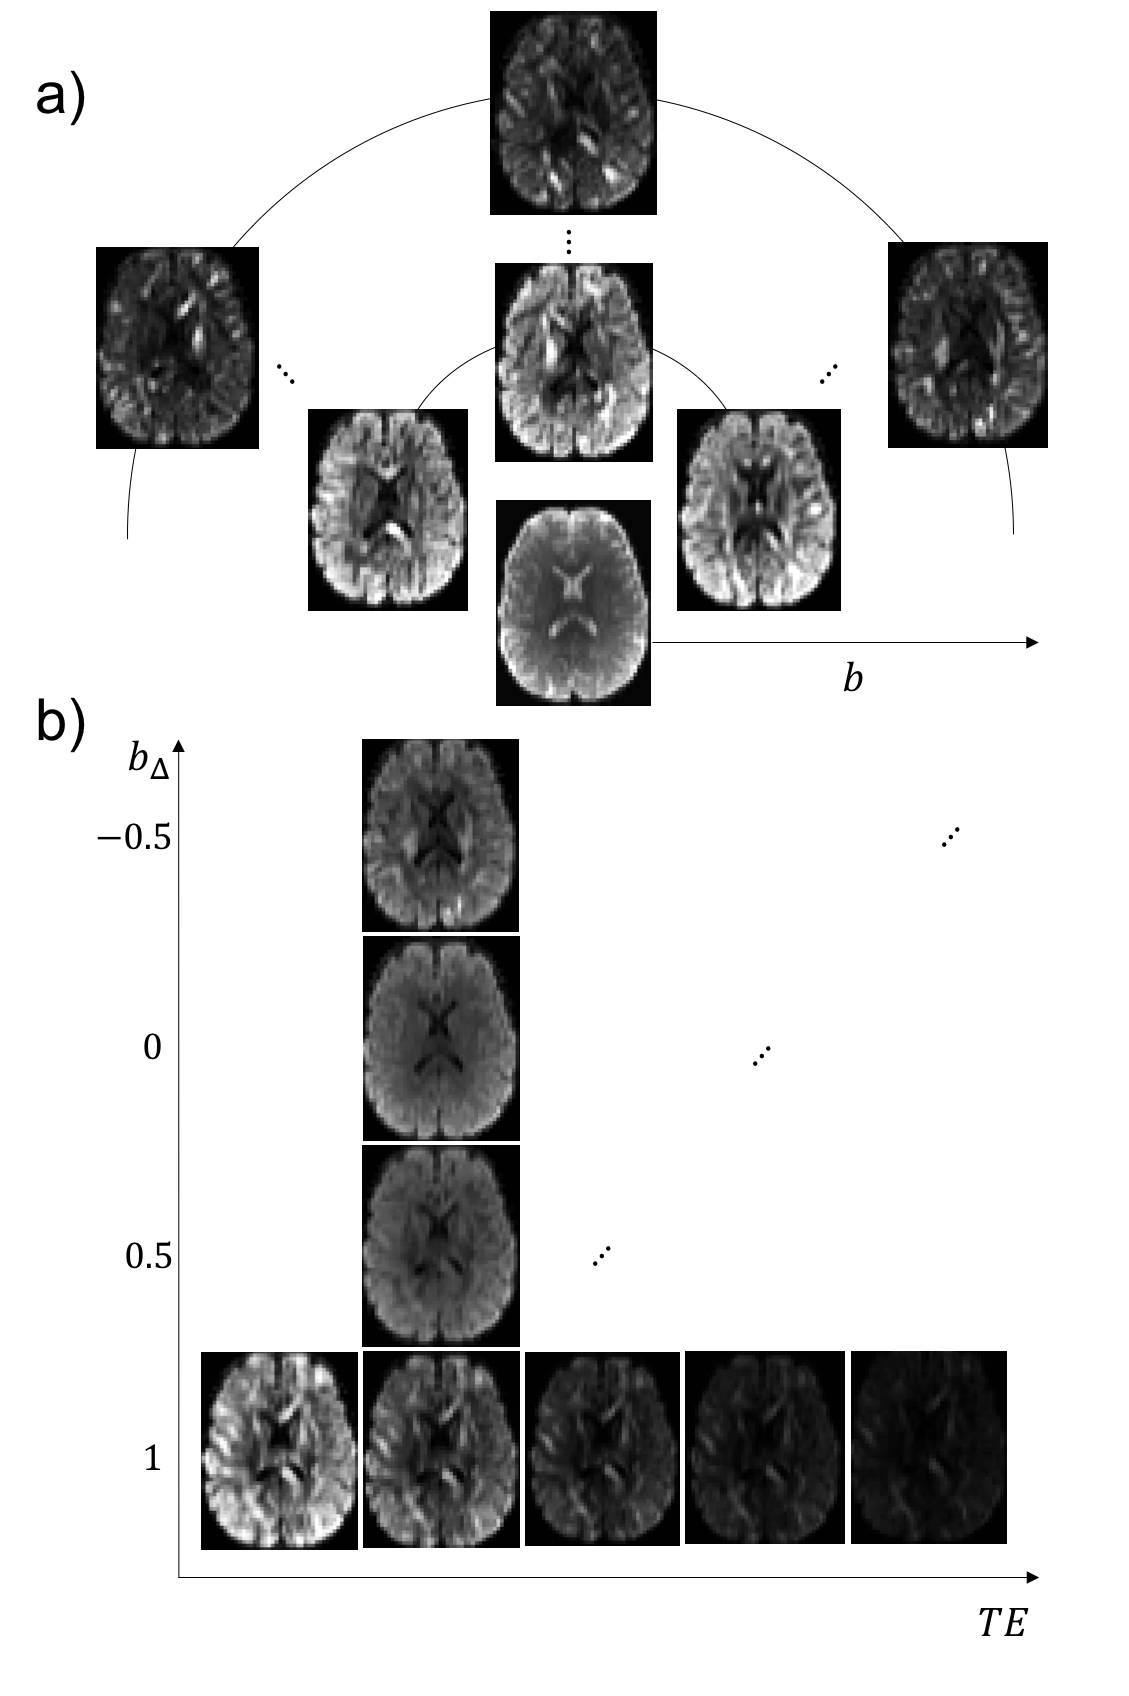
Data: A healthy volunteer was scanned on a 3T 300mT/m-gradient Siemens Connectom system with a prototype spin-echo sequence that enables diffusion encoding with arbitrary gradient waveforms11. Images with different b-tensors and TE were acquired, yielding a 5-dimensional parameter space (Fig.1). The waveforms were numerically optimized12, compensated for Maxwell terms13 and matched to have similar diffusion times14. Remaining settings were: no in-plane acceleration, voxel size = 3x3x3 mm3, matrix=70x70, 15 slices, TR=2800ms, partial-Fourier=6/8, bandwidth=2100 Hz/pix
Processing: The data were corrected for misalignment due to subject motion and eddy currents15,16. The T2-DTD was estimated using a non-negative least squares algorithm that doesn’t assume a fixed number of compartments7. Briefly, the inversion is performed via a directed iterative approach wherein randomly generated $$$[T2,\mathbf{D}]$$$ sets are successively fitted to the measured signal in order to find the ten most probable $$$[T2,\mathbf{D}]$$$ solutions. While this approach allows us to obtain a T2-DTD distribution that agrees well with the acquired data, such solutions are by no means unique. Tractography on DTD components with an FA>0.2 was performed using the FiberNavigator17.
Results
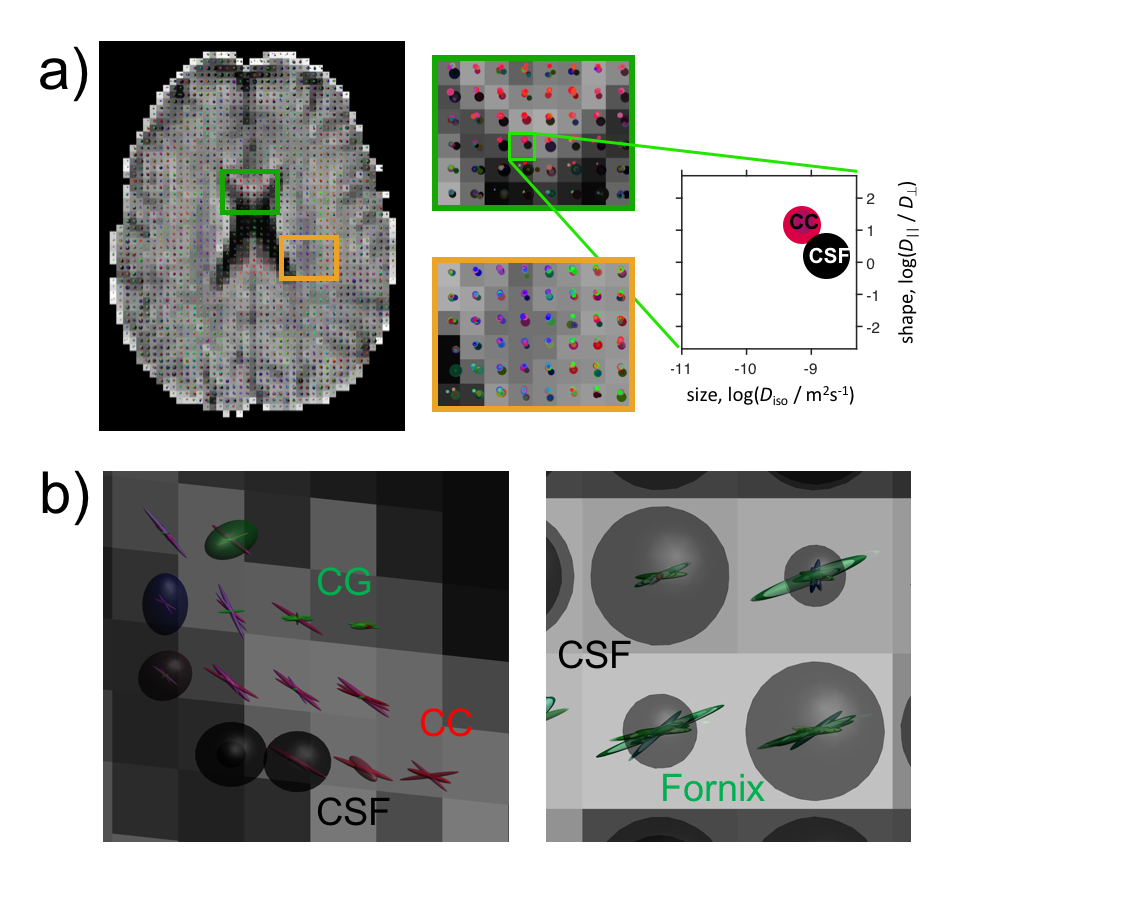
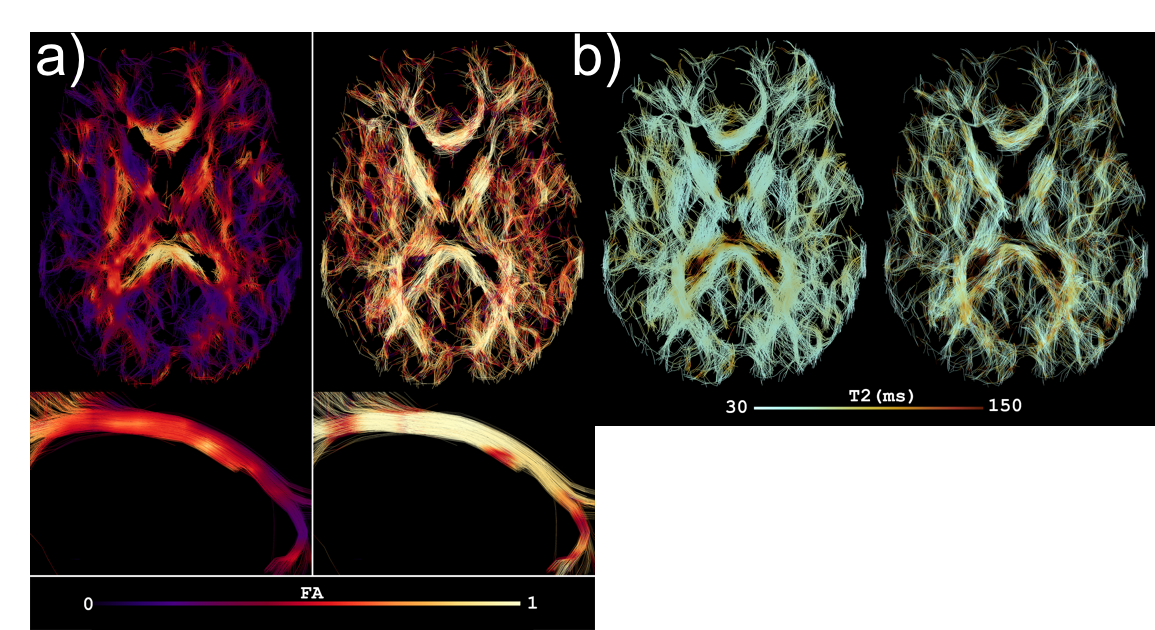
Fig.2a shows an overview of the DTD in the human brain, where each tensor is coloured according to its orientation, and each voxel represents a plot of its shape and size. In the glyph representation in Fig.2b at a location where the corpus callosum (CC) and cingulum (CG) cross, it can be appreciated that different bundles are represented by different tensors, that CSF is resolved as a separate compartment, and that the high degree of curvature in the CC is captured by dispersing tensors. Fig.3 shows a tractography example on the full T2-DTD. Fig.4 shows colouring of the tracts according to properties of the tensors that were used for tracking. The bottom image shows a reconstruction of the fornix, a pathway which is challenging to track because of CSF contamination. The colouring reveals a much higher per-tensor FA compared to voxel-wise FA along the tract, attributed to CSF being resolved as a separate compartment.Discussion & Conclusion
The 5-dimensional acquisition protocol presented here results in the most comprehensive in-vivo human brain correlation dataset to-date. The richness of the data allows the characterisation of microstructural features through an unconstrained inversion. Because of the few assumptions, the approach could be invaluable in explorative neuroscience studies in health and disease where it is unclear what type of tissue constituents are present, and could be used together with biophysical or statistical modelling to find more suitable sets of constraints.
We have performed fibre tractography on the full DTD which resulted in bundles consistent with anatomy. The combination of b-tensor shape and T2 makes this protocol highly useful for free water mapping and the investigation of tract- and compartment-specific diffusion properties and T2. The method is flexible and can be scaled down to lower dimensional correlation protocols.
Acknowledgements
We thank Siemens Healthcare for access to the pulse sequence programming environment, and Fabrizio Fasano from Siemens Healthcare for support. The work was supported by a Wellcome Trust Investigator Award (096646/Z/11/Z) and a Wellcome Trust Strategic Award (104943/Z/14/Z). The data were acquired at the UK National Facility for In Vivo MR Imaging of Human Tissue Microstructure funded by the EPSRC (grant EP/M029778/1), and The Wolfson Foundation. CMWT is supported by a Rubicon grant (680-50-1527) from the Netherlands Organisation for Scientific Research (NWO) and Wellcome Trust grant (096646/Z/11/Z). This study was supported by NIH grants P41EB015902 and P41EB015898, and the Swedish Foundation for Strategic Research AM13-0090References
[1] Galvosas P, Callaghan PT. Multi-dimensional inverse Laplace spectroscopy in the NMR of porous media. C R Phys 2010;11:172-180.
[2] Bernin D, Topgaard D. NMR diffusion and relaxation correlation methods: New insights in heterogeneous materials. Curr Opin Colloid Interface Sci 2013;18:166-172.
[3] Song Y-Q, Venkataramanan L, Kausik R, Heaton N. Two-dimensional NMR of diffusion and relaxation. In: Valiullin R, editor. Diffusion NMR of Confined Systems: Fluid Transport in Porous Solids and Heterogeneous Materials. Cambridge, UK: Royal Society of Chemistry; 2016. p 111-155.
[4] van Dusschoten D, de Jager PA, Van As H. Extracting diffusion constants from echo-time-dependent PFG NMR data using relaxation-time information. J Magn Reson A 1995;116:22-28.
[5] Hürlimann MD, Venkataramanan L, Flaum C. The diffusion–spin relaxation time distribution function as an experimental probe to characterize fluid mixtures in porous media. J Chem Phys 2002;117:10223-10232.
[6] Topgaard D. Multidimensional diffusion MRI. J Magn Reson 2017;275:98-113.
[7] de Almeida Martins JP, Topgaard D. Two-dimensional correlation of isotropic and directional diffusion using NMR. Phys Rev Lett 2016;116:087601.
[8] Eriksson S, Lasič S, Nilsson M, Westin C-F, Topgaard D. NMR diffusion encoding with axial symmetry and variable anisotropy: Distinguishing between prolate and oblate microscopic diffusion tensors with unknown orientation distribution. J Chem Phys 2015;142:104201.
[9] Westin, C. F., Knutsson, H., Pasternak, O., Szczepankiewicz, F., Özarslan, E., Van Westen, D., Mattisson, C., Bogren, M., O'donnell, L. J., Kubicki, M., Topgaard, D. & Nilsson, M. 2016. Q-space trajectory imaging for multidimensional diffusion MRI of the human brain. Neuroimage, 135, 345-62.
[10] Topgaard D. Diffusion tensor distribution imaging. Proc Intl Soc Mag Reson Med 2017;25:0279.
[11] Szczepankiewicz, F., Sjölund, J., Ståhlberg, F., Lätt, J. & Nilsson, M. 2016. Whole-brain diffusional variance decomposition (DIVIDE): Demonstration of technical feasibility at clinical MRI systems. arXiv:1612.06741.
[12] Sjölund J, Szczepankiewicz F, Nilsson M, Topgaard D, Westin C-F, Knutsson H. Constrained optimization of gradient waveforms for generalized diffusion encoding. J Magn Reson 2015;261:157-168.
[13] Szczepankiewicz, F. and Nilsson, M. 2018. Maxwell-compensated waveform design for asymmetric diffusion encoding. Submitted to Int. Soc. Magn. Reson. Med. Paris, France.
[14] Lundell, H., Nilsson, M., Dyrby, T. B., Parker, G. J., Hubbard, P., Zhou, F., Topgaard, D. & Lasic, S. 2017. Microscopic anisotropy with spectrally modulated q-space trajectory encoding. Int. Soc. Magn. Reson. Med. Honolulu, Hawaii.
[15] Nilsson, M., Szczepankiewicz, F., van Westen, D., & Hansson, O. 2015. Extrapolation-based references improve motion and eddy-current correction of high b-value DWI data: application in Parkinson’s disease dementia. PloS one, 10(11), e0141825.
[16] Klein et al., 2010. IEEE TMI 29(1),196-205
[17] Chamberland, M. et al. "Real-time multi-peak tractography for instantaneous connectivity display." Frontiers in neuroinformatics 8 (2014).
Figures